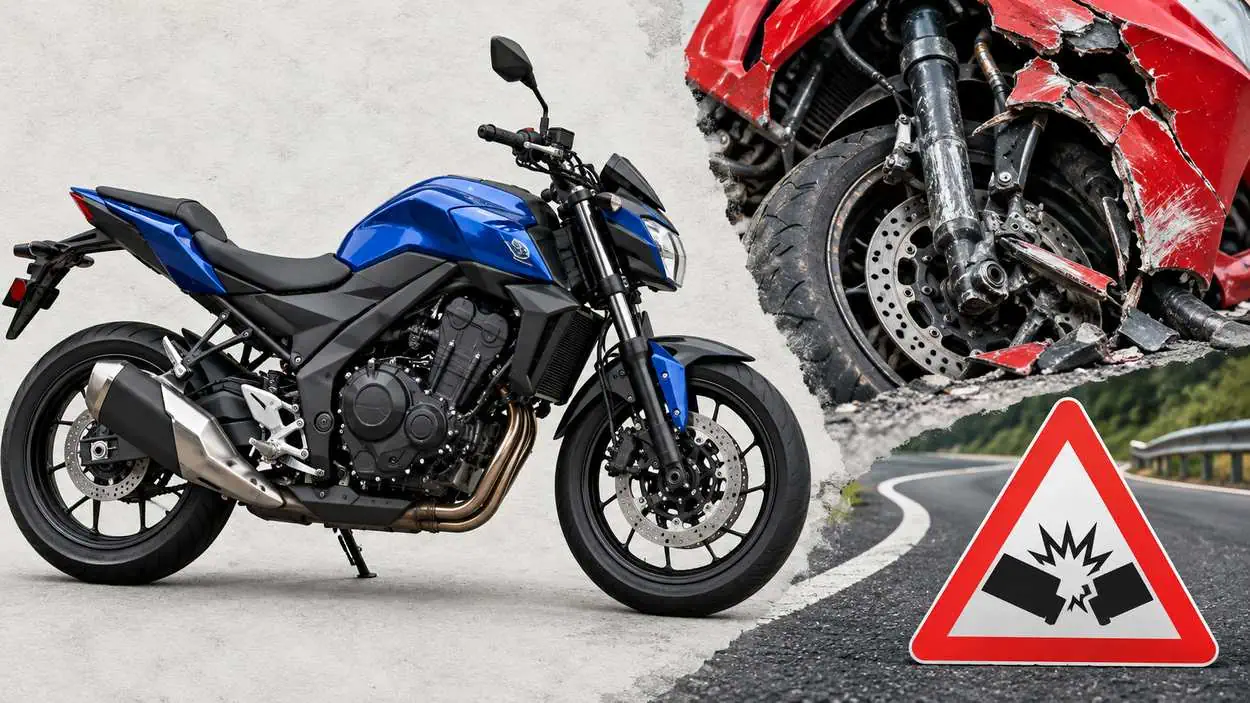





The average motorcycle collision claim cost $10,044 for 2020-24 model year motorcycles, according to the Highway Loss Data Institute (HLDI). HLDI’s average stood at $7,455 per claim for 2011-15 models, while claim frequency eased to 2.7 claims per 100 insured vehicle years for 2020-24 models. These motorcycle insurance industry statistics point to bigger repair bills, rather than more claims per insured bike, as the force behind rising collision losses.
In 2024 there were 6,228 motorcyclists killed, 16% of all traffic fatalities, according to the National Highway Traffic Safety Administration (NHTSA). Progressive, the largest writer of motorcycle insurance in the United States based on 2024 premiums written, groups motorcycles with RVs and watercraft in its special lines products. The sections below track insurer books, claim costs, theft, crash risk and the rider factors behind motorcycle premiums.
Key Takeaways
- HLDI’s average motorcycle collision claim rose 22.7% in nominal dollars from $8,186 for 2016-20 model years to $10,044 for 2020-24 model years.
- Supersport motorcycles had the highest relative overall collision losses (350) among 2020-24 model years, and scooters had the lowest (19).
- Antilock braking systems (ABS) were associated with claim frequency reductions of 25% under collision and 29% under medical payment coverage, per HLDI’s May 2025 bulletin.
- A total of 44,564 motorcycles were reported stolen in 2025, with 41% eventually recovered, according to the National Insurance Crime Bureau (NICB).
- Per 100 million vehicle miles traveled in 2024, the motorcyclist fatality rate (28.00) was almost 27 times the passenger car occupant fatality rate (1.05).
- Progressive’s special lines policies in force grew 7% in 2025 and 9% in 2024.
Editor’s Choice
- Average motorcycle collision claim, 2020-24 model years: $10,044.
- Overall collision losses per insured vehicle year, 2020-24 model years: $271.
- Motorcyclists killed in US traffic crashes, 2024: 6,228.
- Motorcyclists injured in US traffic crashes, 2024: an estimated 86,887.
- Registered motorcycles in the US, 2024: 9,261,249.
- Economic cost of motorcycle rider crashes, 2019: $16.9 billion.
Motorcycle Insurance Industry Statistics: Market Leaders and Policies
- Progressive is the largest writer of motorcycle insurance in the United States, based on 2024 premiums written.
- The same ranking makes Progressive the second largest private passenger auto insurer and the twelfth largest homeowners insurance carrier.
- On the same 2024 premium basis, Progressive is the largest writer of commercial auto insurance in the United States.
- Progressive’s Personal Lines segment, which includes special lines products such as motorcycles, RVs and watercraft, represents 87% of companywide net premiums written.
- Special lines and personal property products each represent about 5% of Progressive’s total Personal Lines premiums.
- Special lines policies in force reached 6.998 million at December 31, 2025.
- Special lines policies in force grew 7% in 2025 and 9% in 2024.
- Progressive writes special lines products for 12-month terms, and 57% of special lines net premiums written came through the independent agency channel.
- Profitability in Progressive’s special lines products had a favorable 0.4 point impact on its personal vehicle combined ratio during 2025.
| Date | Special Lines Policies in Force (millions) |
|---|---|
| December 31, 2023 | 5.969 |
| December 31, 2024 | 6.520 |
| December 31, 2025 | 6.998 |
| July 31, 2026 | 7.351 |
| August 31, 2026 | 7.378 |
| September 30, 2026 | 7.390 |
Source: Progressive 2025 Annual Report, Progressive Monthly Results 2026
Progressive reports motorcycles inside special lines alongside RVs and boats. The policy count therefore tracks the whole recreational book, not motorcycles alone.
About This Data
Figures come from 15 sources published between September 2016 and October 2026. They are 4 Progressive filings and releases, 3 NHTSA reports and 5 HLDI loss reports. Three more come from the Insurance Institute for Highway Safety, the Insurance Information Institute and NICB. Market-research seller estimates are excluded, and figures are reviewed on a rolling basis and updated when sources publish new editions.

Motorcycle Collision Claim Severity Over Time
- HLDI’s average collision claim severity is $10,044 per claim for 2020-24 model year motorcycles insured under private motorcycle policies.
- The comparable average was $8,186 per claim for 2016-20 model years.
- Average claim severity rose 22.7% in nominal dollars between the 2016-20 and 2020-24 model-year cohorts.
- Scooters had the lowest relative claim severity (33) among 2020-24 model year motorcycles, while autocycles had the highest (195).
- HLDI defines claim severity as the size of the claim payments, which depends on the extent of the damage.
View the data
Key finding: HLDI data puts the average motorcycle collision claim at $10,044 for 2020-24 model years, up from $8,186 for 2016-20 model years. Claim frequency moved the other way across the same cohorts, so the rise in collision loss costs comes from bigger payments per claim rather than more claims per insured bike.
Recent Developments
- October 14, 2026: Progressive’s September 2026 results reported 7.390 million special lines policies in force at September 30, 2026, up from 6.980 million a year earlier.
- September 18, 2026: Progressive’s net premiums written rose 6% in August 2026, while its combined ratio rose to 89.3 from 83.1.
- August 19, 2026: Progressive counted 7.351 million special lines policies in force at July 31, 2026.
- August 3, 2026: NICB reported 58,957 recreational vehicle thefts in 2025, a 20% decrease from 2024, with approximately 63% of stolen recreational vehicles still unrecovered.
- July 2026: NHTSA’s 2024 motorcycle fact sheet showed motorcyclist fatalities decreased 2.2% from 2023, from 6,366 to 6,228.
- July 2026: NHTSA projected 7,770 traffic deaths in the first quarter of 2026, a decrease of about 4.3% from the first quarter of 2025.
Motorcycle Claim Frequency and Loss Cost per Insured Bike
- Overall collision losses averaged $271 per insured vehicle year for 2020-24 model year motorcycles.
- HLDI’s overall loss figure represents the average cost of insuring a vehicle for one year, excluding administrative costs.
- Collision claim frequency averaged 2.7 claims per 100 insured vehicle years for 2020-24 model years.
- The 2016-20 cohort averaged 2.8 claims per 100 insured vehicle years.
- For 2015-19 model years, HLDI recorded 2.9 claims per 100 insured vehicle years.
- The 2011-15 models averaged 3.1 claims per 100 insured vehicle years and $232 in overall losses per insured vehicle year.
View the data
How are statistics used in insurance?
HLDI explains that two factors determine collision losses: how often claims are filed (claim frequency) and the size of the claim payments (claim severity), which together make up overall insurance losses. Motorcycle coverage is priced from the same building blocks, so a class with frequent or costly claims carries a higher expected loss per policy year, as across property and casualty insurance.
Motorcycle Insurance Losses by Bike Class
- Dual-purpose motorcycles had the lowest relative claim frequency (41), and supersport motorcycles had the highest (281).
- The scooter class, which includes many small-engine-displacement and lower-cost vehicles, had the lowest overall losses (19).
- For 2020-24 model years, autocycles posted a relative claim severity of 195 and relative overall losses of 196.
- For 2020-24 model years, touring motorcycles recorded a relative claim severity of 143 and relative overall losses of 136.
- For 2016-20 model years, supersport motorcycles had a relative claim frequency of 271 and relative overall losses of 332.
| Motorcycle Class | Relative Claim Frequency | Relative Claim Severity | Relative Overall Losses |
|---|---|---|---|
| Scooter | 60 | 33 | 19 |
| Cruiser | 120 | 86 | 103 |
| Chopper | 109 | 73 | 80 |
| Touring | 95 | 143 | 136 |
| Dual-purpose | 41 | 78 | 32 |
| Standard | 51 | 58 | 30 |
| Autocycle | 101 | 195 | 196 |
| Sport-touring | 45 | 111 | 50 |
| Unclad sport | 126 | 77 | 97 |
| Sport | 164 | 64 | 104 |
| Supersport | 281 | 124 | 350 |
Source: Highway Loss Data Institute 2025 (100 = average for all motorcycles)
Why are sports bike insurance premiums higher?
No source cited here publishes supersport premium figures, so the answer rests on HLDI’s loss data for the class. Supersport motorcycles had the highest relative overall collision losses (350), and HLDI says those high losses were driven by their high claim frequency. According to the Insurance Institute for Highway Safety (IIHS), 59% of fatally injured supersport drivers in 2024 were younger than 30. Frequent claims and young riders are two risk signals that show up together in the loss and crash data for this class.
ABS and Motorcycle Insurance Claims
- HLDI’s May 2025 bulletin is its largest study to date on motorcycle antilock braking systems (ABS), covering 59 different motorcycle series.
- ABS was associated with claim frequency reductions of 25% under collision, 16% under bodily injury liability and 29% under medical payment coverage.
- ABS combined with combined control braking systems (CCBS) was associated with a 32% claim frequency reduction under medical payment coverage.
- For collision and medical payment coverage, motorcycles with ABS and with ABS plus CCBS reduced overall losses by 24% to 27%.
- Sport/unclad sport and sport touring motorcycles showed the largest collision claim frequency reductions with ABS (31%), while ABS on supersport motorcycles cut collision claim frequency by only 11%.
View the data
Why it matters: HLDI found ABS was associated with 25% fewer collision claims and 29% fewer medical payment claims. Medical payment claims follow rider injuries, so the braking data ties one piece of equipment to both the repair side and the injury side of a motorcycle policy.
Motorcycle Theft and Recovery Statistics
- NICB, a non-profit dedicated to identifying insurance fraud, counted 58,957 recreational vehicles reported stolen to law enforcement in 2025.
- Motorcycles represented more than three-quarters of all recreational vehicle thefts reported in 2025.
- A total of 44,564 motorcycles were reported stolen in 2025, with 41% eventually recovered.
- More than half of recreational vehicle recoveries occur within two weeks of being reported stolen.
- NICB President and CEO David J. Glawe said “Recreational vehicles are often valuable, easily portable, and stored in locations that make them attractive targets for thieves”.
| Measure | 2025 Figure |
|---|---|
| Recreational vehicles reported stolen | 58,957 |
| Decrease from 2024 | 20% |
| Motorcycles reported stolen | 44,564 |
| Motorcycles recovered | 41% |
| All-terrain vehicles (ATVs) reported stolen | 11,050 |
| ATVs recovered | 23% |
| Recreational vehicles still unrecovered | Approximately 63% |
Source: National Insurance Crime Bureau 2026
Recovery rates matter to comprehensive coverage because an unrecovered bike leaves the insurer with nothing to offset the claim.
Motorcyclist Deaths and Injuries by Year
- In 2024 there were 6,228 motorcyclists killed, 16% of all traffic fatalities.
- The number of motorcyclist fatalities decreased 2.2% from 2023, from 6,366 to 6,228.
- An estimated 86,887 motorcyclists were injured in 2024, an increase of 5.2% from 82,567 in 2023.
- IIHS notes the 2024 total was nearly the highest number ever recorded and a 23% increase since 2019.
- NHTSA notes that due to a vehicle classification change, 2020 and later-year data is not comparable to 2019 and earlier years.
View the data
Motorcycle Fatality Rates Compared With Cars
- Per 100,000 registered vehicles in 2024, the fatality rate for motorcyclists (67.25) was over 6 times the fatality rate for passenger car occupants and over 10 times the rate for light-truck occupants.
- Motorcycles made up 3% of all registered vehicles in the United States in 2024 and accounted for only 0.7% of all vehicle miles traveled (VMT).
- The motorcyclist injury rate per 100 million VMT (391) was nearly 5 times the injury rate of passenger car occupants (86).
- Registered motorcycles totaled 9,261,249 in 2024, against 9,516,910 in 2023, per Federal Highway Administration (FHWA) figures in NHTSA’s fact sheet.
- Motorcycles logged 22,241 million vehicle miles traveled in 2024.
View the data
Rider Risk Factors Behind Motorcycle Crash Losses
- In 2024, 37% of all motorcycle riders in fatal crashes were speeding, compared to 22% for passenger car drivers and 15% for light-truck drivers.
- Motorcycle riders 15 to 20 years old in fatal crashes had the highest speeding involvement at 56% in 2024.
- IIHS reports that 36% of fatally injured motorcycle drivers in 2024 were unlicensed, against 17% of fatally injured passenger vehicle drivers.
- Of the 5,950 motorcycle riders killed in 2024, 1,529 (26%) were alcohol-impaired.
- 40% of the motorcycle riders who died in single-vehicle crashes in 2024 were alcohol-impaired, compared with 18% in multivehicle crashes.
- Motorcyclist deaths at ages 15 to 20 rose to 609 in 2024 from 508 in 2023.
View the data
Motorcycle Helmet Use and Helmet Laws
- In 2024 only 17 States, the District of Columbia, and Puerto Rico required helmet use for all motorcyclists.
- Based on known helmet use, 48% of motorcyclists killed in 2024 were not wearing helmets in States without universal helmet laws, as compared to 11% in States with universal helmet laws.
- In 2023, DOT-compliant motorcycle helmet use was 82.7% in States requiring all motorcyclists to use helmets, compared to 65.9% in other States.
- Helmets are about 37% effective in preventing motorcycle deaths and about 67% effective in preventing brain injuries, according to NHTSA research cited by IIHS.
- According to the National Occupant Protection Use Survey, the overall rate of DOT-compliant motorcycle helmet use in the United States was 73.8% in 2023.
| Year | DOT-Compliant Helmet Use (%) |
|---|---|
| 2015 | 61 |
| 2016 | 65 |
| 2017 | 65 |
| 2018 | 71 |
| 2019 | 71 |
| 2020 | 69 |
| 2021 | 65 |
| 2022 | 67 |
| 2023 | 74 |
Source: Insurance Information Institute, National Highway Traffic Safety Administration 2023
Engine Size and Motorcycle Crash Deaths
- Of the motorcyclists killed in traffic crashes in 2024, 37% rode motorcycles with engine sizes of 501 to 1,000 cubic centimeters (cc), followed by 26% on motorcycles of 1,501 cc or higher.
- Motorcyclist fatalities on motorcycles up to 500 cc increased 5%, from 705 to 739, between 2023 and 2024.
- Fatalities on motorcycles from 1,001 to 1,500 cc decreased 11%, from 1,354 to 1,206.
- NHTSA has not determined if there is a causal relationship between displacement and fatality risk.
- Among motorcycle drivers killed in 2024, 32% drove motorcycles with engine sizes larger than 1,400 cc, compared with 9% in 2000.
View the data
When Motorcycle Crash Deaths Happen
- In III’s compilation of NHTSA’s 2023 data, the 6 p.m. to 9 p.m. window accounted for 1,444 motorcyclist deaths in 2023, or 22.8% of the total.
- NHTSA’s final 2023 count put weekday motorcyclist deaths at 3,391, against 2,969 on weekends, out of 6,366 in total.
- In the same III table, the midnight to 3 a.m. window accounted for 10.3% of weekend motorcyclist deaths, against 5.5% on weekdays.
- Motorcycle riders killed in traffic crashes at night were 2.6 times more frequently alcohol-impaired than those killed during the day (37% and 14%) in 2024.
| Time of Day | Weekday Deaths | Weekend Deaths | Total Deaths |
|---|---|---|---|
| Midnight to 3 a.m. | 184 | 305 | 489 |
| 3 a.m. to 6 a.m. | 124 | 132 | 256 |
| 6 a.m. to 9 a.m. | 267 | 80 | 347 |
| 9 a.m. to noon | 285 | 213 | 498 |
| Noon to 3 p.m. | 510 | 435 | 945 |
| 3 p.m. to 6 p.m. | 827 | 500 | 1,327 |
| 6 p.m. to 9 p.m. | 695 | 749 | 1,444 |
| 9 p.m. to midnight | 466 | 529 | 995 |
Source: Insurance Information Institute, National Highway Traffic Safety Administration 2023 (III compilation of preliminary 2023 data)
Economic Cost of Motorcycle Crashes
- In 2019, motorcycle rider crashes cost $16.9 billion in economic impacts and $107.1 billion in societal harm as measured by comprehensive costs.
- Fatal injuries accounted for $8,986 million ($9.0 billion) of those economic costs, across 5,044 fatalities.
- As of 2019, helmets were saving $3.2 billion in economic costs annually, but another $1.4 billion in potential savings was lost to helmet nonuse.
- Over the 45-year period through 2019, motorcycle helmets saved over $92 billion in economic costs, and another $65 billion in potential savings was lost.
Injury levels in the table follow the Maximum Abbreviated Injury Scale (MAIS).
View the data
By the numbers: NHTSA put the 2019 economic cost of motorcycle rider crashes at $16.9 billion, with $107.1 billion in societal harm. As of 2019, helmets were saving $3.2 billion in economic costs annually. These are 2019 figures, so they predate the rise in motorcyclist deaths shown above.
Why is motorcycle insurance so high?
No source cited here publishes an average motorcycle premium, so the answer rests on the crash and claim loss data that insurers price from. Per 100 million vehicle miles traveled in 2024, the motorcyclist fatality rate (28.00) was almost 27 times the passenger car occupant fatality rate (1.05). HLDI puts the average collision claim at $10,044 for 2020-24 model year motorcycles. High injury exposure and costly repairs both feed the loss costs behind motorcycle premiums, and theft adds a third layer for comprehensive coverage.
Conclusion
HLDI’s average motorcycle collision claim of $10,044 for 2020-24 model years sits against a claim frequency of 2.7 per 100 insured vehicle years. NHTSA counted 6,228 motorcyclist deaths in 2024. Severity, not frequency, drives the collision loss trend, while the rider data on speeding, licensing and alcohol shows where crash risk concentrates.
HLDI’s braking study links ABS to 25% fewer collision claims. The next HLDI cohort will show whether falling claim frequency holds, a trend that also shapes the wider US auto insurance market.