

• Skip to primary navigation
  • Skip to main content
  • Skip to primary sidebar
  • Skip to footer
CoinLaw LogoCoinLaw

Bringing Crypto and Finance Closer to You

  • Latest News
  • Statistics
  • About
  • Contact
Subscribe
CoinLaw Logo
  • Latest News
  • Statistics
  • About
  • Contact
Subscribe
Home » Payments

Helcim Statistics 2026: Facts Every SMB Should See

Published on: October 19, 2025
Barry Elad
Written By
Barry Elad
Barry Elad
Founder & Senior Journalist • 587 Articles
Barry Elad is a finance and tech journalist who loves breaking down complex ideas into simple, practical insights. Whether he's exploring fi... See full bio
LATEST POSTS:
How Many Cryptocurrencies Are There Statistics 2026: Crypto Boom
How Many Bitcoins Are There 2026: Growth and Circulating Supply
Largest Investment Banks Statistics 2026: Revenue, League Tables and Headcount
Kathleen Kinder
Reviewed By
Kathleen Kinder
Kathleen Kinder
Senior Editor • 1,838 Articles
Kathleen Kinder brings over 11 years of experience in the research industry, with deep expertise in finance, cryptocurrency, and insurance. ... See full bio
LATEST POSTS:
Wanchain’s Cardano Bridge Hack Drains 515 Million NIGHT
Bank of Korea Ran CBDC Pilot With No Outside Audit
Grayscale Files First US Worldcoin ETF With SEC
Helcim Statistics
As Featured In
Bloomberg LogoForbes LogoFortune LogoCoinDesk LogoCoinMarketCap Logo
Share on LinkedIn ChatGPT Perplexity Share on X Share on Facebook

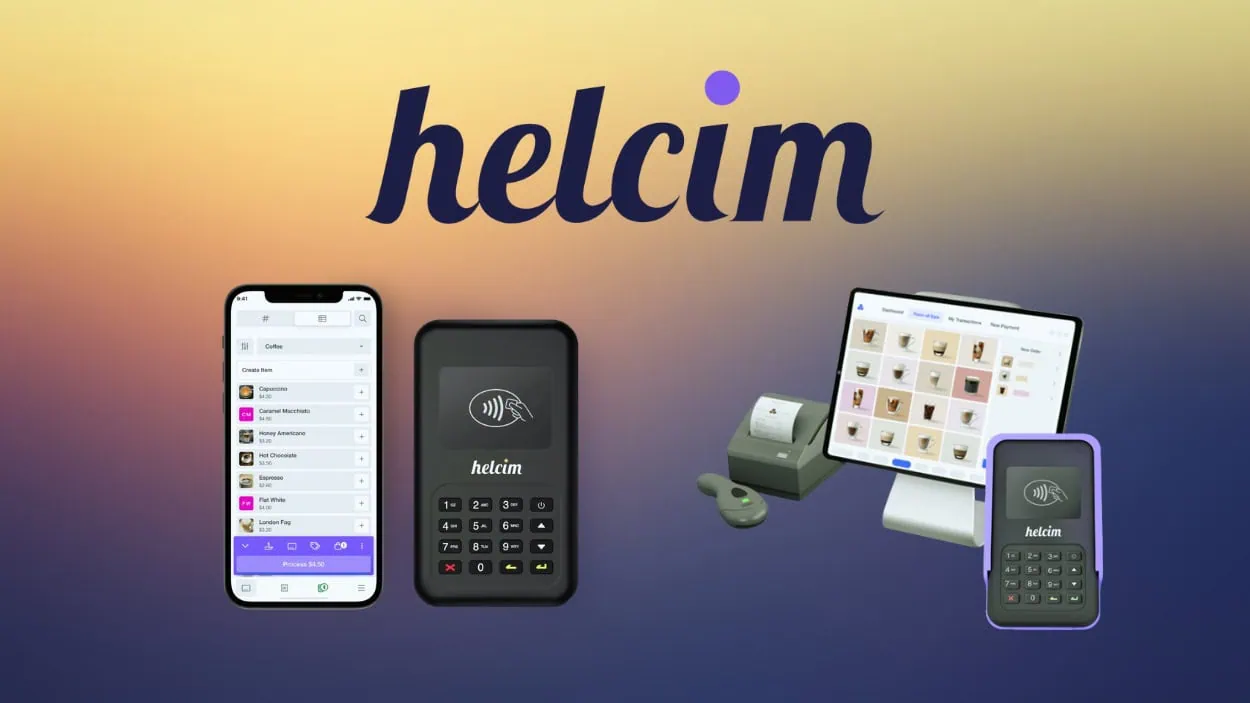
Helcim is quickly emerging as one of the most trusted names in the payment processing space for small and medium-sized businesses. Its transparency in pricing, flexible features, and strong developer tools have made it a popular choice across North America. From retail stores using smart terminals to SaaS companies integrating online payments via APIs, Helcim is impacting industries in both traditional and digital spaces. This article explores key statistics and trends surrounding Helcim to help merchants, analysts, and investors better understand its performance and role in the evolving payments ecosystem.

Editor’s Choice

  • 15% annual growth in electronic payment transaction volumes processed through Helcim’s platform.
  • 68.10% of transactions across Helcim are in-person, while 31.90% are online in 2025.
  • 83.12% of payments processed via Helcim are credit card transactions.
  • 62.70% of in-person payments are processed through smart terminals in Helcim’s network.
  • Tap to Pay on iPhone launched in October 2024, enabling contactless payments without external hardware.
  • Fraud losses globally dropped from 3.6% in 2022 to 2.9% in 2023, used as a benchmark for Helcim merchants.
  • Helcim’s volume-based discount model allows margins as low as Interchange + 0.15% + 6¢ for large-volume merchants.

Recent Developments

  • Tap to Pay on iPhone processed over 4,000 transactions within the first week of launch in October 2024.
  • Fraud Defender detected and flagged 2.3% of transactions as elevated risk in Q4 2024.
  • The merchant statement tool cut reconciliation time by 27% for Helcim customers as of late 2024.
  • Helcim’s developer revenue-share program attracted over 150 platforms in the first half of 2025.
  • U.S. and Canadian dual-currency support increased cross-border merchant transactions by 19% in 2025.
  • The Merchant Comparison Tool saved businesses an average of 15% on payment processing fees after adoption.
  • Adoption of smart terminals rose by 33% year-over-year through Q3 2025 among Helcim merchants.
  • Automated volume discounting led to an average rate reduction of 0.07% for high-volume merchants each month.
  • New onboarding reduced setup time to under 24 hours for 73% of merchants by mid-2025.
  • Mobile-optimized invoicing increased paid invoice rates by 12% compared to the pre-update baseline in 2025.

Most Popular Payment Processing Services

  • Square leads the market with 48% popularity, making it the dominant choice for merchants seeking user-friendly payment tools and broad hardware compatibility.
  • Payment Depot holds 19%, favored by businesses for its membership-style pricing and transparent fee structure.
  • Clover accounts for 17%, driven by its integrated POS systems and flexible hardware solutions for retail and restaurants.
  • Stripe captures 15%, remaining a top pick among online and SaaS businesses for its robust developer APIs.
  • National Processing also stands at 15%, known for low-cost interchange-plus pricing and strong small business support.
  • Merchant One secures 13%, appealing to merchants seeking personalized account setup and quick approvals.
  • Helcim represents 11%, recognized for its no-hidden-fee model and transparent interchange-plus pricing.
  • Staxx by Fattmerchant holds 9%, offering subscription-based pricing and flat-rate processing for consistent cost control.
Most Popular Payment Processing Services
(Reference: Forbes)

Overview of Helcim

  • Helcim’s merchant base expanded to over 22,000 businesses across the U.S. and Canada in 2025.​
  • More than 800 industries rely on Helcim’s payment platform for daily transactions.​
  • Smart and virtual terminal usage climbed 29% among new merchants in 2025.​
  • 100% of Helcim merchants benefit from transparent interchange-plus pricing with no monthly fees.​
  • Real-time dashboard adoption reached 89% user satisfaction in recent POS reviews.​
  • Over 40% of Helcim merchants process both in-person and online payments each month.​
  • Helcim processed more than $2.1 billion in multi-currency and cross-border transactions in 2024.​
  • Integration with QuickBooks, Xero, WooCommerce, and other platforms is available for 98% of merchant accounts.​
  • Over 90% of merchants indicated that no long-term contract or cancellation fee made Helcim their preferred choice in 2025.​
  • Helcim reported 87% of users consider them a more ethical, small-business-friendly processor over the top competitors.​
Newsletter Img
Don't chase the news. Let us curate it.

You get one weekly briefing with only the stories that matter. If the market is quiet, we skip it.

✅ Join readers from Visa, Mastercard, Vanguard, and the FDIC.

Helcim Revenue Statistics

  • Helcim’s pricing model is based on Interchange + margin, which varies with merchant volume.
  • For merchants processing over $1 million/month, Helcim charges Interchange + 0.15% + 6¢ (in-person) and +15¢ (online).
  • Lower-volume merchants (under $50,000/month) pay Interchange + 0.30% + 8¢ for in-person and +25¢ for online.
  • Volume discounting occurs automatically each month based on a 3-month average.
  • In 2024, Helcim introduced tiered processing fees tied directly to volume to better support scaling businesses.
  • Revenue generated by Helcim includes processing margin, hardware sales, and premium support plans.
  • Increased adoption of smart terminals and APIs has contributed to revenue diversification.
  • Recurring payments and invoicing solutions contribute to predictable revenue streams.

Latest U.S. Consumer Payment Preferences

  • Credit cards are the most popular payment method in the U.S. for 2025, used for 36% of all consumer transactions.
  • Debit cards closely follow, representing 34% of total payment volume among U.S. consumers.
  • Cash usage has declined to just 14%, reflecting ongoing digital payment adoption.
  • Other payment methods, including mobile wallets, ACH transfers, and Buy-Now-Pay-Later (BNPL) platforms, make up the remaining 16% of payments.
  • The trend indicates a steady shift toward digital payments, with mobile and account-based options gradually rising in preference.
U.S. Consumer Payment Preferences
(Reference: Federal Reserve System, Velera)

Helcim Employee Statistics

  • Helcim employs 188 people as of May 2025, exceeding previous estimates.​
  • Employee count increased by 4% over the previous year.​
  • The company’s HQ in Calgary supports a hybrid work model for most roles in 2025.​
  • Over 40% growth in workforce from 2022-2025, mostly in product and engineering.​
  • Nearly 39% of roles focus on engineering and customer support functions.​
  • Employee satisfaction scores regularly exceed 4.5 / 5, highlighting a positive culture.​
  • At least 12 active job postings in 2025 for development, product, and customer success positions.​
  • Internal training modules in payment compliance are completed by 100% of sales and support staff each year.​
  • More than 30% of new hires in 2025 come from multicultural and bilingual backgrounds.​
  • Helcim’s employee-driven brand identity is cited in 81% of recent public company statements.

Year-on-Year Growth Rates

  • Electronic payment transaction volumes processed through Helcim’s platform grow by around 15% p.a..
  • From May 2021 to February 2025, the share of consumer (low-fee) credit-card usage dropped by 18%, indicating changing card-mix dynamics.
  • Between 2022 and 2025, the online transaction proportion rose from ~30% to ~31.9%, showing modest online growth.
  • Helcim’s automatic volume-discount tiers adjust monthly based on a three-month rolling average of sales.
  • In 2024 vs. 2023, Helcim merchants’ adoption of smart terminals increased to 62.7% of in-person transactions.
  • Helcim claims merchants save on average 25% on processing fees when switching from traditional models.
  • For merchants processing over $1M monthly, Helcim’s rate drops to Interchange + 0.15% + 6¢ (in-person).
  • Keyed & online transactions at the highest volume are priced at Interchange + 0.15% + 15¢.

Transaction Volume Statistics

  • Electronic payment volume is growing at approximately 15% annually.
  • In 2025, 68.10% of transactions are in-person and 31.90% online across Helcim.
  • Restaurants process ~96.95% in-store and ~3.05% online.
  • Wholesale merchants handle ~50.74% in-person and ~49.26% online.
  • Platforms, Apps & SaaS process ~11.33% in-person and ~88.67% online.
  • Virtual terminals are used in ~62.55% of all online transactions.
  • Smart terminals are used in ~62.70% of all in-person transactions.
  • Sales & revenue reports allow merchants to segment volume by transaction type, tender type, and date.
Helcim's Transaction Volume Statistics

Helcim Funding and Valuation Stats

  • Helcim raised CA$27 million in Series B funding in February 2024.​
  • Total funding to date is $32.7 million across multiple rounds as of 2025.​
  • Estimated annual revenue reached $34.5 million in 2025.​
  • Revenue per employee is around $183,000 for Helcim, above fintech sector averages.​
  • The latest funding round was $19.98 million in February 2024.​
  • Helcim’s transaction volumes grow by approximately 15% year-over-year in 2024 and 2025.​
  • Merchant churn is very low, with retention rates exceeding 90%, attributed to the no-monthly-fee model.​
  • High-volume pricing discounts have helped push net margin improvements by 6% for the past year.​
  • Expansion to all 50 U.S. states and 12 provinces in Canada increased Helcim’s addressable market sharply in 2024.​
  • Platform valuation is speculated to approach $50 million following recent funding milestones, though not publicly confirmed.​

Adoption of Payment Integrations

  • Over 2,000 partners joined Helcim’s integration developer program by mid-2025.​
  • API calls grew by 37% year-over-year, driven by custom checkout, fraud logic, and tap-to-pay use cases.​
  • More than 19,000 merchants now use Helcim’s embedded payment features like HelcimPay.js and QR codes.​
  • Automatic volume discounts were applied to 88% of merchants in 2025, reflecting strong integration adoption.​
  • The statement comparison tool contributed to a 15% average fee savings for adopted merchants.​
  • Integration with QuickBooks, Xero, WooCommerce, and related apps reached 98% of Helcim customers.​
  • Monthly statements now detail over 12 payment tender types for full transaction transparency.​
  • Real-time webhook event syncing rose to 28,000+ triggers per month in 2025.​
  • API-driven integrations processed over $1.7 billion in payment volume during Q2 2025.​
  • The developer program enabled platforms to earn an average of $720 in shared integration revenue per partner in 2025.​

In‑Person vs Online Transaction Statistics

  • Gas Stations: ~96.62% in-person, ~3.38% online.
  • Automotive: ~58.81% in-person, ~41.19% online.
  • Hotels & Lodging: ~56.32% in-person, ~43.68% online.
  • Wholesale: ~50.74% in-person, ~49.26% online.
  • Education: ~29.68% in-person, ~70.32% online.
  • Platforms/Apps/SaaS: ~11.33% in-person, ~88.67% online.
  • Merchants are maintaining strong in-store capabilities while adapting to online trends.
Helcim's In‑Person vs Online Transaction by Industry

Chargeback and Fraud Statistics

  • Global payment fraud losses dropped from 3.6% in 2022 to 2.9% in 2023, offering Helcim merchants a benchmark.
  • Fraud Defender analyzes seven transaction factors to calculate a fraud risk score.
  • Helcim charges a $15 chargeback fee, refundable if the dispute is won.
  • Friendly fraud has increased, especially from repeat offenders filing multiple chargebacks.
  • Auto-voiding suspicious transactions improves chargeback management for online payments.
  • Card-not-present transactions are at higher risk, prompting merchants to use Helcim’s scoring system.
  • AVS, CVV, and address match are included in Helcim’s default fraud settings.
  • Merchants using built-in fraud tools experience fewer manual reviews and better loss control.

Customer Demographics & Preferences

  • 62.55% of all online payments go through the virtual terminal.
  • 14.83% of online payments are recurring transactions.
  • In Platforms/Apps/SaaS, ACH/EFT usage is around 2.72%.
  • In the U.S., 32.6% of all monthly consumer payments are made via credit card.
  • The Education sector sees ~70.32% of transactions online, reflecting digital-native customer behavior.
  • Merchants adopting tap-to-pay and mobile wallets attract younger consumers.
  • ACH is popular in Associations (7.18%), Home Services (5.66%), and Professional Services (4.35%).
  • API and payment link adopters serve digitally fluent users who prefer frictionless checkout.

Geographic Distribution of Transactions

  • 68.1% of Helcim transactions in 2025 are card-present, with suburban and urban regions leading volume.​
  • Dual-currency support facilitated over $2.1 billion in cross-border payment volume in 2024.​
  • Helcim merchants operate in more than 50 U.S. states and all 10 Canadian provinces.​
  • ACH usage is highest among contractors and service businesses in rural markets, up 21% since last year.​
  • Tap-to-Pay on iPhone expanded event-based payment coverage across 43 states in seasonal industries.​
  • Online interchange fees are 45% higher than in-person ones for cross-border transactions.​
  • Helcim serves businesses spanning 800 industries throughout North America.​
  • In-person transaction rates exceed 72% in urban zones versus 54% in rural zones.​
  • Transaction processing time is typically 2 business days for the U.S. and up to 7 in Canada, depending on the region.​
  • Cross-border transaction growth increased by 25% year-over-year as of Q2 2025.​

Seasonal and Monthly Trends

  • Virtual terminal use in Retail Goods reaches 71.44%, spiking by 19% over baseline during holidays.​
  • The transportation sector sees 85.53% of transactions online, with monthly peaks aligning with travel surges.​
  • Platforms, apps, and SaaS maintain steady monthly volumes, with less than 8% variance across the year.​
  • Helcim dashboards are used by 94% of merchants for weekly and monthly inventory planning.​
  • Tap to Pay on iPhone use rises 34% in December for pop-up stores and event merchants.​
  • ACH payment sectors show flat monthly activity, with under 6% seasonal deviation in 2025.​
  • Mobile and contactless payment volume jumps by 46% in the year-end and holiday months.​
  • Card-present transaction rates can drop 22% during the summer months in some retail verticals.​
  • Subscriptions in SaaS hold 97% monthly retention even in off-peak periods.​
  • Revenue dashboard usage jumped 26% after Helcim’s 2025 update for seasonal sales analysis.​

Mobile & Contactless Payment Stats

  • Helcim launched Tap to Pay on iPhone in October 2024, enabling payments without external hardware.
  • Contactless payments use NFC and are faster and more secure than traditional methods.
  • A 2020 consumer study shows 48% of consumers use contactless, and 63% would switch if unavailable.
  • Smart terminals now handle ~62.70% of in-person payments, most of which support contactless.
  • Helcim’s all-in-one model includes mobile POS and QR-code payment support.
  • Tokenization and encryption secure every mobile or contactless transaction.
  • Mobile payment options appeal strongly to Gen Z and millennial consumers.

Security & Compliance Metrics

  • Helcim maintains Level 1 PCI-DSS compliance, with annual audits, vulnerability scans, and penetration testing.​
  • Fraud Defender system uses 7 variables to determine transaction risk and flag potentially fraudulent activity.​
  • The platform achieves a card-present fraud loss rate under 0.13%, well below the 2.9% global average in 2023.​
  • 100% of card-present and contactless payments benefit from AES-256 encryption and TLS 1.2+ communication security.​
  • Over 94% of Helcim merchants complete PCI self-assessments using Helcim’s integrated compliance toolkit each year.​
  • Auto-Void transaction tools are configured by more than 77% of merchants processing over $20,000/month.​
  • Chargeback rates remain below 0.25% across the platform, coupled with transparent dispute procedures.​
  • PCI toolkit and merchant support yield a 98% year-end merchant compliance rate without extra PCI fees.​
  • Daily anomaly reports enable 92% of high-volume merchants to resolve transaction risks within a single business day.​

Frequently Asked Questions (FAQs)

What percentage of transactions processed through Helcim in 2025 are in‑person versus online?

About 68.10% of Helcim transactions are in‑person, and 31.90% are online.

What share of total payment methods processed by Helcim are credit cards in the U.S. and Canada?

Approximately 83.12% of transactions are credit cards.

What is Helcim’s estimated annual revenue and funding as of the latest data?

Helcim’s estimated annual revenue is $34.5 million, and total funding is around $33 million.

By what approximate annual rate are electronic payment transaction volumes growing on Helcim’s platform?

Transaction volumes grow by around 15% per year.

Conclusion

In summary, Helcim demonstrates consistent growth, diversified payment-method adoption, robust fraud-prevention tools, and strong mobile/contactless payment support. The statistics reviewed here paint a detailed picture of its position in the payments-processing landscape, primarily for U.S. and Canadian merchants. Companies exploring a modern, transparent processor will find in Helcim a provider with credible analytics and evolving feature sets. I invite you to review the full article and consider how these metrics align with your business needs or strategic plans.


Definition of Gas Fee. Link to full glossary entry follows the description.Gas Fee

A gas fee is the transaction cost paid to Ethereum validators for the computational effort needed to process and confirm blockchain operations.

Read more

This article has been reviewed and fact-checked by Kathleen Kinder. CoinLaw follows strict Publishing Principles and a documented Fact-Check Policy to ensure accuracy, transparency, and editorial independence across all content. Our statistics are verified using a documented Research Process.

Add CoinLaw as a Preferred Source on Google for instant updates! Follow on Google News
Share ChatGPT Perplexity

References

  • Fintech.ca
  • PR Newswire
  • McKinsey
  • Forbes
  • Statista
  • Business News Daily
  • Helcim
Barry Elad

Barry Elad

Founder & Senior Journalist


Barry Elad is a finance and tech journalist who loves breaking down complex ideas into simple, practical insights. Whether he's exploring fintech trends or reviewing the latest apps, his goal is to make innovation easy to understand. Outside the digital world, you'll find Barry cooking up healthy recipes, practicing yoga, meditating, or enjoying the outdoors with his child.

Related Posts

Payment Gateway Statistics
Payments

Payment Gateway Statistics 2026: Growth Secrets

Checkout.com Statistics
Payments

Checkout.com Statistics 2026: Big Revenue Insights

Shopify Payments Statistics
Payments

Shopify Payments Statistics 2026: Inside Growth Secrets

Disclaimer: The content published on CoinLaw is intended solely for informational and educational purposes. It does not constitute financial, legal, or investment advice, nor does it reflect the views or recommendations of CoinLaw regarding the buying, selling, or holding of any assets. All investments carry risk, and you should conduct your own research or consult with a qualified advisor before making any financial decisions. You use the information on this website entirely at your own risk.

Reader Interactions

Leave a Comment Cancel reply

Primary Sidebar

Connect With Us

facebook x linkedin google-news telegram pinterest whatsapp email
google-preferred-source-badge Add as a preferred source on Google

You Should Also Read

How Many People Work At Helcim 2026: Facts Behind Its Growth Story
Credit Card Processing Industry Statistics 2026: Powerful Market Trends
Merchant Services Industry Statistics 2026: Innovations, Payments, and Security

Table of Contents

  • Editor’s Choice
  • Recent Developments
  • Most Popular Payment Processing Services
  • Overview of Helcim
  • Helcim Revenue Statistics
  • Latest U.S. Consumer Payment Preferences
  • Helcim Employee Statistics
  • Year-on-Year Growth Rates
  • Transaction Volume Statistics
  • Helcim Funding and Valuation Stats
  • Adoption of Payment Integrations
  • In‑Person vs Online Transaction Statistics
  • Chargeback and Fraud Statistics
  • Customer Demographics & Preferences
  • Geographic Distribution of Transactions
  • Seasonal and Monthly Trends
  • Mobile & Contactless Payment Stats
  • Security & Compliance Metrics
  • Frequently Asked Questions (FAQs)
  • Conclusion
Connect on Telegram

Footer

CoinLaw Logo

Bringing Finance Closer to You.

Connect With Us

Follow Us on Google News

Editorial & Trust

  • About
  • Publishing Principles
  • Fact-Check Policy
  • Corrections Policy
  • Ethics Policy
  • Disclaimer
  • Cookie Policy

Worth Checking

  • Best Cloud Mining Platforms
  • Millennial vs. Gen Z Banking
  • Ethereum Gas Fees Statistics
  • Binance vs. Coinbase Statistics
  • Zelle vs. Venmo Statistics
  • Traditional Banks vs. Neobanks
  • Crypto Exchange Hack Statistics
Contact Us
13570 Grove Dr #189,
Maple Grove, MN 55311,
United States
10 a.m. – 6 p.m. | Every day

Copyright © 2024–2026 CoinLaw. All Rights Reserved. Powered by the HODL Force ❤️

  • Privacy Policy
  • Terms
  • Accessibility Statement
Manage your privacy

To provide the best experiences, we and our partners use technologies like cookies to store and/or access device information. Consenting to these technologies will allow us and our partners to process personal data such as browsing behavior or unique IDs on this site and show (non-) personalized ads. Not consenting or withdrawing consent, may adversely affect certain features and functions.

Click below to consent to the above or make granular choices. Your choices will be applied to this site only. You can change your settings at any time, including withdrawing your consent, by using the toggles on the Cookie Policy, or by clicking on the manage consent button at the bottom of the screen.

Functional Always active
The technical storage or access is strictly necessary for the legitimate purpose of enabling the use of a specific service explicitly requested by the subscriber or user, or for the sole purpose of carrying out the transmission of a communication over an electronic communications network.
Preferences
The technical storage or access is necessary for the legitimate purpose of storing preferences that are not requested by the subscriber or user.
Statistics
The technical storage or access that is used exclusively for statistical purposes. The technical storage or access that is used exclusively for anonymous statistical purposes. Without a subpoena, voluntary compliance on the part of your Internet Service Provider, or additional records from a third party, information stored or retrieved for this purpose alone cannot usually be used to identify you.
Marketing
The technical storage or access is required to create user profiles to send advertising, or to track the user on a website or across several websites for similar marketing purposes.
Statistics

Marketing

Features
Always active

Always active
  • Manage options
  • Manage services
  • Manage {vendor_count} vendors
  • Read more about these purposes
Manage options
  • {title}
  • {title}
  • {title}
Manage your privacy
To provide the best experiences, we use technologies like cookies to store and/or access device information. Consenting to these technologies will allow us to process data such as browsing behavior or unique IDs on this site. Not consenting or withdrawing consent, may adversely affect certain features and functions.
Functional Always active
The technical storage or access is strictly necessary for the legitimate purpose of enabling the use of a specific service explicitly requested by the subscriber or user, or for the sole purpose of carrying out the transmission of a communication over an electronic communications network.
Preferences
The technical storage or access is necessary for the legitimate purpose of storing preferences that are not requested by the subscriber or user.
Statistics
The technical storage or access that is used exclusively for statistical purposes. The technical storage or access that is used exclusively for anonymous statistical purposes. Without a subpoena, voluntary compliance on the part of your Internet Service Provider, or additional records from a third party, information stored or retrieved for this purpose alone cannot usually be used to identify you.
Marketing
The technical storage or access is required to create user profiles to send advertising, or to track the user on a website or across several websites for similar marketing purposes.
Statistics

Marketing

Features
Always active

Always active
  • Manage options
  • Manage services
  • Manage {vendor_count} vendors
  • Read more about these purposes
Manage options
  • {title}
  • {title}
  • {title}
Company
  • About Us
  • Our Team
  • Our Mission
  • Core Values
Discover
  • glossary icon
    Glossary
  • Stats
    Stats Research Process
  • Brand Guide Icon
    Brand Assets
Categories
  • Cryptocurrency
  • Payments
  • Banking
  • Finance
  • Insurance
Cryptocurrency
How Many Cryptocurrencies Are There Statistics
How Many Cryptocurrencies Are There Statistics 2026: Crypto Boom
How Many Bitcoins Are There
How Many Bitcoins Are There 2026: Growth and Circulating Supply
Bitcoin All-Time High Statistics
Bitcoin All-Time High Statistics 2026: Every Cycle Peak Across Four Halvings
Crypto Market Capitalization Statistics
Crypto Market Capitalization Statistics 2026: Totals, Dominance, and Trends
How Many People Use Cryptocurrency Worldwide
How Many People Use Cryptocurrency Worldwide 2026: Global User Count by Year and Region
Stablecoin Market Cap Statistics
Stablecoin Market Cap Statistics 2026: Issuer Share and Growth
Payments
Remittances By Country Statistics
Remittances by Country Statistics 2026: Inflows and Cost
Cash App vs Zelle Statistics
Cash App vs Zelle Statistics 2026: Speed, Limits and User Data
Venmo vs. PayPal Statistics
Venmo vs PayPal Statistics 2026: Users, Fees and Volume
Toast Statistics
Toast Statistics 2026: ARR, GPV & Revenue Data
Rapyd Statistics
Rapyd Statistics 2026: TPV, Valuation & Licences
Marqeta Statistics
Marqeta Statistics 2026: TPV, Revenue and Customer Mix
Banking
Global Systemically Important Banks Statistics
Global Systemically Important Banks Statistics 2026: Bucket Allocation and Capital Surcharges
Bank Failures Statistics
Bank Failures Statistics 2026: FDIC Data, DIF Costs, and Recent Trends
The 15 Largest Banks in the US
The 15 Largest Banks in the US in 2026: By Assets, Deposits, and Branches
N26 Statistics
N26 Statistics 2026: Customers, Deposits, Revenue and the BaFin Growth Cap
Revolut vs Monzo Statistics
Revolut vs Monzo Statistics 2026: Customers & Profit
Islamic Banking Statistics
Islamic Banking Statistics 2026: Assets, Growth, and Top Markets
Finance
Federal Tax Revenue By State Statistics
Federal Tax Revenue by State Statistics 2026: IRS Gross Collections, Top 10 States, Donor vs Recipient
Tariff Revenue Statistics
Tariff Revenue Statistics 2026: Customs Duties and IEEPA Refunds
Emergency Fund Statistics
Emergency Fund Statistics 2026: How Much Americans Have Saved (and How Much They Should)
Financial Advisor Statistics
Financial Advisor Statistics 2026: Headcount, AUM, and Demographics
Wealth Inequality Statistics
Wealth Inequality Statistics 2026: Hidden Wealth Divide
Blockchain In Supply Chain Finance Statistics
Blockchain in Supply Chain Finance Statistics 2026: Trade Breakthrough
Insurance
Lemonade Insurance Statistics
Lemonade Insurance Statistics 2026: Customers, In-Force Premium, Loss Ratio, Pet & Auto Segments
Chubb Statistics
Chubb Statistics 2026: Powerful Data Insights
Virtual Reality In Insurance Statistics
Virtual Reality In Insurance Statistics 2026: Innovations, Risks, and Opportunities
US Life Insurance Industry Statistics
US Life Insurance Industry Statistics 2026: Growth Facts
US Auto Insurance Industry Statistics
US Auto Insurance Industry Statistics 2026: What You Must Know Now
UK Insurance Industry Statistics
UK Insurance Industry Statistics 2026: Growth Data
Categories
  • Cryptocurrency
  • Investments
  • Fintech
  • Compliance
  • Finance
Cryptocurrency
Jack Mallers Steps Down As Twenty One Capital Ceo
Jack Mallers Steps Down as Twenty One Capital CEO
Wanchain S Cardano Bridge Hack Drains 515 Million Night
Wanchain’s Cardano Bridge Hack Drains 515 Million NIGHT
Bank Of Korea Ran Cbdc Pilot With No Outside Audit
Bank of Korea Ran CBDC Pilot With No Outside Audit
Grayscale Files First Us Worldcoin Etf
Grayscale Files First US Worldcoin ETF With SEC
Human Tech Launches Clean Sdk For Private Compliant Web3 Apps
human.tech Launches Clean SDK for Private, Compliant Web3 Apps
Coinbase And Base Plan 1 1 Stock Backed Tokens
Coinbase and Base Plan 1:1 Stock-Backed Tokens
Investments
Coinhako Sbi Holdings Acquisition
SBI Holdings Acquires Coinhako Crypto Exchange
Keyrock Acquires Blockfills Trading And Brokerage Assets
Keyrock Completes the Acquisition of BlockFills’ Trading Assets
Crypto Com Raises 400 Million From Citadel Securities
Crypto.com Raises $400 Million From Citadel Securities
Moonpay Acquires Glide Crypto Deposit Startup
MoonPay Acquires Glide in All-Equity Crypto Deposits Deal
Hyperliquid Perpetual Prices Cxmt Above Its Shanghai Ipo
Hyperliquid Perpetual Prices CXMT Above Its Shanghai IPO
Former Tether Cio Seeks To Sell 1 26 Stake
Former Tether CIO Seeks to Sell 1.26% Stake via PJT Partners
Fintech
Visa Launches Stablecoin Platform
Visa Launches Stablecoin Platform, Starting With Open USD
Tether Invests 20 Million In Argentina S Uala
Tether Invests $20 Million in Argentina’s Ualá
Linux Foundation Launches X402 Foundation For Ai Payments
Linux Foundation Launches x402 Foundation for AI Payments
Cleanspark Signs 20 Year 6 6 Billion Data Center Lease
CleanSpark Signs 20-Year, $6.6 Billion Data Center Lease
Bybit Skills Marketplace Launch
Bybit Launches AI Marketplace for Yield Strategies
Evernorth Launches Japanese X Account Before Nasdaq Debut
Compliance
Russia S State Duma Passes Crypto Law
Russia’s State Duma Passes First Comprehensive Crypto Law
Maharashtra Directs Draft Of India S First Land Tokenization Law
Maharashtra Directs Draft of India’s First Land Tokenization Law
Fss Opens Sanctions Process Against Dunamu Over Upbit Hack
FSS Opens Sanctions Process Against Dunamu Over Upbit Hack
Bitpay Secures Dutch Mica License
BitPay Secures Dutch MiCA License for EU Crypto Payments
Revolut Secures Vara Approval In Dubai
Revolut Secures VARA Approval to Launch Crypto in UAE
Aba Icba Urge Senate To Close Stablecoin Yield Loophole
ABA, ICBA Urge Senate to Close Stablecoin Yield Loophole
Finance
Lsg To Operate 24 7 For Etps
London Stock Exchange Plans Overnight Trading by 2027
Avax One Regains Nasdaq Listing Compliance
AVAX One Regains Nasdaq Listing Compliance
Kraken Lets Traders Post Tokenized Stocks As Collateral
Kraken Lets Traders Post Tokenized Stocks as Collateral
Kalshi Targets Ipo After Massive Valuation
Kalshi Targets IPO After Massive Growth and $22B Valuation
Coinbase To Launch Tokenized Us Stocks
Coinbase Sparks New Race With 1:1 Backed Tokenized Stocks
Bitmine Launches 300m Preferred Stock Offering
Bitmine Launches $300M Preferred Stock to Buy More ETH
Newsletter Img

Too much noise in crypto?

We respect your time. You get one high-impact briefing a week. If the market is quiet, so are we.

✅ Join readers from Visa, Mastercard, Vanguard, and the FDIC.
Newsletter Img

The Weekly Briefing

We track the market 24/7. You get a 5-minute summary. If it’s quiet, we skip it.

✅ Read by pros at Visa, Mastercard, Vanguard, and the FDIC.