





FTMO reports paying more than $650 million in rewards to traders since 2015, drawn from a base the firm puts at more than 4.5 million customers across more than 140 countries. Both figures sit on FTMO’s own pages, both are published as floors rather than exact counts, and neither carries an independent audit statement.
The gap between them is the part most coverage skips: FTMO says how much it has paid, never how many customers were paid anything at all. The figures below cover payout volume, regional records, challenge pricing, rule thresholds, group structure after the OANDA acquisition, and what FTMO withholds.
Key Takeaways
- FTMO’s reported reward total of more than $650 million has no published denominator, because the firm does not disclose how many of its 4.5 million customers ever received a payout.
- FTMO reports monthly payout volume moving from an average of 305 payouts in 2020 to 1,713 in 2023, a scale shift of roughly five-fold in three years.
- The average 1-Step reward FTMO publishes is $3,336.61, set against a non-refundable evaluation fee that runs from €79 to €999.
- FTMO’s 1-Step evaluation is the tighter product on daily risk, capping daily loss at 3% against 5% on the 2-Step, while both cap total loss at 10%.
- The OANDA acquisition from CVC Asia Fund IV closed on December 1, 2025, after approvals from five regulators, placing a licensed brokerage alongside FTMO’s simulated-trading business.
- Across EU jurisdictions, ESMA and national competent authorities found that 74-89% of retail contract-for-difference accounts typically lose money, the underlying activity FTMO’s evaluations simulate.
Editor’s Choice
- FTMO reports more than $650 million paid in rewards worldwide since its founding in 2015.
- FTMO reports more than 4.5 million customers and service in more than 140 countries.
- FTMO reports creating more than 138,000 FTMO Accounts for its traders by early 2024.
- The largest single payout FTMO has published is $964,980.55.
- FTMO reports paying an average of $5,782,324 per month in 2023, up from $851,044 per month in 2020.
- FTMO’s best single month on the published series was January 2024, at $9,643,269.
- The FTMO Scaling Plan raises an account by 25% every 4 months, up to a ceiling of $2,000,000.
- Deloitte ranked FTMO as Central Europe’s fastest-growing tech company at a record 39,432% growth.
FTMO Payout and Trader Figures at a Glance
- FTMO reports more than $650 million paid in rewards worldwide, a figure displayed as a floor rather than a precise total.
- The firm reports more than 4.5 million customers worldwide and services in more than 140 countries.
- FTMO says it had created more than 138,000 FTMO Accounts for its FTMO Traders as of the firm’s February 2024 payout review.
- FTMO operates from headquarters in Prague with a team of over 250 people.
- The company reports $3,336.61 as the average 1-Step reward and $20,765 as the biggest 1-Step reward.
- FTMO lists 2 days as the shortest time to pass and Great Britain as the country with the most traders.
- FTMO describes itself as a modern prop trading firm where clients trade on a simulated account that mirrors real market conditions.
| Figure | Reported value | Basis |
|---|---|---|
| Rewards paid worldwide | More than $650 million | Company page, August 2026 |
| Customers worldwide | More than 4.5 million | Company page, August 2026 |
| Countries served | More than 140 | Company page, August 2026 |
| FTMO Accounts created | More than 138,000 | Company blog, February 2024 |
| Average 1-Step reward | $3,336.61 | Company product page, August 2026 |
| Largest 1-Step reward | $20,765 | Company product page, August 2026 |
| Staff | More than 250 | Company page, August 2026 |
Source: FTMO 2026, FTMO 2024
About This Data
Every figure comes from a primary capture of an FTMO, OANDA, CFTC, or ESMA page taken on August 26, 2026, and carries the period it describes. Selection rule: first-party or regulator disclosures only. FTMO’s own figures are self-reported and unaudited, so they are attributed to the firm in every sentence.

FTMO Monthly Payout Amounts by Period
- FTMO reports paying an average of $851,044 per month to trader accounts in 2020.
- That monthly average reached $5,782,324 in 2023, the last full year in the firm’s published series.
- The strongest single month FTMO has disclosed was January 2024, when it sent $9,643,269 to traders.
- On an annual basis, FTMO says it paid $3,404,178 for the entire year in 2020, rising 22-fold to $75,170,210 by 2023.
- FTMO reports the same curve in daily payouts, moving from a daily average of $39,584 in 2020 to $209,973 in 2023.
- The series stops at January 2024 because that is where FTMO’s own published review stops, which is why the lifetime total is the only current number the firm offers.
Recent Developments
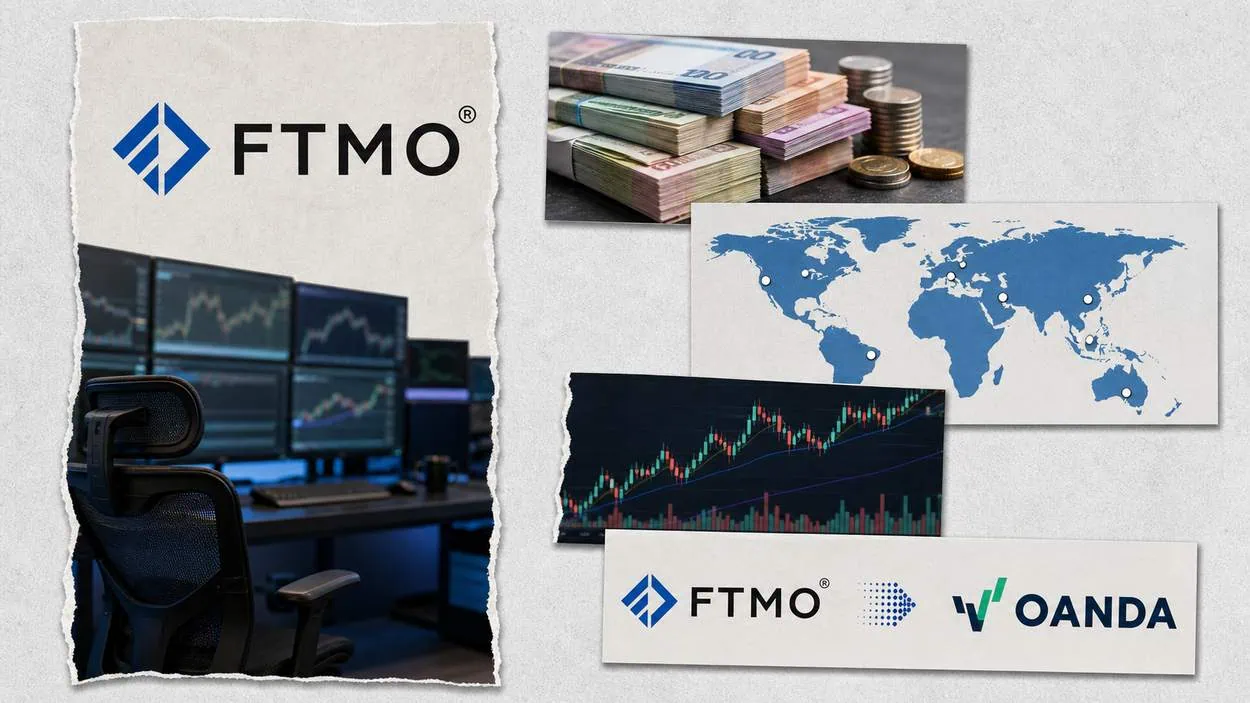
- December 1, 2025: FTMO completed the acquisition of OANDA Global Corporation from CVC Asia Fund IV.
- December 2, 2025: FTMO disclosed that closing required approvals from a total of five regulators over approximately eight months.
- December 2, 2025: OANDA chief executive Gavin Bambury said Today, we mark a pivotal moment as OANDA officially joins the FTMO ecosystem.
- 2025: FTMO described the deal as bringing in a global broker with 30 years of history and licenses across major global markets.
- August 2026: FTMO’s live product pages show a 1-Step evaluation priced from €79 with a 90% reward share.
- August 2026: FTMO’s group page lists three segments: FTMO for modern prop trading, OANDA for brokerage, and Quantlane for traditional prop trading.
How Many FTMO Payouts Clear Each Month
- FTMO reports processing an average of 305 payouts per month in 2020.
- FTMO reports that count rising to 1,713 payouts in one month in 2023.
- For January 2024 alone, FTMO reports 2,753 payouts sent to clients.
- FTMO reports its busiest single day in that series carried up to 196 payouts, worth $628,317, on Tuesday, January 2, 2024.
- Payout counts read better than payout dollars, because one very large reward can carry a month’s total while saying nothing about how many people were paid.
By the numbers: FTMO reports its monthly payout count rising from 305 in 2020 to 2,753 in January 2024, while the amount per month moved from $851,044 to $9,643,269. Payments grew faster than payouts, so the average reward per payout climbed across the same window rather than holding flat.
Largest FTMO Payouts by Region
- The largest single payout FTMO has published is $964,980.55, achieved by a trader named Dariusz.
- In Europe, FTMO reports Axel from Belgium took the biggest payout of $110,252.56.
- In Oceania, FTMO reports Adrian from Australia had the highest payout of $87,690.39.
- In Asia, FTMO says Quang from Vietnam received $86,956.28.
- In Africa, FTMO reports Pascal from Kenya collected $74,229.14.
- In South America, FTMO says Hugo from Brazil received $45,164.36.
Regional records are the most-quoted FTMO numbers and the least representative. They describe one account each, in five regions, at one point in time, and the average reward tells a reader far more than the record does.
Participation patterns in adjacent retail markets are better mapped by crypto adoption rates by country, both of which publish the denominators this dataset lacks.
FTMO Challenge Cost by Account Size
- The entry tier is a $10,000 simulated account at a one-time non-refundable fee of €79.
- A $25,000 account carries a fee of €199.
- A $50,000 account carries a fee of €319.
- The $100,000 tier is listed at €399, reduced from €499.
- The largest tier is a $200,000 account at €999.
- FTMO states the 2-Step evaluation starts at €89, and the 1-Step starts at €79.
- Only the 2-Step path carries a 100% refund; the 1-Step listing shows no refund line.
How much is an FTMO $200,000 account?
FTMO lists an Account $200,000 at a one-time fee (non-refundable) of €999, the top of a ladder that starts at €79 for an Account $10,000. The fee buys an evaluation on simulated capital, not the capital itself. Every tier carries identical rule thresholds.
FTMO 1-Step Challenge Rule Thresholds
- The 1-Step profit target is 10% of the Initial Simulated Capital.
- Maximum daily loss is capped at 3% of the Initial Simulated Capital, recalculated daily at 00:00 CE(S)T.
- Maximum loss is capped at 10% of the Initial Simulated Capital on an end-of-day trailing basis.
- The Best Day Rule requires a trader’s Best Day to represent no more than 50% of Positive Days’ Profit.
- The reward share on the 1-Step is 90% of simulated profits.
- FTMO states that all applicable Trading Objectives must be satisfied concurrently to meet the evaluation requirements.
What is the 3% rule in FTMO?
The 3% rule is the 1-Step maximum daily loss limit, recalculated each day at 00:00 CE(S)T as the day’s opening balance minus 3% of the Initial Simulated Capital, with equity dropping below that line treated as a violation. The 2-Step version of the same rule uses 5%.
What is the Best Day rule in FTMO?
The Best Day Rule requires that a Best Day does not represent more than 50% of a trader’s Positive Days’ Profit. Exceeding the Best Day limit is not treated as a rule breach.
FTMO 1-Step and 2-Step Challenge Structure Compared
- The 2-Step runs two phases against the 1-Step’s single phase.
- Profit targets differ by phase: 10% then 5% on the 2-Step, against a single 10% on the 1-Step.
- Maximum loss type differs: static on the 2-Step, end-of-day trailing on the 1-Step.
- The 2-Step imposes a minimum of 4 trading days, defined as any day on which at least one position is opened; the 1-Step listing shows no minimum.
- Account types differ: Standard and Swing on the 2-Step, Standard only on the 1-Step.
- Both products carry an unlimited trading period.
| Dimension | 2-Step | 1-Step |
|---|---|---|
| Evaluation phases | 2 | 1 |
| Profit target | 10% then 5% | 10% |
| Max daily loss | 5% | 3% |
| Max loss | 10% | 10% |
| Max loss type | Static | End-of-day trailing |
| Minimum trading days | 4 | None listed |
| Best Day Rule | None listed | 50% |
| Refund | 100% | None listed |
| Account types | Standard, Swing | Standard |
| Starting fee | From €89 | From €79 |
Source: FTMO 2026
FTMO Scaling Plan Requirements and Account Growth
- The Scaling Plan raises account size by 25% every 4 months.
- The ceiling is up to $2,000,000 across all FTMO accounts a trader holds.
- Qualifying requires a minimum of 4 months of trading as an FTMO Trader, or since the last scale-up.
- It also requires at least 10% net simulated profit above the starting balance within the prior 4 months.
- A trader must have at least 2 processed rewards within that same 4-month period.
- The account must show a positive balance at the time of scale-up.
- The 90% reward share under the Scaling Plan is valid for the 2-Step only.
| Scaling Plan condition | Requirement |
|---|---|
| Minimum time as FTMO Trader | 4 months |
| Net simulated profit in prior period | At least 10% |
| Processed rewards in prior period | At least 2 |
| Account balance at scale-up | Positive |
| Account size increase per step | 25% |
| Maximum account size | $2,000,000 |
| Reward share | 90% (2-Step only) |
Source: FTMO 2026
Worth noting: Reaching FTMO’s $2,000,000 ceiling from a $100,000 account means clearing the 25% step repeatedly, and each step demands 4 months, 10% net simulated profit and 2 processed rewards. The ceiling is real, but it is a multi-year path, not a product tier a trader can buy.
FTMO Group Structure After the OANDA Acquisition
- FTMO Group now spans FTMO for modern prop trading, OANDA for brokerage, and Quantlane for traditional prop trading.
- FTMO completed the OANDA purchase on December 1, 2025, from previous owner CVC Asia Fund IV.
- Chief executive Otakar Šuffner described OANDA as a broker with licenses in eight key markets across the world.
- OANDA holds regulated entities in New York, Toronto, London, Warsaw, Singapore, Tokyo, the British Virgin Islands and Sydney.
- FTMO said it would maintain the OANDA group as a fully standalone business, and the parties did not disclose the value of the transaction.
- Advisers included J.P. Morgan as financial adviser and Latham & Watkins as legal advisers to FTMO, with Nomura and Santander advising CVC.
| Group segment | Entity | What it does |
|---|---|---|
| Modern prop trading | FTMO | Simulated-account evaluations and rewards |
| Brokerage | OANDA | Regulated live brokerage in eight key markets |
| Traditional prop trading | Quantlane | Quantitative and institutional trading |
Source: FTMO 2026, OANDA 2025
The structural point is ownership, not integration. FTMO says OANDA stays standalone, so a reader holding an FTMO evaluation account is not thereby a client of a licensed broker. The two sit under one roof and under different rulebooks.
FTMO Milestones From 2015 to 2025
- FTMO traces its origin to 2015, when Prague classmates Otakar Šuffner and Marek Vašíček launched Získejúčet.cz.
- The FTMO Challenge in its global form dates to 2017, combining simulated trading with real-time market data.
- The firm reports growing its user base from thousands to millions of traders across 2019 and 2020.
- Deloitte named FTMO Central Europe’s fastest-growing tech company for three consecutive years between 2021 and 2023, at a record growth of 39,432%.
- FTMO says it has won the Deloitte Fast 50 award for the fastest-growing tech companies in Central Europe five times since its 2015 founding.
- The group acquired Quantlane, a traditional proprietary trading firm, in 2023.
Where FTMO Sits in the Prop Trading Regulatory Perimeter
- FTMO states plainly that it only provides services of simulated trading and educational tools, does not act as a broker, and does not accept deposits.
- FTMO describes the FTMO Account itself as a demo account that a trader becomes eligible to gain upon completing the Trading Objectives.
- Regulatory scrutiny of the sector is unsettled in the United States, where CFTC Commissioner Caroline D. Pham said the agency’s own complaint against a rival prop firm fails to get the law right.
- Pham argued the Commission was engaging in an unprecedented overreach of its limited authority over spot commodity transactions in that case.
- In the European Union, national regulators found 74-89% of retail contract-for-difference accounts typically lose money, with average losses per client ranging from €1,600 to €29,000.
- Those ESMA measures were agreed by the Board of Supervisors on 23 March 2018 and apply to CFD providers rather than to simulated-account evaluations.
| Authority | What the record shows | Applies to |
|---|---|---|
| FTMO’s own disclosure | Simulated trading only, no brokerage, no deposits | FTMO evaluations |
| CFTC (US) | A sitting Commissioner disputed the agency’s legal theory in an action against a rival prop firm | US retail commodity transactions |
| ESMA (EU) | 74-89% of retail CFD accounts typically lose money | Regulated CFD providers, not evaluations |
| Five unnamed regulators | Cleared FTMO’s OANDA acquisition over roughly eight months | Change of control at a licensed broker |
Source: FTMO 2026, CFTC 2024, ESMA 2018
The ESMA figure is not an FTMO statistic and should not be read as one. It measures live CFD accounts at licensed brokers, not evaluation accounts at a prop firm. It is included because it is the only regulator-grade loss statistic that exists for the activity FTMO’s evaluations simulate, and because no equivalent figure exists on the prop-firm side of the line.
The same disclosure gap runs through the category rather than through one firm. Broker education pages that catalogue the most talked‑about proprietary trading firms list evaluation fees, and profit splits for each of them and a pass rate for none, which is the industry norm rather than an FTMO decision. Private-market data behaves the same way, as CoinLaw’s own equity coverage shows: totals are published readily, participation outcomes far less so.
What FTMO Does Not Publish About Pass Rates and Payouts
- FTMO publishes a reward total and a customer count, both as floors, and no figure connecting the two.
- Nothing in FTMO’s published material states how many of its more than 4.5 million customers have received any reward.
- The 138,000 FTMO Accounts figure counts accounts created, not traders paid, and dates from early 2024.
- FTMO publishes an average 1-Step reward of $3,336.61 without stating the number of rewards that average covers.
- No pass rate appears anywhere in FTMO’s primary material. Searchers ask for one constantly, and every third-party figure circulating online is an estimate built on samples the estimator cannot see. CoinLaw does not publish an inferred pass rate for that reason.
- FTMO’s Czech statutory filings would carry audited group figures, but the register’s filing viewer did not return machine-readable documents during this review, so no revenue or profit figure is stated here.
| Question readers ask | Does FTMO publish it? | What exists instead |
|---|---|---|
| Pass rate | No | Rule thresholds and a 2-day fastest-pass record |
| Number of traders paid | No | More than $650 million paid in total |
| Number of rewards behind the average | No | An average 1-Step reward of $3,336.61 |
| Failed evaluations | No | More than 138,000 accounts created by early 2024 |
| Audited revenue | Not on the public site | Award citations and growth percentages |
| Payout data after January 2024 | No | A lifetime total shown as a floor |
Source: FTMO 2026, FTMO 2024
Why it matters: A payout total is only meaningful next to the number of people who paid to compete for it. FTMO discloses more than $650 million in rewards and more than 4.5 million customers, but never the count of customers who received a reward. Without that denominator, no success rate for an FTMO Challenge can be calculated from published data.
Does FTMO actually pay out?
FTMO publishes a payout record in enough detail to answer this narrowly: it reports more than $650 million in rewards since 2015, names individual recipients and amounts by region, and reports a single day carrying up to 196 payouts worth $628,317. What that record does not establish is the odds of being one of those recipients, because the firm has never published how many customers were paid against how many paid to enter. Payouts demonstrably happen; their frequency across the customer base is undisclosed.
What is FTMO’s pass rate?
FTMO does not publish a pass rate, and no figure in its primary material supports calculating one. The firm publishes the thresholds a trader must clear (a 10% profit target, a 3% or 5% daily loss cap, and a 10% maximum loss) and outcome records such as 2 days as the shortest time to pass, but never the share of evaluations that succeed. Pass-rate percentages attributed to FTMO elsewhere are estimates rather than disclosures, so none is reproduced here.
Is FTMO allowed in the USA?
FTMO’s own materials do not present the firm as a US-regulated entity: it states that it provides simulated trading and educational tools only, does not act as a broker, and does not accept deposits. Availability by country is set in FTMO’s own terms rather than in any published statistic, and the US regulatory position for prop-firm evaluations remains contested, as the CFTC Commissioner statement above shows. Check FTMO’s current terms for your jurisdiction.
Conclusion
FTMO’s reported $650 million in rewards, more than 4.5 million customers and more than 140 countries served describe a business that pays out at scale. The figures that would let a reader judge their own odds- the number of customers paid and the share of evaluations passed- are the ones FTMO withholds. Set against ESMA’s 74-89% of retail contract-for-difference accounts that typically lose money across EU jurisdictions, that absence is the most consequential statistic here.
The next disclosure worth watching is structural. With OANDA inside the group since December 1, 2025, and licenses in eight key markets, FTMO sits partly inside a regulated perimeter and partly outside it. The same asymmetry runs through the retail investing data CoinLaw tracks, where headline totals are published far more readily than participation outcomes.