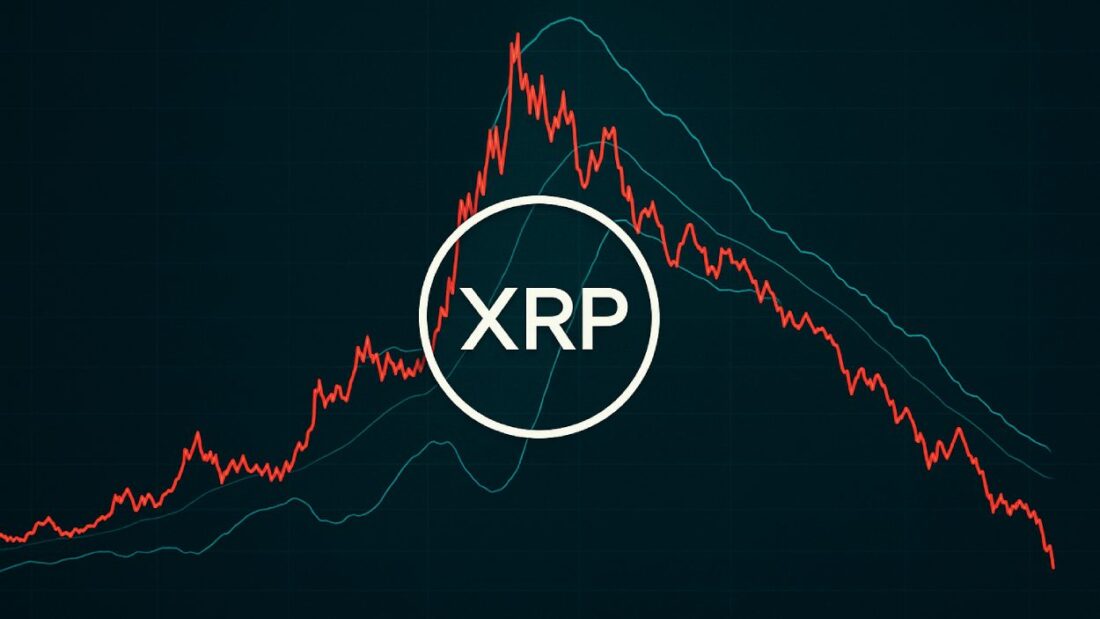
XRP is under renewed selling pressure as analysts warn the cryptocurrency may soon retest the $2 level, raising fresh concerns among traders.
Key Takeaways
- XRP dropped over 14% in a week, slipping from a peak of $2.79 to as low as $2.42.
- Analyst Ali Martinez warns XRP could revisit $2 if bearish momentum continues.
- Key support and resistance levels identified at $2.10 and $2.80 using URPD metrics.
- Technical indicators show growing downside risks, with RSI near oversold levels and negative MACD divergence.
What Happened?
XRP is struggling to hold ground after breaking below several key price levels. The token fell from $2.79 to $2.42 in just a week, with $8 billion in market value lost in 24 hours. Analyst Ali Martinez believes this could be the start of a deeper correction, possibly sending the token back down to $2.
$XRP looks like it wants to revisit $2! pic.twitter.com/B2QFVKsMWw
— Ali (@ali_charts) October 15, 2025
XRP Faces Renewed Downside Pressure
XRP’s recent rejection at the $2.64 resistance level triggered an immediate drop of 8 percent, highlighting growing weakness in market sentiment. After testing this supply-heavy zone, the token now trades around $2.42.
- The rejection occurred at a strong resistance zone, where large sell orders halted momentum.
- This price rejection aligns with prior market behavior, suggesting strong overhead resistance.
- Martinez stated that XRP “could fall further” if this bearish trend holds.
Traders are now closely watching the $2 level, which could represent a critical test of support. This would be a 17.3 percent drop from current levels and would confirm the bearish outlook many analysts now hold.
Chart Signals Support the Bearish Case
Technical indicators are pointing toward continued weakness for XRP. The token has broken below key levels that many traders watch for support and trend reversal signals:
- Fell below the 38.2% Fibonacci retracement level at $2.52.
- Lost its 30-day moving average at $2.83.
- RSI is at 34, showing that sellers remain in control, with more downside room.
- Bollinger Bands are widening, indicating increased volatility.
- MACD shows a negative divergence, suggesting bearish momentum is building.

Compared to Bitcoin and Ethereum, XRP’s decline has been steeper, increasing concerns that it may continue to underperform in the near term.
Support and Resistance Levels Highlighted by URPD Data
Martinez highlighted key zones identified through the UTXO Realized Price Distribution (URPD) metric. This data maps out where large amounts of XRP previously changed hands, marking significant areas of supply and demand.
- $2.80 resistance: Over 2.58 billion XRP (3.97% of the total supply) were traded at this level, creating strong selling pressure.
- $2.10 support: Around 1.64 billion XRP (2.56% of circulating supply) exchanged hands here, potentially offering buyer support.
If XRP drops to the $2.10 to $2 range, this zone may attract buyers and provide a short-term floor.
Market Uncertainty and Outlook
Although XRP rebounded 76% earlier this month after dropping to $1.37, its current trend has flipped negative again. The rejection at $2.64 and the failure to establish higher highs suggest the market is losing bullish conviction.
According to Martinez, XRP needs to reclaim the $2.80 resistance to shift sentiment and revive buying interest. Without such a breakout, bearish pressure is likely to dominate.
CoinLaw’s Takeaway
In my experience watching volatile crypto assets, support and resistance zones matter more than most traders realize. Right now, XRP looks trapped below key resistance and inching toward critical support. A drop to $2 might sound dramatic, but the signals are aligning. We have a steep decline, weakening indicators, and a chart full of lower highs. That usually spells trouble.
I found Martinez’s use of URPD metrics particularly helpful. It shows where real money moved, not just abstract chart lines. That makes $2.10 and $2.80 levels worth watching closely. If XRP can’t bounce soon, brace for another leg down.


