Decentralized exchanges (DEXs) continue to reshape how people trade cryptocurrencies. They show striking growth in trading volume, total value locked (TVL), and institutional interest. Real-world examples include Uniswap launching its v4 upgrade with Hooks to reduce gas costs and improve user flexibility, and PancakeSwap breaking its monthly trading volume record in June 2025. These developments signal deepening maturity in DeFi.
Editor’s Choice
- The global DeFi protocols’ TVL reached $123.6 billion in Q2 2025, up 41% year-over-year.
- Ethereum remains dominant, holding ~63% of total DeFi protocol TVL (~$78.1 billion) in mid-2025.
- PancakeSwap’s trading volume hit $325 billion in June 2025, its highest monthly figure ever.
- Uniswap’s TVL is approximately $4.5 billion mid-2025 across all supported chains.
- The combined market capitalization of the top 100 DeFi tokens is about $98.4 billion as of Q2 2025.
- PancakeSwap recorded 7.4 million unique users in Q2 2025.
Recent Developments
- Uniswap rolled out v4 in early 2025, introducing Hooks, singleton design, and gas optimizations.
- PancakeSwap broke its monthly trading volume record in June 2025, at $325 billion, nearly double May’s volume.
- Solana’s developer activity reportedly grew 200% annually, supported by low fees (~$0.0025 per txn) and fast block times (~400ms).
- Institutional funds (e.g., Franklin Templeton) expanded exposure to DeFi on chains like Solana.
- Gas cost reductions on Uniswap v4 (e.g, via direct ETH support, reduced reliance on WETH) improve trade efficiency.
- Large-scale cross-chain activity has increased, especially with the growth of Arbitrum, BNB Chain, Optimism, and Base.
- TVL growth in Ethereum was up ~33% quarter-over-quarter in one recent period.
- Uniswap v4 achieved ~$1 billion TVL in its first ~177 days, faster than v3’s comparable growth.
User Base and Adoption Trends
- Over 14.2 million unique wallets interacted with DeFi protocols by mid-2025.
- PancakeSwap had 7.4 million unique users in Q2 2025.
- The average daily trading volume across some major DEXs ranges between $1-2 billion, depending on volatility.
- DEX aggregators and routing volume saw increases, 1inch, Matcha routed over $3.9 billion weekly in recent data.
- Weekly DEX trading volume averaged $18.6 billion in Q2 2025, up ~33% YoY.
- More than 9.7 million unique wallets interacted with DEXs by mid-2025, up from ~6.8 million last year.
- Institutional interest (funds, ETFs) is increasing, particularly in scalable chains like Solana and Arbitrum.
- Stablecoin transaction volume has surged, facilitating trading and onboarding.
Leading DEXs by Total Value Locked (TVL)
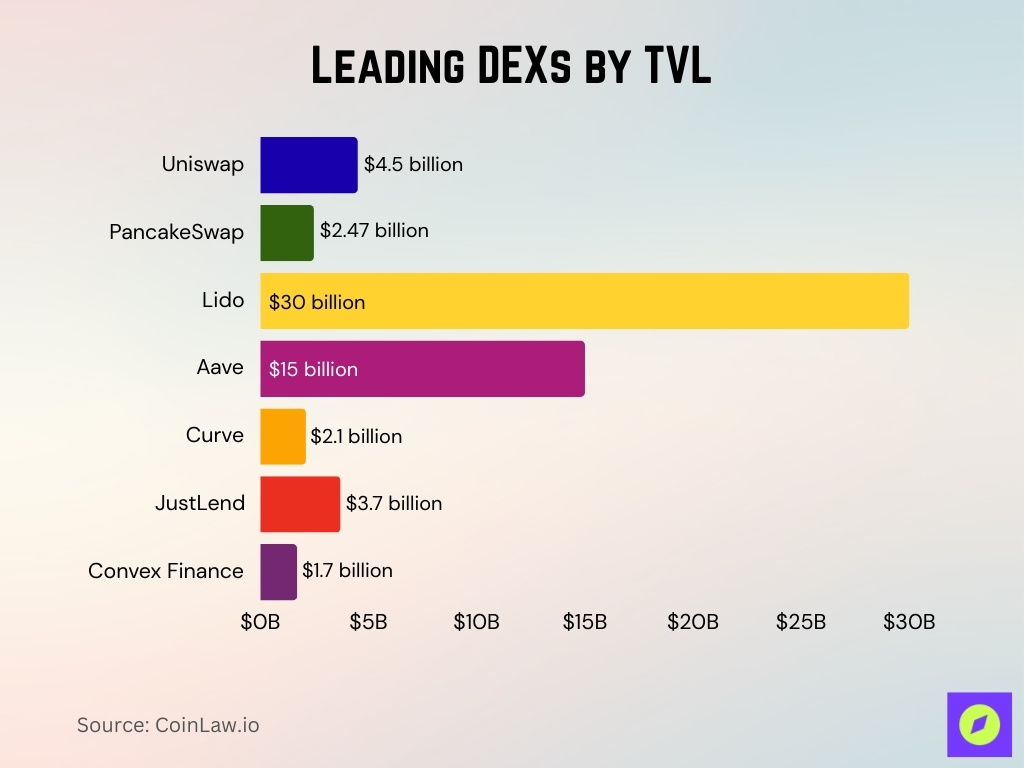
- Uniswap has ~$4.5 billion TVL across its chains as of mid-2025.
- PancakeSwap holds about $2.47 billion TVL, with the majority on BNB Chain (~$2.18 billion).
- According to a ranking, Lido leads the DeFi platforms with ~$30 billion TVL, followed by Aave (~$15 billion) and Uniswap (~$10 billion).
- Curve Finance holds around $2.1 billion TVL in this ranking.
- Another DeFi platform, JustLend, has around $3.7 billion TVL.
- Convex Finance reported ~$1.7 billion TVL.
Most Popular Trading Pairs on DEXs
- The BTC/USDT pair remains among the top trading pairs across many DEXs.
- ETH/USDC and ETH/USDT are consistently in the top 3 most-traded pairs on Ethereum DEXs.
- On Solana DEXs such as Orca, the pairs SOL/USDC and SOL/USDT lead daily trade volume, with SOL-based pairs dominating.
- On Uniswap V4, many of the high-liquidity pools are for stablecoin-stablecoin swaps and ETH/stablecoin pairs.
- Some volatile asset pairs generate high percentages of trades but contribute less in aggregate volume due to higher slippage.
- BNB/USDT pairs are popular on BNB Chain and in multi-chain DEXs, bridging BNB-ecosystem tokens.
- On chain-agnostic aggregators, cross-chain or multi-hop pairs involving USDT, USDC, or ETH are frequent.
- For derivative DEXs like dYdX, the BTC perpetual vs USD stablecoin and ETH perpetual vs USD remain among the top pairs.
Fee Structures and Cost Comparison
- Many DEX swap fees are in the range of 0.20% to 0.30% for standard pools.
- Some stablecoin pools charge much lower fees, often around 0.02% to 0.05%.
- Swap fee breakdowns often allocate most to liquidity providers, with a smaller portion going to protocol treasuries.
- Some newer DEXs experiment with 0% maker fees or subsidized fees to attract liquidity.
- On derivative platforms like dYdX, maker and taker fees are often in the lower basis points.
- Gas and network fees remain a non-negligible cost for many users.
- Aggregators sometimes help lower effective cost by routing through cheaper pools.
- Some DEXs use flexible fee models with higher fees for volatile pairs and lower fees for stablecoin pairs.
DEX Platform Statistics by Blockchain
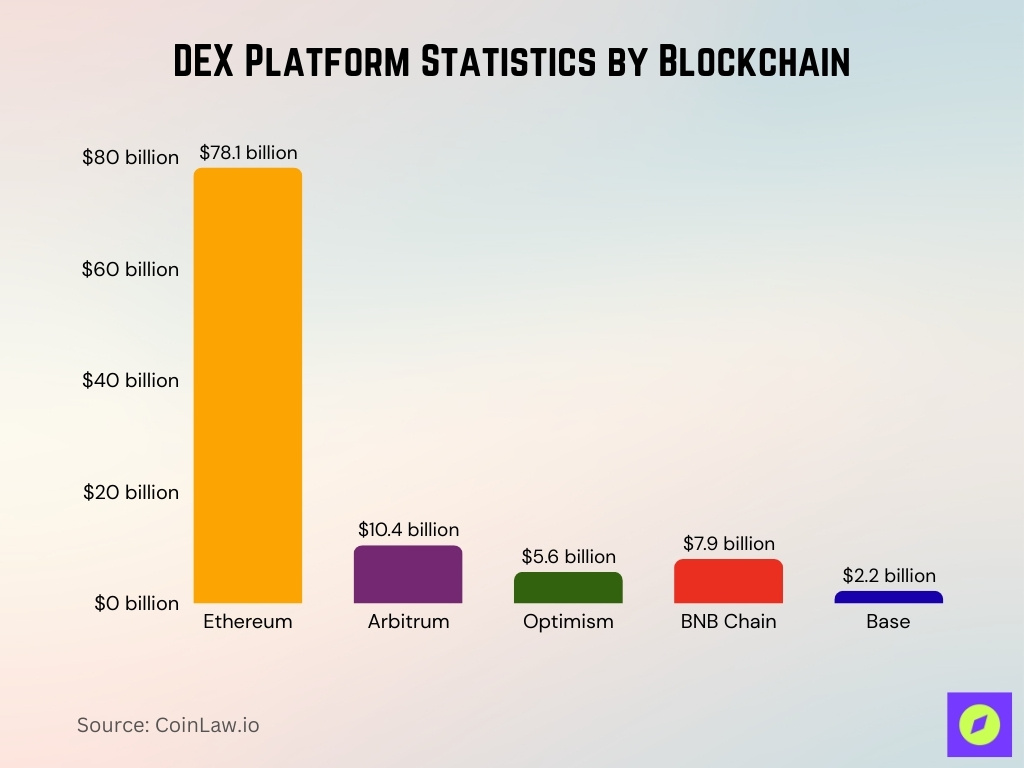
- Ethereum: ~$78.1 billion TVL among DeFi protocols representing ~63% of total DeFi TVL.
- Arbitrum: ~$10.4 billion TVL, with ~70% YoY increase.
- Optimism: ~$5.6 billion TVL, more than doubled from ~$2.3 billion in 2024.
- BNB Chain: Moderately growing to ~$7.9 billion in TVL.
- Base (Coinbase’s L2): ~$2.2 billion TVL, increasing since its launch.
- Solana is seeing strong DEX activity, including high transaction and DEX usage share and technical attractiveness (low fees, fast block time).
- DEX volume distribution, for Uniswap, ~67.5% of daily volume now occurs on Layer-2 networks.
- PancakeSwap dominates on BNB Chain but also supports cross-chain activity in its TVL breakdown.
- Liquid staking protocols, while not strictly DEXs, figure heavily in TVL composition on chains like Ethereum.
Liquidity Depth and Slippage Rates
- Liquidity depth is much higher for stablecoin pools and major asset pairs.
- For more volatile or low-liquidity tokens, slippage can be significant, reaching 0.3% to 1%+.
- Concentrated liquidity models reduce slippage by focusing liquidity around active price ranges.
- Smart routing and aggregator tools help reduce slippage by splitting trades across multiple pools.
- In fast-moving markets, slippage tends to spike due to shallow liquidity and MEV activity.
- Average daily slippage for large trades on major DEXs has dropped compared to earlier years.
- Spread on many high liquidity pools is minimal, often only a few basis points.
- Effective cost to trader includes slippage, gas, routing, and swap fees.
Cross-Chain and Multichain DEX Activity
- DEX trading volume rose ~37% in 2025, with an average monthly volume of ~$412 billion.
- Ethereum-based DEXs account for ~87% of decentralized trading by volume.
- Solana DEXs process over $1.5 billion in daily trades, showing strong competition.
- Chains like BNB Chain, Polygon, Base, Arbitrum, and Optimism are increasingly significant.
- Cross-chain DEXs and bridges are being used more often for arbitrage and liquidity migration.
- Aggregators supporting multiple chains see rising usage as users seek the best rates.
- Liquidity fragmentation remains a challenge across many chains.
- Some multichain DEXs introduce incentives to attract liquidity to less-used chains.
Decentralized Storage Market Key Statistics
- The global decentralized storage market was valued at $622.9 million in 2024 and is forecasted to hit $4.5 billion by 2034.
- The market is projected to expand at a strong CAGR of 22.4% from 2025 to 2034.
- The public cloud segment alone is expected to exceed $2 billion in market size by 2034.
- The enterprise segment accounted for 45% of market share in 2024, reflecting high institutional adoption.
- North America held a 40% market share in 2024, making it the leading regional contributor to decentralized storage adoption.

Aggregators and Routing Volume
- Routing volume via aggregators like 1inch and Matcha exceeds $3.9 billion weekly.
- Average 30-day trading volume on 1inch is around $8.6 billion.
- Ethereum DEX aggregator market share is increasingly concentrated.
- Aggregators improve execution with gas optimization, MEV protection, and cross-chain routing.
- Aggregators serve as on-ramps for institutional capital, acting as middleware.
- Some aggregators are building KYC and compliance features to attract institutions.
- Aggregated routes often span multiple chains, adding bridge risk and complexity.
Smart Contract Audits and Exploits
- In Q1 2025, over $2 billion was lost to Web3 exploits and attacks.
- In August 2025, $163 million was stolen across 16 exploits.
- The Cetus DEX was hacked in May 2025 for approximately $223-260 million.
- The New Gold Protocol lost $2 million via a flash loan exploit.
- Nemo Protocol on Sui suffered a ~$2.6 million exploit.
- Approximately 80% of total crypto losses in some periods derive from DeFi protocols.
- Formal verification and audits reduce losses, though adoption varies.
- Exploits from unaudited code and flawed logic persist, hitting smaller DEXs hardest.
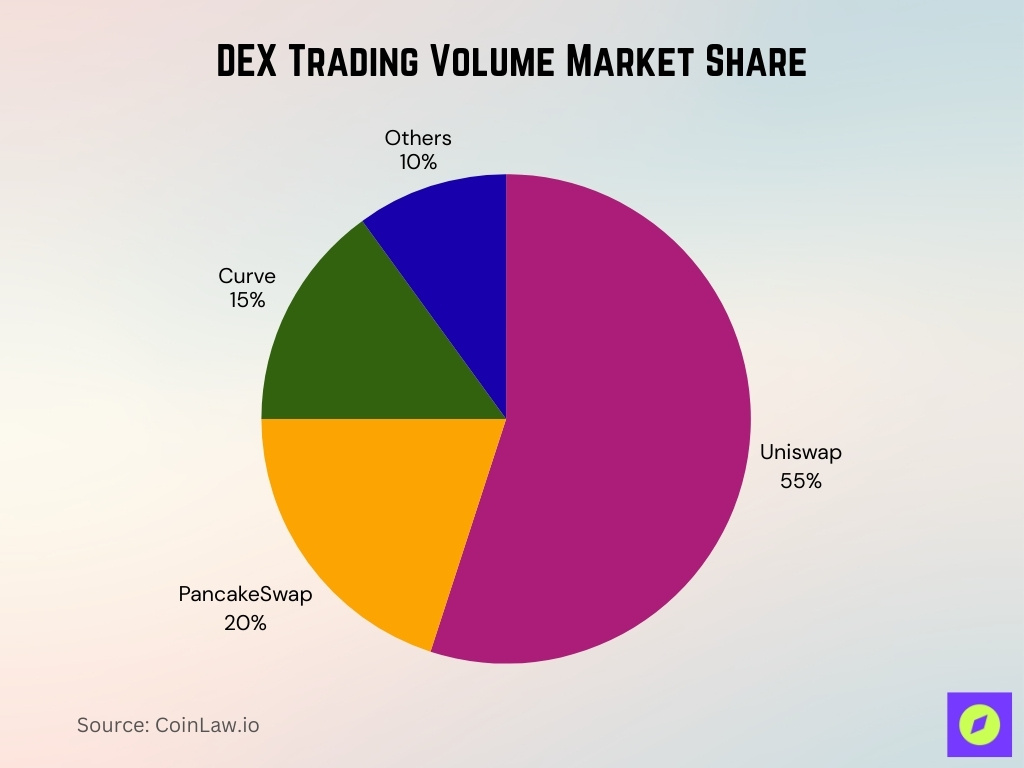
Trading Volume Market Share
- Uniswap dominates the DEX market with a 55% share, making it the clear leader in trading volume.
- PancakeSwap holds 20%, securing the second-largest share among decentralized exchanges.
- Curve accounts for 15%, showing strong traction in liquidity provision and stablecoin swaps.
- Other DEXs combined represent 10%, highlighting a smaller but still competitive segment of the market.
Regulatory and Compliance Statistics
- The GENIUS Act was passed in July 2025 in the U.S., establishing oversight for stablecoin issuers.
- 90% of centralized crypto exchanges in North America are fully KYC compliant in 2025.
- Average compliance costs for crypto firms have risen by ~28% in 2025, reaching $620,000 annually.
- AML and KYC protocols now consume ~34% of compliance budgets.
- The SEC brought 33 crypto enforcement actions in 2024, down from 46 in 2023.
- CFTC enforcement actions rose ~59% year-over-year.
- Cybersecurity and operational risk standards are tied to compliance frameworks.
- The cost of non-compliance is rising, pushing firms toward stricter controls.
DEX Derivatives and Perpetuals Growth
- Perpetual futures trading volume on DEXs hit $898 billion in Q2 2025.
- Hyperliquid recorded $653 billion in Q2, securing ~73% market share.
- dYdX remains among the top decentralized derivatives exchanges.
- Growth is driven by demand for leverage, speculation, and hedging tools.
- Institutional traders increasingly participate in perpetual markets.
- Risk and compliance concerns remain key barriers.
- Cross-chain perpetual offerings are emerging with both opportunities and risks.
- Derivatives volume growth is outpacing spot DEX growth in many quarters.
Mobile and Wallet-based DEX Usage
- Mobile-first and wallet-integrated DEXs have gained ~1.2 million new users in 2025.
- Wallet-based trading continues to rise as users seek custody of their funds.
- Mobile usage contributes a growing share of DEX interactions.
- Lower-fee chains are especially attractive for mobile users.
- Wallet UX improvements reduce friction and help adoption.
- Security risks are higher for mobile users due to phishing exposure.
- Mobile users typically execute small to medium trades.
- Offline or light-wallet optimization is relevant in high-cost environments.
DEX User Demographics and Geographic Distribution
- Over 9.7 million unique wallets interacted with DEXs by mid-2025, up from ~6.8 million last year.
- Daily trading volume is concentrated in North America, Europe, and Asia.
- Developing nations show faster DEX adoption growth rates.
- Younger users, ages 18-35, make up the majority of retail DEX activity.
- Institutional users concentrate in jurisdictions with clearer regulations.
- Prior crypto experience correlates with a higher likelihood of DEX use.
- Gender distribution still skews male, though shifting slightly.
- Low-fee chains see higher adoption in Asia and Africa for smaller trades.
Frequently Asked Questions (FAQs)
DEXs reached $876.3 billion in spot trading volume in Q2 2025, up over 25% from the previous quarter
Hyperliquid held nearly 73% of the perpetual DEX market share with $898 billion in derivatives/perpetuals trading volume during Q2 2025.
Average weekly DEX trading volume was $18.6 billion in Q2 2025, and unique wallets interacting with DEXs increased from ~6.8 million to 9.7 million mid-2025.
Total TVL across all DeFi protocols was $123.6 billion, with Ethereum contributing $78.1 billion, i.e., about 63% of the total.
The DEX-to-CEX trading volume ratio rose to 0.23, while centralized exchange spot volume dropped nearly 28% in Q2 2025
Conclusion
The DEX landscape shows clear signs of maturation. Aggregators are not just tools for retail users; they are becoming critical infrastructure for institutions. But risks remain high, exploits, security lapses, and regulatory uncertainty still pose real threats. Derivatives and perpetual trading on DEXs are exploding, mobile and wallet-based platforms are drawing serious traction, and user adoption continues growing globally.
For traders and protocol developers, the key takeaways are, choose DEXs or aggregators with strong security audits, prioritize chains and tools that lower fees and slippage, and track evolving regulations. As DEXs grow closer to matching centralized alternatives in volume, depth, and trust, the coming years will test which platforms survive the security, compliance, and usability challenges.


