



• Skip to primary navigation
  • Skip to main content
  • Skip to primary sidebar
  • Skip to footer
CoinLaw LogoCoinLaw

Bringing Crypto & Finance Closer to You

  • Latest News
  • Statistics
  • Tools
  • About
  • Contact
  • Subscribe
Subscribe
CoinLaw Logo
  • The Finance Desk
  • Payments
  • Investments
  • Finance
  • Banking
  • Insurance
  • Fintech
  • Lending
  • Compliance
Add as a preferred
source on Google
Home » Insurance

Commercial Insurance Industry Statistics 2026: Powerful Insights

Published on: February 23, 2026
Steven Burnett
Research Analyst • 246 Articles
Steven Burnett has over 15 years of experience across finance, insurance, banking, and compliance-focused industries. Known for his deep res... See full bio
LATEST POSTS:
Federal Tax Revenue by State Statistics 2026: IRS Gross Collections, Top 10 States, Donor vs Recipient
Global Systemically Important Banks Statistics 2026: Bucket Allocation and Capital Surcharges
Tariff Revenue Statistics 2026: Customs Duties and IEEPA Refunds
Barry Elad
Founder & Senior Journalist • 586 Articles
Barry Elad is a finance and tech journalist who loves breaking down complex ideas into simple, practical insights. Whether he's exploring fi... See full bio
LATEST POSTS:
Bougainville Crypto Regulation and Licensing: What the Rules Say
Bitcoin Mining by Country Statistics 2026: Hashrate Share by Nation
What Is BitFuFu’s Hashrate Token (HASH)? How Bitcoin Mining Output Moves Onchain
Commercial Insurance Industry Statistics
As Featured In
Deloitte logoForbes LogoFortune LogoCoinDesk LogoInvestopedia logo
Share on LinkedIn ChatGPT Perplexity Share on X Share on Facebook

This report has been updated 2 times. Last updated on February 23, 2026

  • Editor’s Choice updated from $940 billion premiums (2025) to ~$1.4 trillion projected premiums with ~2–3% growth.
  • Market outlook changed from 2025–2031 (6.3% CAGR) to 2026–2033 (7.5% CAGR) forecast.
  • Added detailed market sizing: $934.57 billion (2025) → $1,666.79 billion by 2033 (+$732 billion growth).
  • Commercial pricing trend updated to rates down ~4% globally, property down up to 8%.
  • New reinsurance capital figures: $760 billion total capital; ~$115 billion alternative capital (~15%).
  • Catastrophe bond issuance revised to record $25.6 billion (2025), $7 billion in Q4 across 27 deals.
  • Added forecast of double-digit reinsurance rate decreases for 2026 renewals.
  • The restaurant section replaced coverage rates with claim categories, costs, and risk metrics.
  • Hospitality data breach cost introduced at $3.36 million average.
  • New restaurant coverage package estimate at $4,306 per year.
  • Replaced insurer market share stats with asset- and premium-based rankings (e.g., Berkshire $1.15 trillion assets).
  • BOP retail cost figures significantly revised upward (e.g., convenience stores $1,799 → $2,208).
  • Added overall retail averages: $1,136 per year BOP; $2,252 full bundle.
  • Small business liability cost clarified to $45 per month or $538 per year; $500 median premium.
  • Added SMB cyber adoption at 47% and breach survival risk (60% close within six months).
  • Introduced broader SMB metrics: $150 billion U.S. market; health coverage offered by only 50%.
  • Expanded UK building insurance section with ranges (e.g., restaurant £700–£1,500 per year).
  • Added rebuild-cost benchmarks (e.g., £585 per year for £500,000 rebuild value).
  • Legal requirements section expanded with state-specific liquor liability mandates.
  • Casualty trends updated to quarterly rate data (e.g., auto liability +14.9%, 36th consecutive quarterly increase).
  • Added forward outlook: general liability up to 9% in Q1 2026.
  • New large-verdict metrics: median $24.6 million nuclear verdict (2010–2019).
  • Introduced underwriting sentiment: 83% see a rising D&O risk environment.
  • Workers’ comp example added: Washington rates +4.9% (~$71 per full-time employee).
  • Medical-legal costs reported up 30% over four years.
  • Cyber section updated to 2026 outlook (−5% to +5% rate range) instead of 2025 decline.
  • Cyber premiums forecast to rise ~15%.
  • Global data breach cost revised to $4.44 million; U.S. average $10.22 million.
  • Ransomware share of claims specified at 19%.
  • SMB cyber recovery cost added at ~$120,000 average.
  • Added FAQ section addressing premium growth and line-of-business shares.
  • Updated references list to newer sources (e.g., Allianz Risk Barometer 2026, AAJ update).

The commercial insurance industry has been evolving rapidly, driven by a combination of economic factors, emerging risks, and technological advancements. As businesses worldwide face more complex risks, commercial insurance has become an essential tool to safeguard against potential financial losses.

From protecting small businesses in local markets to covering global corporations, the industry plays a pivotal role in today’s economy. Today, the focus is on how the market will continue to grow, innovate, and adapt to emerging challenges. This article dives deep into the statistics behind this transformation, providing insights that will shape the future of the commercial insurance landscape.

Editor’s Choice

  • Global commercial insurance premiums are projected to reach about $1.4 trillion with overall non-life premium growth of around 2–3%.
  • North America remains the largest commercial insurance region, accounting for around 40%+ of global commercial premiums.
  • Commercial insurance pricing is easing, with global composite commercial rates down by around 4% and property lines seeing declines of up to 8% versus prior-year quarters.
  • Climate and catastrophe exposures continue to pressure property portfolios, with NatCat-related losses keeping catastrophe-exposed lines at rate changes in the mid-single to low-double digits.
  • Over 80% of leading insurers report increased investment in AI, data analytics, and automation to improve underwriting, pricing, and claims efficiency.
  • SMEs and mid-market firms remain a key growth engine in commercial lines, contributing around one-third or more of new business in many developed markets.

Recent Developments

  • Global reinsurance capital reached a record $760 billion in 2025, with total insurance premium growth projected at 2.3% in 2026.
  • Alternative reinsurance capital (ILS and related structures) stands at about $115 billion, accounting for roughly 15% of total dedicated reinsurance capital.
  • Catastrophe bond issuance hit a record $25.6 billion in 2025, with over $7 billion placed in Q4 alone across 27 new deals.
  • Reinsurance treaties for 2026 are forecast to renew with double‑digit rate decreases, assuming no major loss events.​
  • Global insurance premium growth is expected to moderate to about 2% in 2025 and 2.3% in 2026, reflecting softer market conditions.​
  • Alternative capital growth is expected to outpace traditional reinsurance capital again, with ILS remaining the main conduit for new investor funds.

Commercial Insurance Market Size and Growth

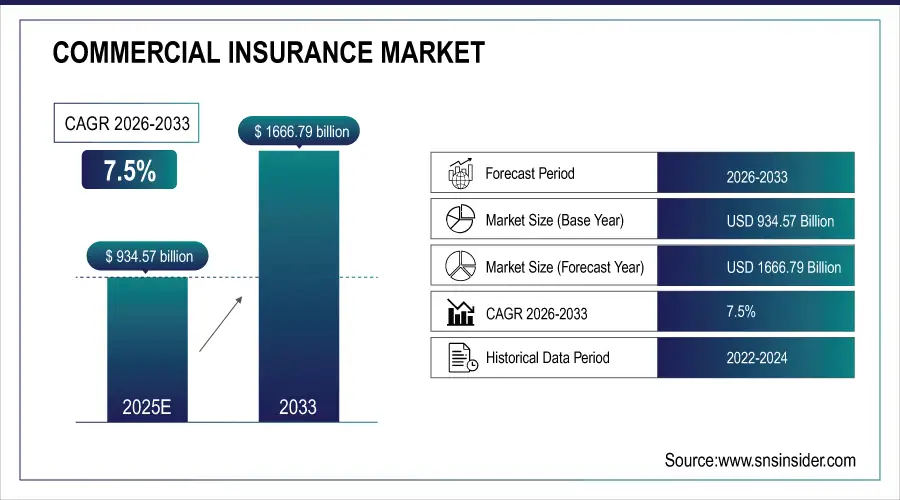
  • The global commercial insurance market is projected to grow at a CAGR of 7.5% between 2026 and 2033.
  • The market size is estimated at $934.57 billion in 2025 (base year).
  • By 2033, the market is forecast to reach approximately $1,666.79 billion.
  • This growth reflects a substantial increase of over $732 billion during the forecast period.
  • The analysis covers a forecast period of 2026–2033.
  • The upward trend indicates strong demand for commercial risk protection, liability coverage, and business insurance solutions worldwide.
Commercial Insurance Market Size And Growth
(Reference: SNS Insider)

Restaurant Business Insurance Trends

  • Top restaurant claim categories are equipment breakdown (17%), employee injuries (12.9%), and slip-and-falls (12.8%).​
  • Cuts comprise 25% of restaurant injury claims with $1,798 average cost.​
  • Fractures are 3% of claims but average $22,837 each.​
  • Restaurants filing claims average a $9,000 loss.​
  • Fine dining claims costs nearly double the average.​
  • Property insurance rates for hospitality up 17%–26%.​
  • Liquor liability monthly premium averages $45.​
  • Hospitality data breaches average cost $3.36 million.​
  • Complete restaurant coverage package costs $4,306 yearly.
Newsletter Img
Don't chase the news. Let us curate it.

You get one weekly briefing with only the stories that matter. If the market is quiet, we skip it.

Read by pros at Visa, Mastercard, Vanguard, and the FDIC.

Business Benefits of Scaling Conversation Intelligence Across the Enterprise

  • Improved analytic efficiency is the top-reported benefit, cited by 41% of organizations.
  • Increased overall business efficiency, including process optimization, is also reported by 41% of enterprises.
  • About 39% of respondents highlight improved data management efficiency as a key advantage.
  • Improved employee productivity is experienced by 38% of organizations adopting enterprise-wide conversation intelligence.
  • Only 26% report achieving seamless integration with existing systems, indicating integration remains a challenge for many firms.
Business Benefits Of Scaling Conversation Intelligence Across The Enterprise
(Reference: Invoca)

Market Share and Competitive Analysis

  • Berkshire Hathaway tops with $1.15 trillion in non-banking assets.​
  • Allianz holds $1.09 trillion in assets, up 6.2%, second globally.​
  • UnitedHealth leads premiums at $309 billion.​
  • Allianz’s net premiums are $90.2 billion.​
  • Berkshire Hathaway premiums are $88.7 billion.​
  • AXA premiums $77.2 billion, growth 6.8%.​
  • Zurich Insurance premiums are $51.5 billion.​
  • Zurich P&C GWP reaches $50.4 billion.​
  • Lloyds of London projected GWP £67.4 billion.​
  • London market premiums forecasted $219 billion.

Median Annual BOP Costs by Retail Profession (Insurance Insights)

  • Convenience stores’ median BOP is $2,208 yearly.​
  • Computer/electronics stores median BOP $1,223 yearly.​
  • Smoke/tobacco/vape shops’ median BOP is $1,140 yearly.​
  • Grocery stores’ median BOP is $990 yearly.​
  • Florists’ median BOP is $876 yearly.​
  • Clothing stores’ median BOP is $870 yearly.​
  • Jewelry stores’ median BOP is $828 yearly.​
  • Pet supply stores’ median BOP is $824 yearly.​
  • Overall retail BOP average $1,136 annually.​
  • Complete retail bundle $2,252 yearly.
Median Annual BOP Insurance Costs by Retail Profession

Small Business Insurance in the U.S. at a Glance

  • Average general liability insurance costs $45/month or $538/year.​
  • The general liability median premium is $500/year.​
  • 47% of eligible SMBs hold cyber insurance policies.​
  • 60% of small businesses close within six months post-breach.​
  • General liability for 1-4 employees averages $1,474/year.​
  • Small group health premiums up median 11%.​
  • U.S. small business insurance market is $150 billion.​
  • Only 50% of small businesses offer health insurance.​
  • Micro businesses (1-9 employees) are the least likely to provide coverage.

Commercial Building Insurance Costs in the UK (By Business Type)

  • Gardening businesses average a £381 annual premium.​
  • Coffee shops average a £377 yearly premium.​
  • Gift shops average £275 per year.​
  • Beauty salons average £264 annually.​
  • Office services are lowest at £238 per year.​
  • Small retail shop or salon £250–£500 yearly.​
  • Office building £350–£750 annually.​
  • Restaurant or café £700–£1,500 per year.​
  • Typical small property £300 for £200k rebuild.​
  • £500k rebuild cost averages £585 yearly.
UK Commercial Building Insurance Costs by Business Type

Types of Small Business Insurance Required by Law

  • Workers’ compensation is mandatory in 49 states.​
  • Texas exempts most employers from workers’ comp mandate.​
  • Commercial auto required in most states for business vehicles.​
  • Disability insurance is required in 5 states: CA, HI, NJ, NY, RI.​
  • Puerto Rico mandates disability insurance for employers.​
  • South Carolina requires $1M liquor liability for on-premise.​
  • Alabama mandates a $100,000 liquor liability minimum.​
  • Oregon requires $300,000 insurance or a bond for alcohol.​
  • 8 states lack Dram Shop laws but need liquor coverage.​
  • Unemployment insurance is required for nearly all U.S. employers.

Casualty: Large Verdicts and Settlements Impact the Market

  • General liability rates rose 5.6% Q4 2025, forecast up to 9% Q1 2026.​
  • Auto liability up 9.2% Q4 2025, expected 7%-15% Q1 2026.​
  • General liability increased 4.4% Q2 2025, many over 10%.​
  • Auto liability surged 14.9%, 36th consecutive quarter up.​
  • Umbrella/excess rates exceed 12%, 25% restructured.​
  • Nuclear verdicts median $24.6 million 2010-2019, up 27.5%.​
  • 83% underwriters see a rising D&O risk environment.​
  • Washington workers’ comp rates up 4.9%, $71/FTE.​
  • Med-legal costs up 30% past 4 years.​
  • Excess liability rates flat to +10% construction.

Cyber Liability: Small Rate Decreases and Emerging Risks

  • Premium rates fluctuate -5% to +5% entering 2026.​
  • Cyber insurance premiums forecast up 15%.​
  • Global average data breach cost $4.44 million.​
  • U.S. average data breach is $10.22 million.​
  • Ransomware 19% of all cyber insurance claims.​
  • Small businesses pay $120,000 average recovery.​
  • 47% small businesses carry cyber coverage.

Frequently Asked Questions (FAQs)

What average annual premium growth for commercial P&C in the past five years?

8% annually.

What share do workers’ comp, property, surety, etc., hold in premiums?

Over 40% of segment premiums.

What commercial P&C premium growth is projected for 2026?

Around 3-4%.

Conclusion

The commercial insurance industry is set to experience significant changes driven by digital transformation, emerging risks, and the evolving regulatory environment. Businesses must stay ahead of these trends, adapting their insurance strategies to manage new risks effectively. With sectors like cyber liability, casualty, and property insurance undergoing rapid shifts, companies are seeking tailored solutions that address their unique needs.

The continued integration of technology, coupled with a focus on sustainability and risk mitigation, will be crucial in shaping the future of commercial insurance. By understanding these key market dynamics, businesses can better prepare for the challenges and opportunities that lie ahead.


This article has been reviewed and fact-checked by Barry Elad. CoinLaw follows strict Publishing Principles and a documented Fact-Check Policy to ensure accuracy, transparency, and editorial independence across all content. Our statistics are verified using a documented Research Process.

Add CoinLaw as a Preferred Source on Google for instant updates! Follow on Google News
Share ChatGPT Perplexity

References

  • Statista
  • Statista
  • American Association for Justice
  • Kiplinger
  • Gallagher
  • Allianz Commercial
Steven Burnett

Steven Burnett

Research Analyst


Steven Burnett has over 15 years of experience across finance, insurance, banking, and compliance-focused industries. Known for his deep research and data analysis skills, Steven transforms complex topics into clear, actionable insights. At CoinLaw, he contributes in-depth articles on financial systems, regulatory trends, and lending practices, helping readers make informed decisions with confidence.

Related Posts

Insurtech Statistics
Insurance

Insurtech Statistics 2026: Explosive Market Growth

Risk Management in Insurance Statistics
Insurance

Risk Management in Insurance Statistics 2026: What the Data Reveals Now

Insurance Industry Statistics 2026: Global Premiums and Growth
Insurance

Insurance Industry Statistics 2026: Global Premiums and Growth

Disclaimer: The content published on CoinLaw is intended solely for informational and educational purposes. It does not constitute financial, legal, or investment advice, nor does it reflect the views or recommendations of CoinLaw regarding the buying, selling, or holding of any assets. All investments carry risk, and you should conduct your own research or consult with a qualified advisor before making any financial decisions. You use the information on this website entirely at your own risk.

Reader Interactions

Leave a Comment Cancel reply

Primary Sidebar

Connect With Us

facebook x linkedin google-news telegram pinterest whatsapp email
google-preferred-source-badge Add as a preferred source on Google

You Should Also Read

Construction Insurance Industry Statistics 2026: Cost Surge Now
Liability Insurance Industry Statistics 2026: Big Trends
UK Insurance Industry Statistics 2026: Growth Data

Table of Contents

  • Editor’s Choice
  • Recent Developments
  • Commercial Insurance Market Size and Growth
  • Restaurant Business Insurance Trends
  • Business Benefits of Scaling Conversation Intelligence Across the Enterprise
  • Market Share and Competitive Analysis
  • Median Annual BOP Costs by Retail Profession (Insurance Insights)
  • Small Business Insurance in the U.S. at a Glance
  • Commercial Building Insurance Costs in the UK (By Business Type)
  • Types of Small Business Insurance Required by Law
  • Casualty: Large Verdicts and Settlements Impact the Market
  • Cyber Liability: Small Rate Decreases and Emerging Risks
  • Frequently Asked Questions (FAQs)
  • Conclusion
Connect on Telegram

Weekly stats quiz Week 45

How much of a crypto geek are you?

5 fast questions from this week's verified market data. About a minute.

Play the quiz New every Monday

Footer

CoinLaw Logo

Bringing Finance Closer to You.

Connect With Us

Follow Us on Google News

Editorial & Trust

  • About
  • Publishing Principles
  • Fact-Check Policy
  • Corrections Policy
  • Ethics Policy
  • Disclaimer
  • Cookie Policy

Worth Checking

  • The Crypto Desk
  • Exchange Listings Tracker
  • Crypto Regulation Tracker
  • Retail Options Trading Stats
  • Banking Customer Retention Stats
  • NFT Market Growth Stats
  • DeFi Market Stats
Contact Us
13570 Grove Dr #189,
Maple Grove, MN 55311,
United States
10 a.m. – 6 p.m. | Every day

Copyright © 2024–2026 CoinLaw. All Rights Reserved. Powered by the HODL Force ❤️

  • Privacy Policy
  • Terms
  • Accessibility Statement
Manage your privacy
We use technologies like cookies to store and/or access device information. We do this to improve browsing experience and to show (non-) personalized ads. Consenting to these technologies will allow us to process data such as browsing behavior or unique IDs on this site. Not consenting or withdrawing consent, may adversely affect certain features and functions.
Functional Always active
The technical storage or access is strictly necessary for the legitimate purpose of enabling the use of a specific service explicitly requested by the subscriber or user, or for the sole purpose of carrying out the transmission of a communication over an electronic communications network.
Preferences
The technical storage or access is necessary for the legitimate purpose of storing preferences that are not requested by the subscriber or user.
Statistics
The technical storage or access that is used exclusively for statistical purposes. The technical storage or access that is used exclusively for anonymous statistical purposes. Without a subpoena, voluntary compliance on the part of your Internet Service Provider, or additional records from a third party, information stored or retrieved for this purpose alone cannot usually be used to identify you.
Marketing
The technical storage or access is required to create user profiles to send advertising, or to track the user on a website or across several websites for similar marketing purposes.
  • Manage options
  • Manage services
  • Manage {vendor_count} vendors
  • Read more about these purposes
Manage options
  • {title}
  • {title}
  • {title}
Manage your privacy
To provide the best experiences, we use technologies like cookies to store and/or access device information. Consenting to these technologies will allow us to process data such as browsing behavior or unique IDs on this site. Not consenting or withdrawing consent, may adversely affect certain features and functions.
Functional Always active
The technical storage or access is strictly necessary for the legitimate purpose of enabling the use of a specific service explicitly requested by the subscriber or user, or for the sole purpose of carrying out the transmission of a communication over an electronic communications network.
Preferences
The technical storage or access is necessary for the legitimate purpose of storing preferences that are not requested by the subscriber or user.
Statistics
The technical storage or access that is used exclusively for statistical purposes. The technical storage or access that is used exclusively for anonymous statistical purposes. Without a subpoena, voluntary compliance on the part of your Internet Service Provider, or additional records from a third party, information stored or retrieved for this purpose alone cannot usually be used to identify you.
Marketing
The technical storage or access is required to create user profiles to send advertising, or to track the user on a website or across several websites for similar marketing purposes.
  • Manage options
  • Manage services
  • Manage {vendor_count} vendors
  • Read more about these purposes
Manage options
  • {title}
  • {title}
  • {title}
Company
  • About Us
  • Our Team
  • Our Mission
  • Core Values
Discover
  • glossary icon
    Glossary
  • Stats
    Stats Research Process
  • Brand Guide Icon
    Brand Assets
Categories
  • Cryptocurrency
  • Payments
  • Investments
  • Banking
  • Finance
Cryptocurrency
Bitcoin Mining by Country Statistics Hashrate Share by Nation
Bitcoin Mining by Country Statistics 2026: Hashrate Share by Nation
Crypto Regulation by Country 2026: Legal Status, Tax and Licensing
Crypto Regulation by Country Statistics 2026: Legal Status, Tax and Licensing
Biggest Crypto Hacks Statistics Ranked by Value Stolen
Biggest Crypto Hacks Statistics 2026: Ranked by Value Stolen
Perpetual Futures Statistics Volume Funding and Leverage
Perpetual Futures Statistics 2026: Volume, Funding and Leverage
Bitcoin Treasury Companies Statistics Holdings and Cost Basis
Bitcoin Treasury Companies Statistics 2026: Holdings and Cost Basis
Prediction Market Statistics Kalshi vs Polymarket Volume
Prediction Market Statistics 2026: Kalshi vs Polymarket Volume
Payments
Remittances By Country Statistics
Remittances by Country Statistics 2026: Inflows and Cost
Cash App vs Zelle Statistics
Cash App vs Zelle Statistics 2026: Speed, Limits and User Data
Venmo vs. PayPal Statistics
Venmo vs PayPal Statistics 2026: Users, Fees and Volume
Toast Statistics 2026: ARR, GPV, Take Rate and Revenue
Rapyd Statistics 2026: Valuation, Revenue and PayU Deal
Marqeta Statistics TPV Revenue Profit and Customer Mix
Marqeta Statistics 2026: TPV, Revenue, Profit and Customer Mix
Investments
Crypto ETF Statistics Net Assets Fees and Flows by Issuer
Crypto ETF Statistics 2026: Net Assets, Fees and Flows by Issuer
Largest Investment Banks Statistics
Largest Investment Banks Statistics 2026: Revenue, League Tables and Headcount
Public vs Robinhood Statistics
Public vs Robinhood Statistics 2026: Users, Assets, and Fees Compared
Robinhood vs Acorns Statistics
Robinhood vs Acorns Statistics 2026: Users, AUM and Fees
Robinhood vs Fidelity Statistics
Robinhood vs Fidelity Statistics 2026: Accounts, AUM, and Fees Compared
Robinhood vs Schwab Statistics
Robinhood vs Schwab Statistics 2026: Users, Assets, Pricing
Banking
Global Systemically Important Banks Statistics
Global Systemically Important Banks Statistics 2026: Bucket Allocation and Capital Surcharges
Bank Failures Statistics
Bank Failures Statistics 2026: FDIC Data, DIF Costs, and Recent Trends
The 15 Largest Banks in the US
The 15 Largest Banks in the US in 2026: By Assets, Deposits, and Branches
N26 Statistics Revenue Profit Customers and BaFin Oversight
N26 Statistics 2026: Revenue, Profit, Customers and BaFin Oversight
Revolut vs Monzo Statistics
Revolut vs Monzo Statistics 2026: Customers & Profit
Islamic Banking Statistics Assets Growth and Top Markets
Islamic Banking Statistics 2026: Assets, Growth, and Top Markets
Finance
Federal Tax Revenue By State Statistics
Federal Tax Revenue by State Statistics 2026: IRS Gross Collections, Top 10 States, Donor vs Recipient
Tariff Revenue Statistics
Tariff Revenue Statistics 2026: Customs Duties and IEEPA Refunds
Emergency Fund Statistics
Emergency Fund Statistics 2026: How Much Americans Have Saved (and How Much They Should)
Financial Advisor Statistics
Financial Advisor Statistics 2026: Headcount, AUM, and Demographics
Wealth Inequality Statistics
Wealth Inequality Statistics 2026: Hidden Wealth Divide
Blockchain In Supply Chain Finance Statistics
Blockchain in Supply Chain Finance Statistics 2026: Trade Breakthrough
Categories
  • Cryptocurrency
  • Fintech
  • Payments
  • Compliance
  • Investments
Cryptocurrency
Kraken And Aave Defi Push
Kraken Parent Payward Buys AAVE Tokens, Deepens Its DeFi Push
Polygon Hard Fork Could Return 6 8 Million in Stolen POL
Polygon Hard Fork Could Return $6.8 Million in Stolen POL
Justin Sun Wlfi Sanction Uae
Justin Sun Seeks Sanctions Against World Liberty Over UAE Ties
1win Token Launched On Solana
1win’s $1WIN Token Goes Live After 15x Oversubscribed Sale
Liquid Network Restores Bitcoin Reserves
Liquid Network Restores Full Bitcoin Backing After $320 Million Exploit
Bitmine 5 983 940 Eth Purchase
Bitmine Adds 8,573 ETH, Nears 5% of Ethereum Supply
Fintech
Google Mpc Crypto Custody Preview
Google Challenges Fireblocks and BitGo With New MPC Crypto Custody Service
Ledger Atom Hardware Wallet Launch
Ledger Unveils Atom Android Wallet Amid Implant Probe
Payward And Saldo Bank Acquisition
Kraken Owner Payward Plans Saldo Bank Purchase: Report
Og Com Cryptostruct Event Contracts
CryptoStruct Opens OG.com Event Contracts to Algo Traders
Bybit Ceo Ben Zhou Keynote October 13
Bybit CEO Ben Zhou Sets Global Livestream Keynote
Pharos Network Realfi Ai Agent Native Upgrade
Pharos Expands RealFi With Powerful AI Agent Upgrade
Payments
Gnosis Pay Confirms Security Breach
Gnosis Pay Confirms Consumer Card Breach Weeks Before Planned Shutdown
Visa And Fireblocks Acquisition Rumours
Fireblocks Denies $2.5 Billion Visa Acquisition Talks
Mastercard Ai Agent Payment Early Access
Mastercard Opens Agent Pay for Machines to Developers
Coinbase Marqeta Stablecoin Cards
Marqeta Taps Coinbase to Power Stablecoin-Backed Cards
Sbi Startale Join Open Standard
SBI, Startale Join Open Standard for JPYSC-OUSD Pilot
Mastercard and BVNK Launch Global Money Platform for Stablecoins
Compliance
Hyperliquid Strategies Cftc Filing
Hyperliquid Strategies Makes Bold Bid for US Futures Trading
Bitget Thailand Ban December
Bitget Faces Dec. 5 Block in Thailand Over Licensing Allegations
Bybit Dubai Vara License Spot Trading
Bybit Wins VARA Approval for Dubai Spot Trading Services
Utah State Sues Kalshi Gambling
Utah Sues Kalshi for Up to $60 Million Over Illegal Wagers
Bingx Eu Mica License
BingX EU Secures MiCA License From Austria’s FMA
Celsius Alex Mashinsky Crypto Ban New York
Alex Mashinsky Hit With Lifetime Ban in New York Celsius Deal
Investments
Okx Investment Ripple Circle Standard Chartered
OKX Raises Strategic Capital at $25 Billion Valuation
Payward And Bny Partnership Crypto Custody
Payward and BNY Explore Strategic Crypto Tie-Up
Strategy Locks Strc Dividend Rate At 12 For October
Strategy Locks STRC Dividend Rate at 12% for October
Cboe S P 500 Options Spx
Cboe and S&P DJI Extend SPX Options Exclusivity to 2051
Ondo Finance Blackrock Tokenized Stock
Ondo Brings BlackRock Portfolios On-Chain in Major Move
Kalshi Eyes 60 Stock Perps
Kalshi Eyes 60 Stock Perps as Leverage Debate Heats Up
Crypto Calculators
  • Crypto Profit Calculator Profit, return and break-even on a trade after fees.
  • APY to APR Converter Convert APR and APY at any compounding frequency.
  • Satoshi to USD Converter Convert sats, BTC and dollars at the live bitcoin price.
  • DCA Calculator Backtest buying crypto every week or month at real past prices.
Finance Calculators
  • Compound Interest Calculator Growth with monthly deposits, or what a goal needs.
  • CD Calculator Interest and maturity value on a certificate of deposit.
  • HELOC Payment Calculator Monthly payments in the draw and repayment periods.
  • Coast FIRE Calculator What you need invested today to stop saving and still retire.
  • Percent Off Calculator Sale price and savings for any percent off.
All 8 Finance Calculators
All 12 tools
Newsletter Img

Too much noise in crypto?

We respect your time. You get one high-impact briefing a week. If the market is quiet, so are we.

Read by pros at Visa, Mastercard, Vanguard, and the FDIC.