In 2017, the crypto world was buzzing with tales of overnight millionaires, thanks to a new funding model called the Initial Coin Offering (ICO). Fast forward to 2025, and ICOs have transformed from a speculative gamble into a more structured, regulated vehicle for blockchain innovation. The wild west days may be gone, but what’s emerged is a more refined ecosystem where investors are savvier, projects are more mature, and data tells a clearer story.
This article walks you through the numbers that shape the ICO landscape in 2025, from market sizes to investor behavior, so you can better understand how this funding model is evolving in real-time.
Key Takeaways
- 1The number of ICOs launched globally in 2025 is estimated at 1,096, showing a rebound after two years of decline.
- 2The DeFi sector dominated ICO fundraising, accounting for 39% of total ICO funds raised in 2025.
- 3Over 54% of ICO investors in 2025 fall within the 25-40 age range, indicating a maturing but still youth-dominated investor base.
- 4The average amount raised per ICO in 2025 stands at $5.4 million, reflecting growing investor confidence.
ICO Fund Allocation Breakdown
- The majority of funds, 75%, are allocated to Development & Operations, highlighting a strong focus on building and maintaining the project infrastructure.
- 15% is reserved for a Legal Contingency Fund, ensuring preparedness for regulatory challenges or legal issues.
- 10% goes to Marketing & Community Outreach, supporting efforts to grow awareness, engage users, and promote the ICO initiative.

Global ICO Market Size and Growth Trends
- The ICO market in 2025 is valued at $38.1 billion.
- This marks the strongest year-on-year growth since 2021, with a 21.7% uptick in global market value.
- North America leads the regional breakdown with $9.3 billion in ICO capital raised in 2025.
- Asia-Pacific follows closely with $8.7 billion, showing notable growth fueled by relaxed regulatory environments in countries like Singapore and Japan.
- Europe accounts for $7.2 billion, driven by sustained activity in blockchain infrastructure projects.
- Africa and the Middle East experienced a 43% year-over-year growth rate, albeit from a smaller base, reaching $1.4 billion in 2025.
- The average token sale duration shortened to 26 days in 2025, showing improved project readiness and marketing efficiency.
- Projects using stablecoins for fundraising grew by 31% in 2025, reflecting increasing preference for volatility resistance.
- Cross-border participation now accounts for 48% of total ICO contributions, highlighting rising global investor integration.
- The top five ICOs in 2025 alone raised over $3.2 billion, led by projects in decentralized identity, AI-integrated DeFi, and real-world asset tokenization.
Number of ICOs Launched Annually
- In 2025, a total of 1,096 ICOs were launched globally.
- The United States hosted 248 ICOs, maintaining its lead despite tighter federal scrutiny.
- Singapore saw 117 new ICOs, bolstered by its favorable tax and compliance structure.
- Germany and Switzerland remain European hotspots with 98 and 84 ICO launches, respectively, in 2025.
- The United Arab Emirates recorded 57 ICOs, driven by regulatory sandbox initiatives in Dubai.
- The gaming and metaverse sectors accounted for 18% of all new ICO launches in 2025.
- The average pre-launch period was 3.5 months, reflecting better funding preparedness.
- About 22% of ICOs in 2025 used launchpads or incubators to reach early-stage backers.
- 43% of all new ICOs in 2025 were launched on Ethereum, followed by Binance Smart Chain with a 21% share.
- The median ICO soft cap was $1.8 million, while the median hard cap rose to $9 million in 2025.
Global ICO Service Market Growth Outlook
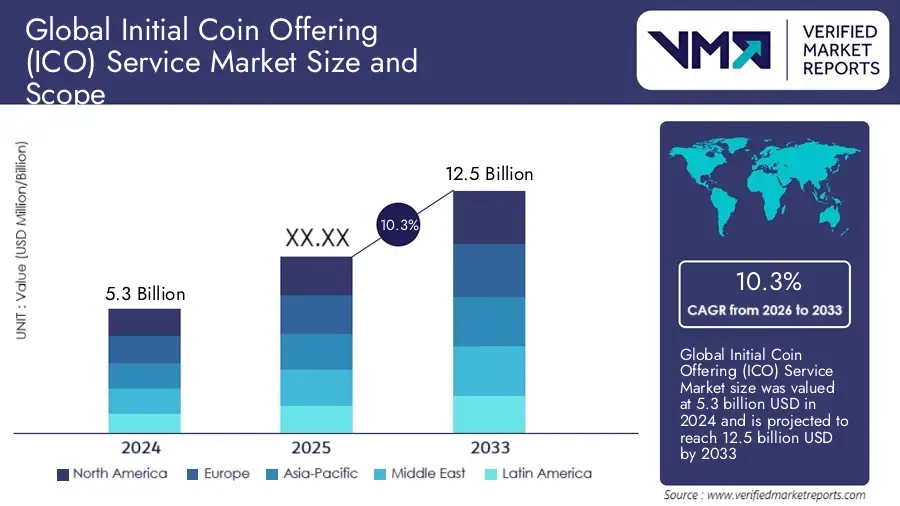
- The global ICO service market was valued at $5.3 billion in 2024.
- It is projected to grow to $12.5 billion by 2033, showing substantial market expansion.
- The market is expected to grow at a 10.3% CAGR from 2026 to 2033.
- Key regional contributors include North America, Europe, Asia-Pacific, the Middle East, and Latin America.
Success Rate of ICOs
- The success rate of ICOs in 2025 climbed to 34.5%, defined as reaching at least 75% of their funding goal.
- DeFi projects posted the highest success rate at 41%, followed by infrastructure projects at 36%.
- NFT-related ICOs saw a lower success rate of 18%, continuing their two-year decline.
- ICOs with KYC verification performed better, with a success rate of 38%, versus 26% for non-KYC projects.
- Projects offering working MVPs or prototypes had a 42.3% success rate in 2025.
- The average token vesting period increased to 14 months, a sign of longer-term investor alignment.
- ICOs using multi-chain deployment strategies saw a 28% higher likelihood of hitting their funding targets.
- Marketing budgets are directly correlated with success; projects spending over $100,000 on marketing had a 47% success rate.
- ICOs that launched community governance models early reported a 37.5% average success rate.
- About 19% of 2025 ICOs exceeded their hard cap targets, especially those in the AI + blockchain integration niche.
Regional Distribution of ICO Projects
- North America hosted 26.4% of all ICOs in 2025, retaining leadership due to institutional participation.
- Asia-Pacific accounted for 24.9%, fueled by regulatory clarity in markets like Singapore and South Korea.
- Europe held 21.7% of all ICO activity, with active ecosystems in Germany, France, and Switzerland.
- The Middle East and North Africa (MENA) region saw the strongest growth, capturing 11.3% of global ICOs.
- Latin America registered 7.5% of the global share, mainly through the tokenization of land and remittances.
- Sub-Saharan Africa maintained a small but stable footprint with 2.6%, led by projects in Nigeria and Kenya.
- Australia hosted 3.2% of ICOs, with a focus on green finance and tokenized commodities.
- The Caribbean, including crypto-friendly jurisdictions like the Bahamas and Cayman Islands, contributed 1.5%.
- Canada showed a regulatory push with 1.8% of global ICOs, especially in asset-backed tokens.
- A cross-border trend emerged, with over 41% of ICO teams distributed across two or more regions.
ICO Projects by Category Breakdown
- Finance leads with 964 ICO projects, showing that the majority of token launches are focused on disrupting traditional financial systems.
- Trading is the second-most popular category with 360 ICO projects, reflecting high demand for crypto exchange platforms and trading tools.
- Payments account for 279 projects, underlining the importance of creating efficient, blockchain-based transaction systems.
- Infrastructure includes 248 ICOs, supporting the growth of platforms, tools, and services that enable the blockchain ecosystem.
- The Internet category features 209 projects, aiming to decentralize web services and create more open digital environments.
- Gaming attracts 203 ICOs, highlighting the rise of blockchain in play-to-earn games and virtual economies.
- Social Network projects total 166, suggesting growing efforts to build decentralized and censorship-resistant platforms.
- Industry (144 projects) and Entertainment (137 projects) round out the list, showing diversified ICO efforts beyond just finance and tech.

Average Funds Raised per ICO
- The average amount raised per ICO in 2025 reached $5.4 million.
- The top 10% of ICOs raised an average of $18.2 million, indicating a widening gap between strong and average projects.
- ICOs offering real utility or ecosystem tokens averaged $6.3 million, outperforming meme and speculative coins.
- Projects launched on Ethereum led with an average fundraising of $6.7 million, while those on Solana averaged $5 million.
- Multi-chain ICOs attracted 22% more capital than single-chain deployments on average.
- ICOs using tiered pricing models raised 18% more than those using fixed token prices.
- Fundraising through stablecoins increased, with 67% of 2025 ICOs accepting USDT, USDC, or DAI.
- ICOs with a strong social media presence and community engagement of over 50K followers raised 30% more on average.
- Projects that published audited smart contracts raised $1.2 million more than their unaudited counterparts.
- The median ICO raise in 2025 is $3.7 million, showing a healthy middle tier in the market.
Investor Demographics in the ICO Market
- Millennials and Gen Z remain dominant, with 54% of ICO investors aged 25-40 in 2025.
- Male investors represent 69% of the market, but female participation is rising steadily, now at 22%.
- Retail investors still make up 61% of contributors, though institutional players represent 19%.
- ICOs drew the most interest from investors in North America (27%), followed by Europe (24%) and Asia (21%).
- Mobile-first investing continues to trend, with 56% of ICO contributions made via smartphone wallets or dApps.
- The average individual investment in 2025 sits at $2,420, showing risk moderation.
- Over 41% of investors in 2025 participated in more than one ICO per year.
- A rising segment of investors (12%) use crypto robo-advisors and aggregation platforms to select ICOs.
- First-time crypto investors accounted for 9% of all ICO contributors this year, often driven by niche sectors like health or AI.
- Investors seeking staking or yield utility from tokens made up 33% of all backers in 2025.
ICO Performance After One Year
- 32.78% of ICOs ended up with a 0.001–0.2x return after one year, the most common performance range.
- 28.37% had returns between 0.2–1x, meaning they lost value but not entirely.
- 23.47% of ICOs managed to return 1–10x, showing moderate success.
- 6.91% achieved a 10–100x return, still rare but notable.
- 6.89% crashed to less than 0.001x, resulting in near-total losses.
- Only 1.44% saw massive growth of 100–10,000x.
- A tiny 0.14% hit over 10,000x, representing extreme outliers and exceptional success stories.

Regulatory Landscape Impacting ICOs
- In 2025, 17 countries had full-fledged ICO regulations.
- The U.S. SEC continues to regulate token offerings under securities law, but new proposals allow sandbox exemptions up to $5 million.
- The EU’s MiCA framework, implemented fully in early 2025, provides unified compliance rules across all 27 EU nations.
- Singapore updated its digital assets code in Q1 2025, now requiring real-time audit trail disclosures for token offerings.
- UAE’s Virtual Assets Regulatory Authority (VARA) introduced ICO-specific guidelines, leading to a 46% increase in registrations.
- Switzerland’s FINMA has fast-tracked registration for utility-token ICOs with a review turnaround of 21 days.
- Japan’s FSA now mandates pre-launch smart contract audits, affecting 100% of new ICO filings.
- Regulatory crackdowns in China and India persist, with ICO bans remaining in effect into mid-2025.
- Taxation clarity improved in countries like Canada, Brazil, and South Korea, boosting investor confidence.
- Globally, 63% of ICOs in 2025 adhered to at least one regulatory compliance framework.
Common Causes of ICO Failures
- The overall failure rate of ICOs in 2025 remains high at 65.5%.
- Lack of product-market fit continues to top the list, cited in 43% of failed ICOs.
- Projects with no minimum viable product (MVP) accounted for 38% of total failures.
- Poor tokenomics was identified as a core issue in 27.6% of unsuccessful ICOs.
- Regulatory non-compliance contributed to 14% of failures, especially in markets with evolving legal frameworks.
- Teams lacking prior experience or transparency led to 19% of ICOs failing within six months.
- Projects that failed to secure external audits had a 2.4x higher failure rate.
- Scam allegations were associated with 6.3% of 2025 ICOs.
- ICOs with inadequate marketing and outreach saw a failure rate of 41%, the second-highest driver.
- Token offerings with low liquidity or poor exchange listings struggled post-launch, with 18% becoming inactive within 90 days.
ICO Projects by Blockchain Platform
- Ethereum dominates the ICO landscape, powering 2,879 projects, making it the most widely used platform for token launches.
- Other platforms account for 851 ICOs, showing a long tail of alternative blockchain solutions in use.
- Waves hosts 93 projects, establishing itself as a niche player in the ICO space.
- Binance Chain supports 60 ICOs, benefiting from Binance’s ecosystem and reputation.
- Stellar is used for 42 ICOs, appealing to projects focused on fast and low-cost transactions.
- Tron powers 25 ICOs, mostly entertainment or dApp-related offerings.
- Bitshares, NEM, and Polygon round out the list with 19, 14, and 13 projects, respectively.

Comparison Between ICOs, IEOs, and IDOs
- In 2025, ICOs account for 49% of all token fundraising events, with IEOs (Initial Exchange Offerings) at 32%, and IDOs (Initial DEX Offerings) at 19%.
- IEOs saw the highest average raise per project at $6.2 million, followed by ICOs at $5.4 million, and IDOs at $3.7 million.
- ICOs had the widest range of investor participation, attracting over 72% of retail investors.
- IEOs are preferred by teams seeking centralized exchange backing, with 61% of IEO projects receiving direct listing post-funding.
- IDOs are favored by decentralized community-driven projects, but only 24% hit their soft cap in 2025.
- Projects using KYC/AML protocols were highest among IEOs at 92%, compared to 65% for ICOs and 51% for IDOs.
- The time-to-launch was shortest for IDOs (avg. 2.1 months), while ICOs averaged 3.5 months, and IEOs at 4.2 months due to exchange vetting.
- Scam incidence was lowest in IEOs (below 1%), thanks to exchange due diligence, versus 6.3% in ICOs and 4.9% in IDOs.
- Token liquidity post-launch was strongest for IEOs, with 78% of tokens listed within a week, compared to 62% for ICOs and 41% for IDOs.
Security Concerns and Fraud Incidents in ICOs
- As of 2025, 6.3% of ICOs showed signs of fraud or rug pulls.
- Phishing attacks targeting ICO participants increased by 14.7%, with email being the primary vector.
- Smart contract vulnerabilities were exploited in 11 ICOs in 2025, causing direct financial losses of over $41 million.
- KYC/AML non-compliance remains a loophole in 35% of ICOs, especially those targeting offshore jurisdictions.
- Platforms using third-party wallet integrations had a 2.1x higher chance of breach versus those with native wallets.
- Sybil attacks on ICO whitelist registration increased 22%, affecting a number of IDOs specifically.
- Over 81% of successful ICOs in 2025 performed third-party smart contract audits.
- Projects with bug bounty programs reported 61% fewer incidents post-launch compared to those without.
- Exit scams still occur, with 12 cases recorded in 2025, down from 19 the previous year.
- Investors increasingly use on-chain analysis tools, with over 43% checking token holder distribution before participating.
Official ICO Discussion Platforms Usage
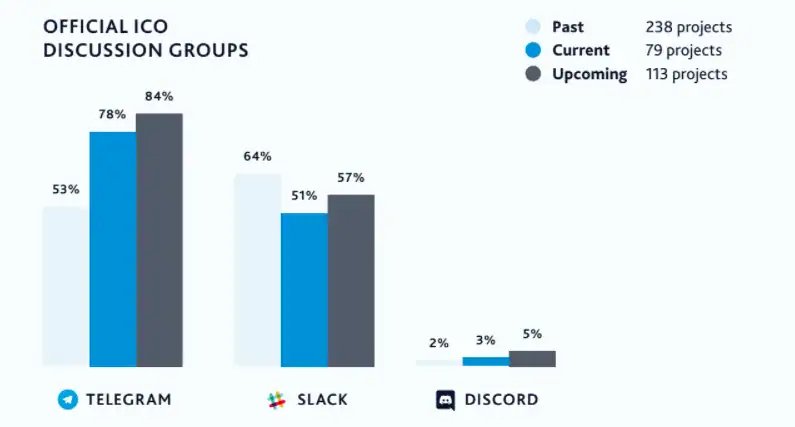
- Telegram is the most used platform, with 84% of upcoming, 78% of current, and 53% of past ICOs hosting groups there.
- Slack usage shows a decline, with 64% of past ICOs using it, dropping to 51% for current ones, and slightly recovering to 57% for upcoming projects.
- Discord remains underutilized, used by only 2% of past, 3% of current, and 5% of upcoming ICOs.
- The dataset includes 238 past, 79 current, and 113 upcoming ICO projects.
Market Share of Top ICO Platforms
- Ethereum continues to dominate, hosting 43% of ICOs in 2025.
- Binance Smart Chain (BSC) holds 21% of ICO activity, especially for DeFi and gaming tokens.
- Solana makes up 13%, benefiting from faster transaction times and low gas fees.
- Polygon saw a rise in adoption, now accounting for 9.5% of ICOs launched this year.
- Newer entrants like Aptos and Sui each host about 2.2% of 2025 ICOs, mostly in Asia.
- Avalanche retained its niche status, hosting 4.1% of total offerings, primarily for interoperable assets.
- Cardano remains limited but hosts 1.3% of ICOs, mostly infrastructure-related.
- Cross-chain deployment tools like LayerZero and Wormhole facilitated 17% of ICOs launching on multiple chains.
- Platforms offering built-in KYC and fundraising tools saw higher adoption, with LaunchpadX and Coinlist seeing a 28% increase in 2025 activity.
Trends in Utility vs. Security Token Offerings
- In 2025, utility tokens represent 71% of all ICOs, with security tokens making up the remaining 29%.
- The security token market doubled year-over-year, now valued at $11.1 billion.
- Real estate-backed tokens represent the largest share of security offerings, accounting for 34% of that segment.
- Utility tokens in the gaming and social media sectors have an average raise of $4.2 million.
- Security tokens are now subject to full regulatory review in 13 countries.
- Tokenized equity and revenue-sharing tokens saw a 56% growth in investor interest.
- ICOs offering hybrid models (both utility and security features) increased to 9.6% in 2025.
- Staking utility is offered in 52% of new utility token projects.
- Governance functionality is now embedded in 48% of utility token smart contracts.
- Stablecoin collateralization is used in 22% of security token offerings to reduce volatility.
Recent Developments in the ICO Ecosystem
- The launch of ERC-7621 in 2025 introduced modular token contracts, streamlining multi-phase fundraising.
- AI-powered tokenomic simulators gained adoption in 11% of new ICOs to forecast investor ROI.
- New regulatory sandboxes opened in Hong Kong, Brazil, and Portugal, welcoming over 110 new projects combined.
- Token launch platforms like Coinlist, Polkastarter, and GameFi Launchpad saw a 35% uptick in project listings.
- Green ICOs tied to carbon offset or sustainability tokens grew 3.6x year-over-year.
- DAO-led ICOs now make up 8.3% of new projects.
- Several Layer 2 chains, including Base and zkSync, hosted ICOs for the first time in 2025.
- Decentralized identity tools (DID) were used in 19% of investor onboarding flows, improving KYC transparency.
- Whale participation (> $50,000) in ICOs rose to 7.1%, reflecting confidence in maturing projects.
- Community voting models for fund allocation were introduced in 14% of ICOs, signaling the rise of democratic treasury management.
Conclusion
The ICO landscape in 2025 has evolved into a more sophisticated and regulated marketplace. While speculative hype has cooled, the maturing ecosystem now emphasizes project fundamentals, investor protections, and long-term value creation. With continued global participation, improved security practices, and an expanding range of token use cases, ICOs remain a vital funding tool in the blockchain economy, just smarter, safer, and more strategic than ever before.


