Gas fees, the cost users pay to execute transactions on blockchains like Ethereum, have moved from pain points to near‑trivial levels in some cases, yet their volatility still causes operational and financial impacts. In decentralized finance (DeFi) platforms, a spike in fees can render a micro‑trade unviable, while in enterprise blockchain usage, unpredictable standing costs force re‑engineering of payment flows. This article explores the key stats behind gas‑fee volatility and invites you to examine detailed sections below.
Editor’s Choice
- 95% drop in average gas fees on Ethereum mainnet after the Dencun upgrade in March 2024, continuing into 2025.
- Ethereum mainnet gas price reached a record low of 0.067 gwei in November 2025, with sustained periods below 0.2 gwei.
- A simple Ethereum swap cost $86 before the Dencun upgrade, but now averages just $0.39 per swap as of November 2025.
- The average Ethereum base‑fee environment is around 2.7 gwei as of October 2025.
- Ethereum mainnet gas limit reached 37.3 million as of July 2025, easing congestion.
- Layer‑2 networks processed over 1.9 million daily transactions in 2025.
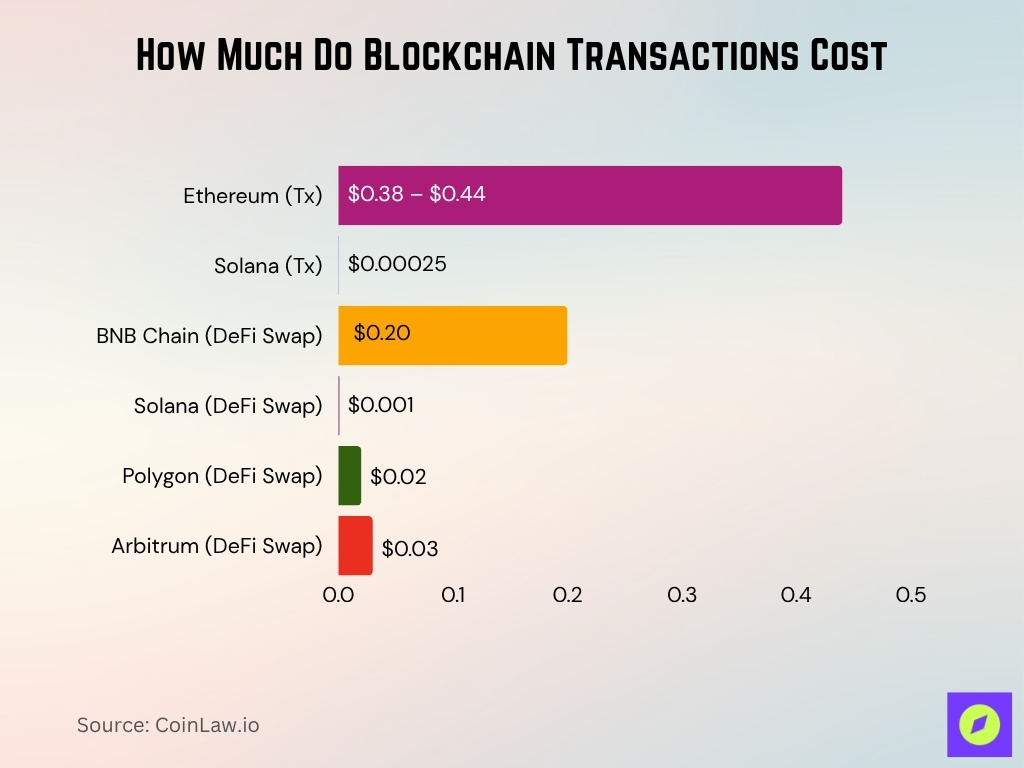
- Ethereum average fees are about $0.38–$0.44 per transaction, while Solana’s are around $0.00025 per transaction.
Recent Developments
- In November 2025, Ethereum gas fees hit a record low of 0.067 gwei during a market slowdown.
- Despite growing on‑chain activity, gas fees remain near historic lows, suggesting improved scalability.
- The Dencun upgrade (March 2024) accelerated fee reductions and enabled Layer‑2 roll‑ups.
- On July 21, 2025, Ethereum’s block gas limit expanded to 37.3 million, boosting throughput.
- Daily transaction count on Ethereum rose from ~1.1 million in April to ~1.4 million in July 2025.
- News outlets flagged ultra‑low fees as a potential warning sign for Ethereum’s long‑term revenue model.
- The average gas price measured in gwei fell from ~72 gwei pre‑upgrade to ~2.7 gwei by October 2025.
Ethereum Gas Fee Snapshot
- Low gas fee was recorded at 0.124 gwei, with a base fee of 0.124 gwei and no priority fee, costing around $0.01 per transaction with a wait time of ~30 seconds.
- Average gas fee remained the same at 0.124 gwei, indicating consistent fee levels during non-congested periods, also costing $0.01 with an estimated processing time of ~30 seconds.
- High gas fee peaked at 0.204 gwei, suggesting a priority fee of ~0.08 gwei, but the transaction cost stayed at $0.01, with no change in execution time (~30 seconds).
- Despite fluctuations in gwei values, Ethereum gas fees have dropped to near-trivial levels of approximately $0.01 per transaction, post-EIP-4844 (Dencun upgrade impact).

Key Factors Driving Gas Fee Volatility
- Network congestion can increase base fees by over 200% during peak transaction periods.
- Complex smart-contract transactions consume up to 5x more gas than simple ETH transfers.
- Layer-2 networks handle >1.9 million daily transactions, reducing mainnet fees under $0.01 per tx.
- EIP-1559 has burned over 1.85 million ETH worth roughly $5.3 billion since its 2021 launch.
- NFT launches caused gas fee spikes, with some transactions hitting 2.6 ETH (~$7,000) per mint.
- Halving gas fees could reduce validator revenue by 50%, affecting network incentives.
- MEV-driven gas wars cause fees to spike by 10-20x beyond normal levels during competition.
- Gas fees drop by up to 30% during off-peak hours in key time zones like the US.
- Geographic user demand cycles from Asia and the US create predictable fee volatility patterns.
- Ethereum mainnet fees averaged around $3.78 per transaction in 2025 amid shifting Layer-2 dynamics.
Impact of Network Congestion on Gas Fees
- During heavy congestion, on‑chain simple transactions have cost users $15–$50+ historically, now they are often <$1.
- In recent months, Ethereum mainnet averages have dropped to ~$0.39 per swap, showing less congestion.
- Gas fee heat‑maps show lower fees during U.S. early‑morning / weekend hours when global traffic is lighter.
- Block‑space increases (e.g., the 37.3 M gas limit) mean each block can include more transactions, reducing backlog.
- When roll‑ups (Layer‑2) carry more volume, mainnet congestion is alleviated, fees drop, but Layer‑2 networks may then absorb spikes.
- During a market flash drop (Oct 2025), fees briefly spiked (~15.9 gwei) then fell back to <1 gwei, illustrating congestion + demand interplay.
- The margin between low congestion ($0.10‑$1) and heavy congestion ($10‑$100) remains substantial, underscoring volatility risk for users.
- Enterprises using smart contracts must plan for worst‑case congestion costs, not just current low averages.
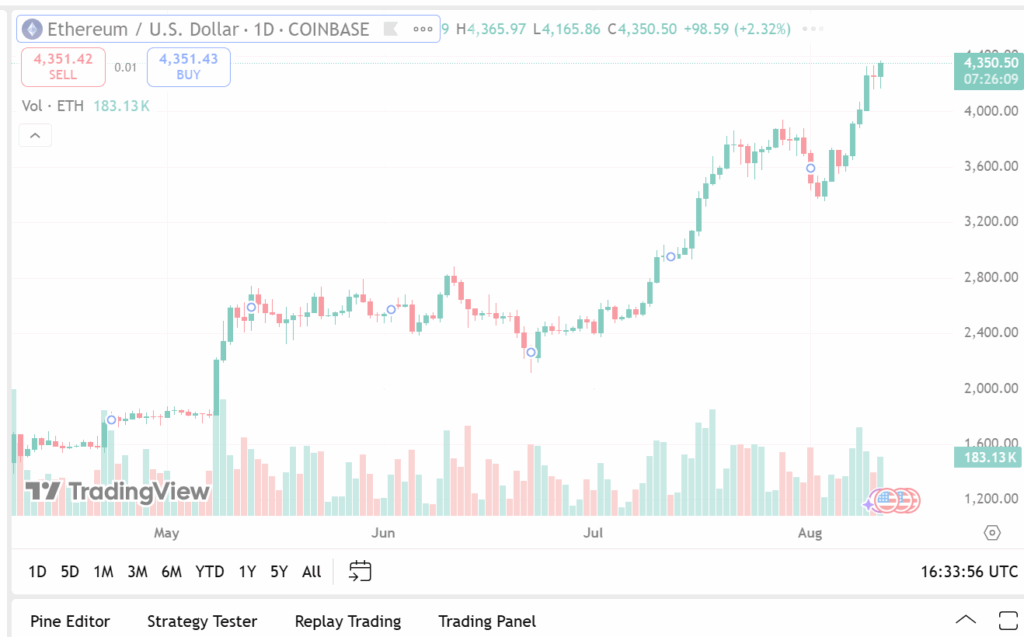
Ethereum Price Surge Snapshot
- Ethereum closed at $4,350.50, marking a daily gain of $98.59 (+2.32%), highlighting bullish momentum.
- The daily high reached $4,365.97, while the low stood at $4,165.86, showing a wide intra-day price swing of $200+.
- Buy and sell prices were nearly identical at $4,351.43 (Buy) and $4,351.42 (Sell), indicating high market liquidity and tight spreads.
- Trading volume hit 183.13K ETH, reflecting strong investor activity and interest at elevated price levels.
- Ethereum has shown a sharp upward trend since mid-June, breaking the $4,000 resistance and continuing toward new highs.
- This price action places Ethereum near its historical peak levels, with momentum suggesting possible breakout scenarios ahead.
Ethereum Price Fluctuations and Gas Fees
- As of Nov 2025, Ethereum (ETH) trades near ~$2,966 after a 17 % drop in a week, showing a volatile underlying asset.
- Historically, when the ETH price spikes, transaction activity rises and gas fees increase; conversely, in downturns, fees tend to fall.
- In 2025, despite ETH’s price swings, average gas fee levels remained low, suggesting scalability outweighed price effects.
- Fee denominated in ETH, for example, a fee of ~0.00012 ETH equated to ~$0.50 when ETH ≈$4,000.
- Major price events trigger on‑chain behavior (e.g., transfers, staking), increasing fee demand and volatility.
- Stablecoin and bridge activity tied to ETH price moves also affect block‑space competition, and hence fee levels.
Influence of Transaction Complexity on Fees
- On Ethereum, a simple ETH transfer (≈ 21,000 gas units) at 20 gwei costs about 0.00042 ETH according to one estimate.
- An ERC‑20 token transfer typically requires 45,000‑65,000 gas units, resulting in about 0.0009‑0.0013 ETH under similar gas‑price assumptions.
- Research shows that interacting with a DeFi smart contract can consume 100,000+ gas units, translating to higher fees, especially during congestion.
- The study of transaction‑fee economics found that transaction complexity (smart‑contract depth) remains a key driver of fee volatility.
- During high‑load periods, complex contract calls push up the base‑fee component by increasing gas usage across blocks.
- The medium August 2025 guide noted a typical Ethereum transaction costing ~$0.44 on average, though complex interactions still ran into several dollars under load.
Gas Fee Volatility Across Major Blockchain Networks
- Ethereum’s average transaction fee is currently around $0.38–$0.44 in late 2025.
- Solana’s average transaction fees were about $0.00025 as of August 2025.
- DeFi swap fees averaged $0.20 on BNB Chain, $0.001 on Solana, $0.02 on Polygon, and $0.03 on Arbitrum in 2025.
- Low-cost blockchains like Solana and Avalanche exhibit less than 5% fee volatility due to high capacity.
- Ethereum fee volatility remains 3-4x higher than alternatives despite a lower average fee.
- Emerging chains may see fee spikes up to 10x during bursts like gaming launches.
- Fee spectrum ranges from sub-cent fees with low volatility to mainnet’s modest fees with higher volatility.
- Polygon’s average fee is stable around $0.02 with occasional spikes during network congestion.
Comparison: Mainnet vs. Layer 2 Gas Fee Volatility
- Layer 2 networks processed over 1.9 million daily transactions in 2025.
- Typical Layer 2 transaction fees remain under $0.01, versus mainnet spikes of $5-$50.
- The Ethereum mainnet average fee was about $3.78 per transaction in 2025.
- Some Layer 2 swap fees spiked above $0.10 during intense DEX activity.
- Layer 2s now earn the majority of fee revenue by volume, surpassing mainnet fees.
- Mainnet fee floor dropped by over 50% but still exhibits sudden cost spikes.
- Layer 2 users experience lower, more stable fees but face new congestion volatility.
- Mainnet holds higher absolute fee volatility compared to generally lower Layer 2 fee volatility.
- Layer 2 volatility is driven mainly by sequencing and high-demand trading events.
- Fee shift to Layer 2 has decreased mainnet congestion frequency by approximately 30%.
Effects of Layer 2 Solutions on Gas Fee Volatility
- Adoption of L2 roll‑ups has eased mainnet backlog, contributing to the drop of average mainnet fee from ~72 gwei in early 2024 to ~2.7 gwei by March 2025 (≈ ‑95%).
- The presence of efficient data‑posting support (e.g., EIP‑4844 blob transactions) lowers L2 cost floors and thus indirectly reduces mainnet volatility.
- L2 networks now dominate large portions of DeFi action, and users executing on L2 therefore face far smaller fee‑shock risk when migrating.
- Some L2 networks still experience volatility. In one dataset, priority fees on busy L2 DEXes spiked to > $0.10 for brief moments.
- MEV dynamics on L2s contribute to fee variation, e.g., block builders paying ~$14 million/month to remain in the first quartile of blocks.
Regulatory Impacts on Gas Fee Volatility
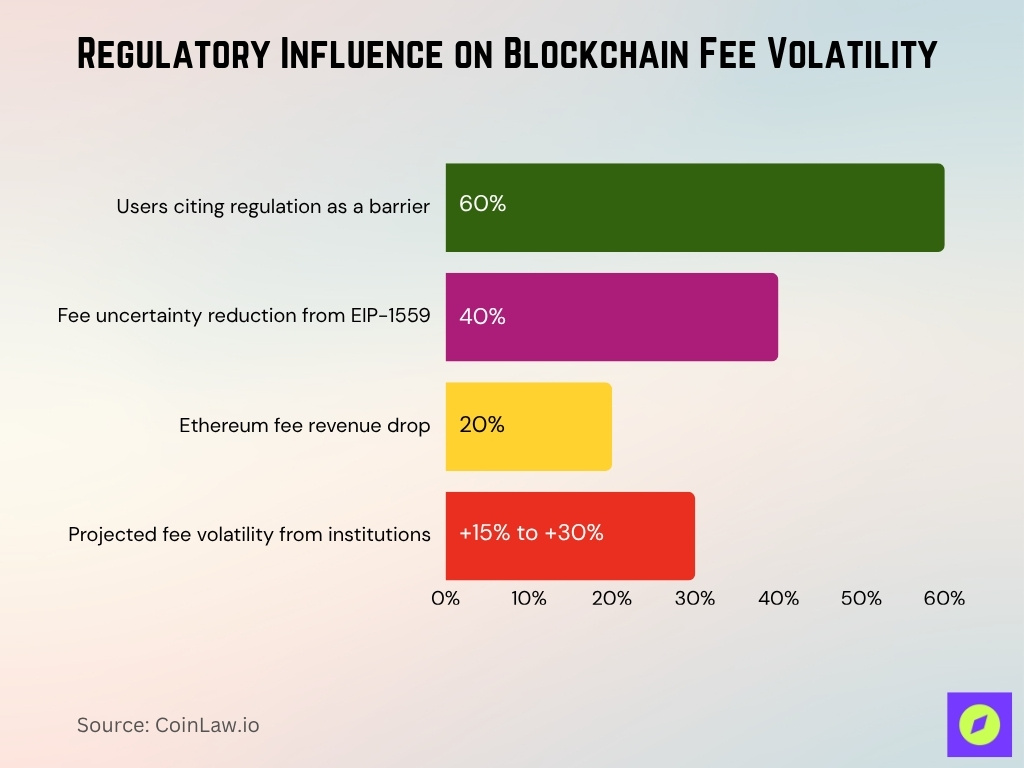
- Around 60% of blockchain users cite regulatory uncertainty as a major participation barrier.
- EIP-1559’s fee-burning mechanism reduced fee uncertainty by approximately 40% but volatility persists.
- Ethereum’s fee revenue dropped by about 20% in 2025, partly due to regulatory-driven activity shifts.
- Institutional demand growth tied to clearer regulations can drive 15-30% higher fee volatility.
Gas Fee Volatility During Major Events (NFT booms, protocol upgrades)
- Post-Dencun upgrade, Ethereum gas costs fell by approximately 95% but volatility persisted during events.
- On Oct 26, 2025, fees dropped to as low as 0.16 gwei (~$0.01) amid 1.6 million daily transactions.
- NFT minting peaks historically drove fees to exceed $100 per transaction.
- Major DeFi launches cause backlog bursts, partially mitigated by block gas limit increases.
- Fee heat maps show 30% lower spike risk during weekends and off-peak hours.
- Protocol upgrades temporarily increase volatility due to node and user behavior shifts.
- Bridge surges like USDC migrations trigger sudden gas fee spikes from demand surges.
- Major events still cause up to 10x fee spikes despite overall lower baseline fees.
Seasonal and Cyclical Patterns in Gas Fees
- Analyses show that Ethereum gas fees are typically 25–40% lower on weekends and during early‑morning hours (10 p.m.–4 a.m. UTC) compared with peak weekday hours.
- In mid‑2025, the median fee for a basic ETH transfer on mainnet dropped to ~$0.67, compared with multi‑dollar levels in prior years.
- Historical studies show weekday peaks in gas price between 7 a.m.–11 a.m. UTC, with troughs late at night or early morning.
- Although overall fee levels have declined, the standard deviation of fees still shows spikes during seasonal events such as major token launches or protocol upgrades.
Gas Fee Volatility and User Behavior
- Scheduling transactions during low-demand windows can reduce fees by 30-40%.
- Layer 2 migration increased by over 25% during fee spike periods in 2025.
- Retry transactions can increase by up to 50% during high gas fee windows.
- Ethereum’s average gas fee fell by 95% from 72 gwei in early 2024 to just 2.7 gwei in March 2025, and currently averages only $0.38 per transaction.
- Cyclical fee-demand feedback loops cause fee volatility swings of up to 20% daily.
- Ultra-low fees lead to micro transactions surging by 15-20%, causing unexpected spikes.
- In Q1 2025, Layer 2 adoption rose by 30%, impacting mainnet fee revenues negatively.
- User gas fee sensitivity leads to 25% fewer transactions during fee peak hours.
- Wallet data shows increased transaction resubmissions correlate with 40% higher fee volatility.
The Role of Decentralized Finance (DeFi) in Gas Fee Volatility
- DeFi protocols consume over 40% of Ethereum block space due to complex operations.
- Median DeFi transaction costs stayed above $5 in 2025 despite simple transfers costing under $1.
- More than 50% of Layer 2 gas usage in some networks is linked to MEV interactions in DeFi.
- DeFi launches cause gas fee spikes up to 3x above baseline during peak activity.
- Ethereum mainnet daily fee revenue dropped from $23 million at peak to about $6.3 million in November 2025, with most activity now shifted onto Layer-2 solutions.
- Gas tip competition in DeFi windows is over 2x more intense than simple token transfers.
- DeFi gas fee volatility remains a significant risk even with generally lower average fees.
- Layer 2 DeFi growth accounted for a 25% reduction in mainnet congestion in 2025.
- DeFi swap transactions often incur fees 5-10x higher than standard ETH transfers.
Technology and Upgrades Affecting Gas Fee Volatility
- The Dencun upgrade cut Ethereum gas fees by approximately 95% from earlier peaks.
- Ethereum’s average gas price dropped to about 2.7 gwei in 2025 from 72 gwei in early 2024.
- The block gas limit increased to 37.3 million in mid-2025, reducing backlog and fee spikes.
- Proto danksharding is projected to decrease volatility by increasing network capacity significantly.
- MEV activities generate around $14 million monthly in payments to miners for priority block inclusion.
- Node software upgrades often cause temporary fee volatility spikes during rollout phases.
- Layer 2 data posting improvements from Dencun enabled more efficient transaction processing.
- Transitional volatility can increase by up to 20% during major protocol upgrades.
- Infrastructure enhancements in 2025 reduced fee spikes by approximately 30%.
Predictions for Future Gas Fee Volatility
- Average Ethereum fees are predicted to stay between sub-$1 and low dollar amounts for normal transfers.
- Fee spikes during major events or DeFi surges may reach $10+ or equivalent in gwei.
- Layer 2 fee volatility is expected to increase as adoption rises, becoming a new volatility frontier.
- User sensitivity to fee changes grows as average fees drop, amplifying fee perception impact by up to 25%.
- Regulatory or macroeconomic shocks could cause sudden gas fee volatility renewals through 2026–2027.
- Future upgrades may lower base fee floors by another 20-30% but won’t eliminate volatility.
Frequently Asked Questions (FAQs)
Approximately $3.78 per transaction.
It fell by about 93%, from ~15.68 gwei one year ago to ~1.069 gwei.
More than 1.9 million daily transactions across L2 networks.
Over 50% of on‑chain gas is on Base and Optimism.
Conclusion
The landscape for blockchain transaction costs has changed markedly; average gas fees on platforms like Ethereum are significantly lower than in previous cycles, and scaling solutions have brought new dynamics to volatility. Yet behind the lower nominal fees lies a persistently volatile framework driven by network congestion, user behaviour, DeFi activity, and event-driven demand. For developers, enterprises, and users alike, the key insight is this: lower baseline fees provide opportunity, but spikes remain a real risk. Understanding when, why, and how fees move helps stakeholders navigate the cost environment with greater confidence.


