Crypto lending and borrowing have evolved from fringe experiments to core pillars of the digital asset economy. Billions of dollars flow daily through platforms where users earn yield or access liquidity by staking or borrowing crypto collateral. Whether in decentralized finance or centralized platforms, these services are reshaping capital flows in crypto markets.
For example, crypto hedge funds now routinely borrow stablecoins or ETH to leverage directional bets; similarly, retail users pledge BTC or ETH as collateral to take out fiat or stablecoin loans. In the sections that follow, we unpack key metrics, trends, and comparative data for crypto lending and borrowing.
Editor’s Choice
- Crypto-collateralized lending expanded by $11.43 billion (27.44%) in Q2 2025 to reach $53.09 billion total market size (CeFi + DeFi + CDP stablecoins).
- At the end of Q1 2025, DeFi lending apps held 45.31% of the crypto collateralized lending market, CeFi platforms had 34.57%, and CDP stablecoins made up 20.12%.
- The total crypto lending market in Q4 2024 stood at $36.5 billion, down 43% from its 2021 peak of $64.4 billion.
- Across DeFi protocols, open borrows reached $19.1 billion in Q4 2024, nearly double the centralized volume of ~$11 billion.
- Tether disclosed $5.5 billion in loans in its Q2 2025 attestation, while platforms like Galaxy and Ledn have limited public lending disclosures.
- As of July 1, 2025, DeFi lending has a Total Value Locked (TVL) of $54.211 billion, with seven-day fees of $74.5 million.
- DeFi’s market share in Q2 2025 rose to 59.83% of lending activity, up from 54.56% in Q1 2025, indicating renewed dominance.
Recent Developments
- In Q2 2025, crypto-collateralized lending expanded to $53.09 billion, a 27.44% increase from Q1.
- DeFi protocols raised their share of total lending to 59.83% by Q2 2025.
- CeFi grew more slowly, and many centralized lenders remain hampered by regulatory pressure and prior scandals.
- Some lending platforms have launched hybrid models combining CeFi capital with on-chain settlement to manage regulatory and liquidity risk.
- The use of tokenized real-world assets (RWA) as collateral is gaining traction. 2024 saw growth from $8.4 billion to $13.5 billion in RWA issuance (excluding stablecoins).
- Upgrades to DeFi protocols (e.g., v3 versions of Aave and Compound) have improved liquidation and risk management efficiency.
- Some CeFi platforms now mint CDP stablecoins internally, blurring boundaries between on-chain and off-chain lending.
- Regulatory scrutiny has intensified globally, particularly in Europe and the U.S., around consumer protection, collateral segregation, and disclosure.
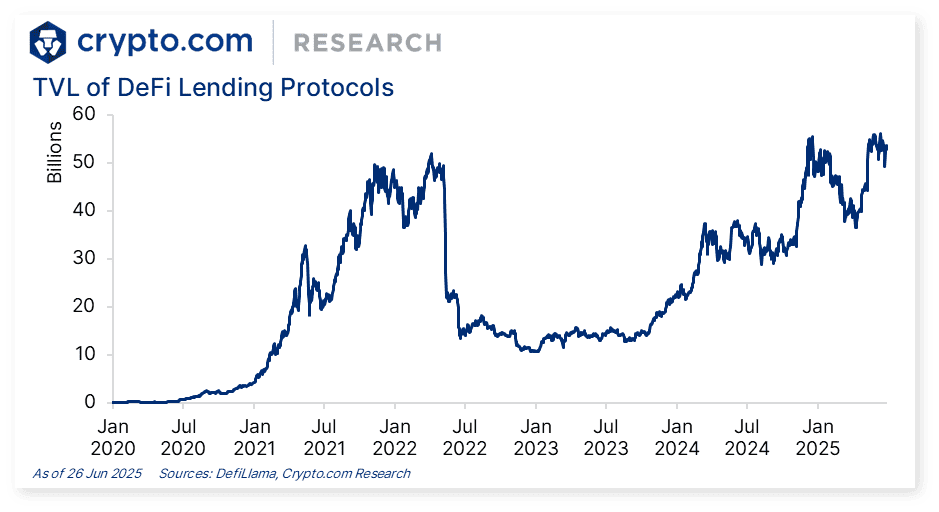
TVL of DeFi Lending Protocols
- In Jan 2020, DeFi lending protocols had almost $0 billion in total value locked (TVL).
- By Jul 2020, TVL rose to about $2 billion, marking the start of rapid adoption.
- In Jan 2021, TVL surged to $15 billion, showing early mainstream momentum.
- By Jul 2021, TVL doubled to around $25 billion, fueled by bull market growth.
- The peak came in Jan 2022, with TVL hitting nearly $45 billion.
- After a major correction, by Jul 2022, TVL fell sharply to $15 billion.
- In Jan 2023, TVL bottomed near $10 billion, reflecting bearish conditions.
- By Jul 2023, TVL stabilized around $12 billion, showing resilience.
- In Jan 2024, TVL rebounded to $25 billion, starting a recovery trend.
- By Jul 2024, TVL climbed to $35 billion, driven by renewed DeFi activity.
- In Jan 2025, TVL reached $50 billion, near its historical highs.
- As of Jun 2025, TVL remains strong at about $48 billion, signaling sustained confidence in DeFi lending.
History of Crypto Lending
- The earliest crypto lending models began roughly in 2017–2018, when users could deposit Bitcoin or stablecoins to earn interest through centralized platforms.
- The rise of MakerDAO circa 2019 pioneered collateralized debt positions (CDPs) and on-chain lending mechanisms.
- By 2020–2021, the bull run fueled explosive growth, and total crypto lending (CeFi + DeFi + CDPs) peaked near $64.4 billion in Q4 2021.
- In 2022–2023, a severe crypto winter, high volatility, and major CeFi failures (e.g., Celsius, Voyager, Three Arrows) caused widespread defaults and platform collapses.
- The market bottomed in Q3 2023 at around $14.2 billion, down ~78% from peak.
- Post-2023, DeFi resurgence drove lending volumes higher, while CeFi has struggled to fully recover.
- Over 2022–2024, DeFi borrowing surged by 959% from its trough to $19.1 billion in Q4 2024.
- The contrast in resilience between decentralized and centralized lenders has reshaped strategies and user confidence within the sector.
Sizing the Crypto Lending Market
- As of Q4 2024, total crypto lending (CeFi + DeFi + CDP stablecoins) reached $36.5 billion, up 157% from the Q3 2023 low.
- That $36.5 billion comprises approximately $11.2 billion CeFi, $19.1 billion DeFi, and $6.2 billion CDP stablecoins.
- Compared to the $64.4 billion peak in Q4 2021, today’s size is 43% lower.
- In Q1 2025, collateralized lending contracted by $2.03 billion (–4.88%) to $39.07 billion.
- In Q2 2025, it rebounded, growing by $11.43 billion (+27.44%) to $53.09 billion.
- DeFi’s share within that Q2 2025 total rose to 59.83%, while CeFi and CDP stablecoins made up smaller portions.
- The TVL in DeFi lending as of July 1, 2025, was $54.211 billion, reflecting broad liquidity depth.
- A caveat: some double-counting exists, as certain CeFi platforms borrow via DeFi and lend off-chain, meaning overlapping volumes.
CeFi vs. DeFi Lending Statistics
- At the end of Q1 2025, DeFi lending apps had 45.31% of the crypto collateralized lending market, CeFi had 34.57%, and CDP stablecoins accounted for 20.12%.
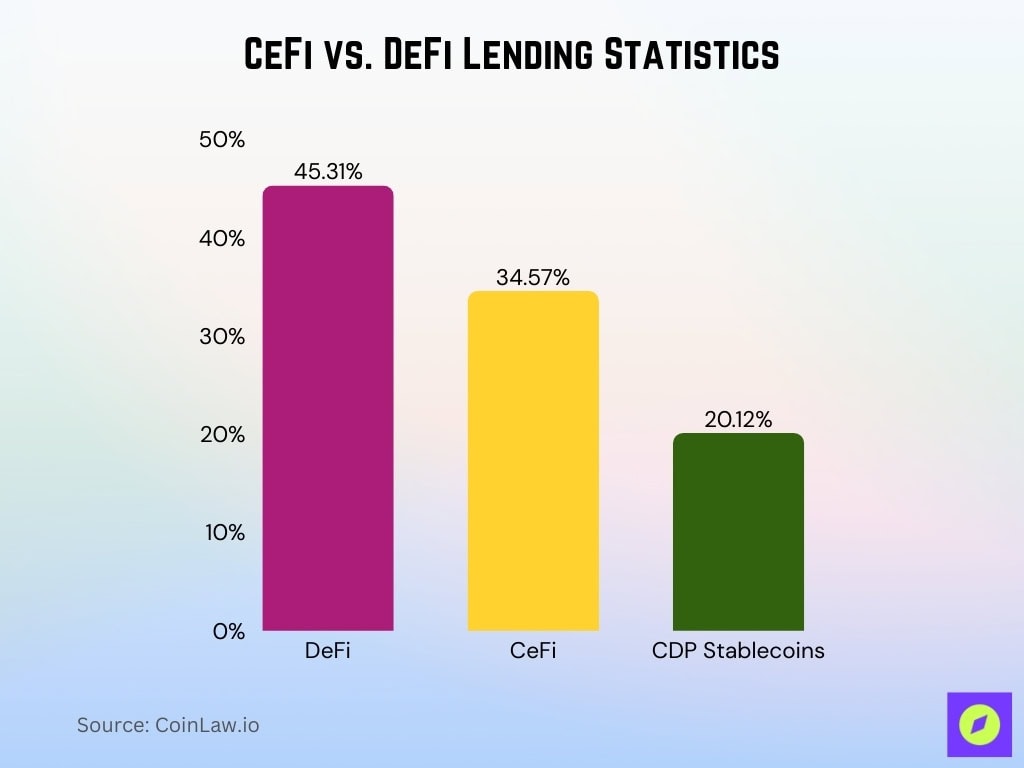
- In Q1 2025, DeFi lending dominance at 56.72% (excluding CDP stablecoins) declined from 64.48% at the end of Q4 2024.
- In Q2 2025, DeFi’s relative share recovered to 59.83% vs CeFi.
- Across protocols, open borrows in DeFi hit $19.1 billion in Q4 2024, nearly double CeFi’s ~$11 billion.
- In CeFi, Tether dominates with ~73% of centralized lending (≈ $8.2 billion).
- The top three CeFi players (Tether, Galaxy, Ledn) command ~89% of the centralized lending market.
- As of July 2025, DeFi TVL (≈ $54.211 billion) greatly exceeds open CeFi borrows (~$11 billion).
- DeFi protocols are investing heavily in upgrades (e.g., v3 mechanistic improvements) for better risk and liquidation handling compared to legacy CeFi models.
Crypto Borrowing Trends
- As of March 31, 2025, open CeFi borrows totaled $13.51 billion, reflecting a 9.24% quarter-over-quarter rise.
- Since the bear-market low in Q4 2023 (≈ $6.65 billion), CeFi borrowing has more than doubled (+103.25%).
- DeFi borrowing (open borrows) in Q4 2024 stood at $19.1 billion, nearly twice the CeFi figure.
- On-chain cryptocurrency collateralized loans grew 42% in Q2 2025 alone, reaching $26.5 billion, a record high.
- Q1 2025 saw DeFi borrowing rebound by ~30% from the earlier in the year slump.
- Ethereum dominates in DeFi lending supply, ~80.97% share as of May 2025.
- Solana held about 5.1% of DeFi deposits (~$2.8 billion) by that date.
- Aave alone increased its TVL in Q2 2025 by 52%, outpacing the broader DeFi growth of ~26%.
- Aave currently claims ~60–62% of the DeFi lending market share.
Loan-to-Value (LTV) Ratios in Crypto Lending
- Industry standard LTVs typically range between 50% and 75%, depending on the asset’s volatility and liquidity.
- For Bitcoin-backed loans, a common LTV is around 50% (borrowers can access ~half the value of their BTC collateral).
- In MakerDAO CDP models, LTVs may go higher depending on risk parameters and collateral type.
- Some platforms impose a haircut (e.g., require collateral > loan × 1.5) to buffer against volatility.
- Adjustments to LTV thresholds are dynamic, shifting with protocol risk metrics, volatility, and coverage ratios.
- Lower-risk collateral (BTC, ETH) often commands higher permissible LTVs; riskier altcoins get stricter limits.
- Some newer DeFi protocols allow adjustable LTV or liquidation buffers to mitigate sudden price swings.
- Across the board, LTVs are central to liquidation risk management and borrower-liquidator incentive design.
Top DeFi Lending Platforms
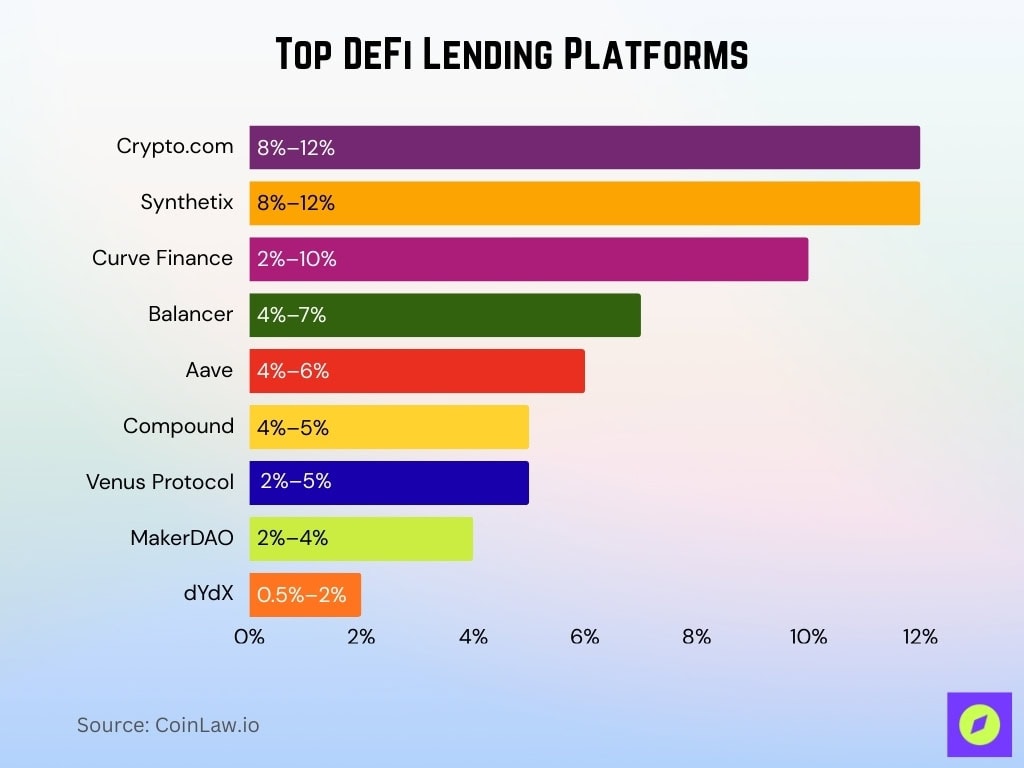
- Crypto.com offers 8–12% APY, supporting Ethereum and Cronos, with assets like BTC, ETH, USDT, USDC, CRO.
- Synthetix provides 8–12% APY on synthetic assets, operating on Ethereum and Optimism, supporting sUSD, sETH, sBTC, SNX, LINK.
- Curve Finance delivers 2–10% APY, focused on stablecoins across Ethereum, Arbitrum, Avalanche, and Fantom, with assets like USDC, USDT, DAI, FRAX, sUSD.
- Balancer yields 4–7% APY, running on Ethereum, Arbitrum, Polygon, with support for ETH, USDC, DAI, WBTC, BAL, LINK.
- Aave offers 4–6% APY, available on Ethereum, Polygon, Arbitrum, Optimism, with tokens like ETH, USDC, DAI, USDT, WBTC, LINK, AAVE.
- Compound provides 4–5% APY on ETH lending, active on Ethereum, Polygon, Arbitrum, Base, supporting ETH, USDC, DAI, WBTC, COMP.
- Venus Protocol yields 2–5% APY on Binance Smart Chain, with assets such as BNB, BUSD, USDT, USDC, VAI.
- MakerDAO offers 2–4% APY, built around the DAI stablecoin, active on Ethereum, Polygon, Optimism, supporting ETH, WBTC, USDC, DAI, LINK.
- dYdX provides 0.5–2% APY, combining lending and perpetual trading on Ethereum and dYdX Chain, supporting ETH, WBTC, USDC, DAI, DYDX.
Interest Rates in Crypto Lending
- Interest rates (annualized) vary widely, often from 2% to 12%, depending on demand, collateral, and platform.
- In bull markets or periods of scarcity, borrowing costs can spike, pushing rates above 15% in niche or high-risk pairs.
- CeFi platforms often set fixed or semi-flexible rates, while DeFi tends to use algorithmic, utilization-based variable rates.
- On Aave, when utilization is high, the interest rate curve steepens, pushing marginal borrowers to pay more.
- To attract capital, platforms sometimes offer subsidized or promotional rates, especially for stablecoins.
- Rate spreads (borrow minus deposit rates) remain key profit drivers for intermediaries.
- Protocol upgrades (v3 versions) aim to optimize rate curves to avoid underutilization or extreme rate swings.
- Market-wide, borrowing demand elasticity has increased; heavy volatility or regulatory shifts push rates more aggressively.
Default and Liquidation Statistics
- On-chain collateralized loans hit $26.5 billion in Q2 2025, with a 42% rise; some portion of that will inevitably face liquidation.
- In a recent DeFi liquidation event, $237 million in collateral was liquidated across 1,222 loans on Aave in one day.
- Core liquidated collateral–debt pairs across major DeFi pools account for about 78% of all liquidated transactions in the studied samples.
- Empirical data from Ethereum shows that auction-based liquidations mitigate sharp price drops by creating competition among liquidators.
- Studies show that newer v3 protocol liquidations correlate with better system stability and less price damage than older v2 designs.
- Across DeFi protocols, many liquidations occur during volatility spikes, capturing undercollateralized debt as collateral gets discounted.
- Some protocols experiment with reversible call options or grace periods to reduce liquidation cascades; one design reduced liquidated collateral by ~89.8% in worst-case tests.
- Historical data (2019–2021) recorded over $807.46 million in collateral sold through liquidations across major protocols.
- The existence and mechanics of liquidation remain a core risk lever for borrowers, platforms, and market health.
Institutional vs. Retail Lending Data
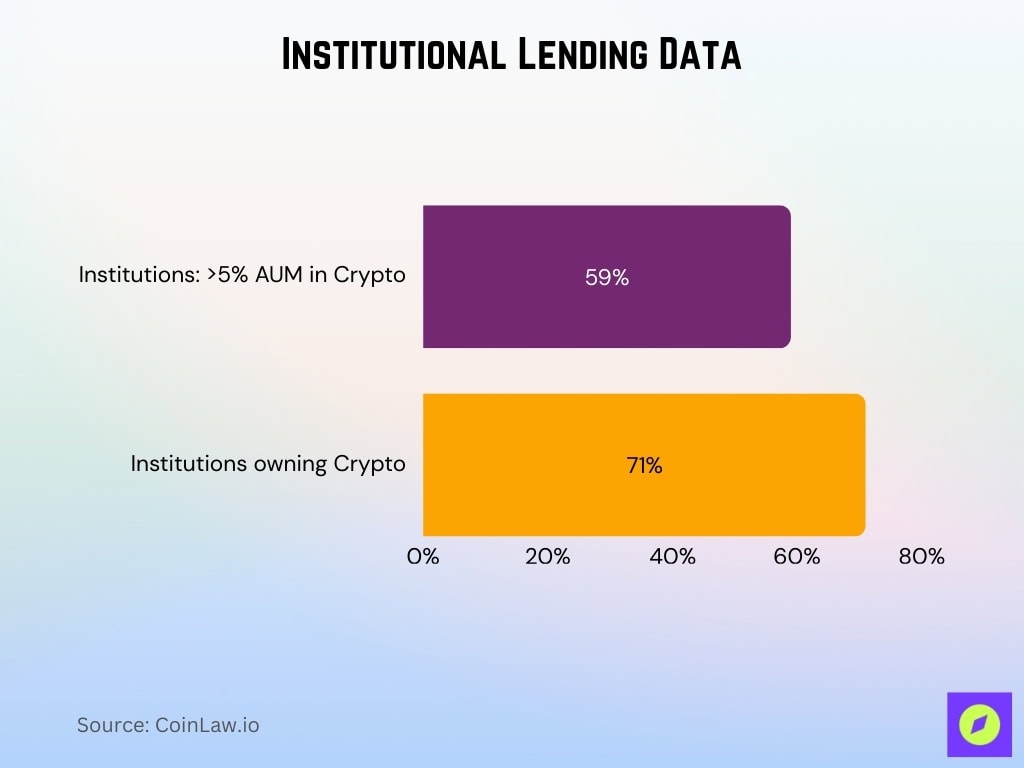
- In 2025, 59% of surveyed institutional investors plan to allocate over 5% of AUM to digital assets.
- ~71% of institutional investors already hold digital assets as of mid-2025.
- Aave’s “Arc” (permissioned institutional lending variant) has only held ~$50,000 in TVL so far, indicating limited institutional deployment.
- In traditional DeFi, retail users supply most liquidity; institutions typically enter through delegated or custodial channels.
- Institutional demand has driven volume in large collateralized credit lines, like $39 billion in BTC-backed institutional loans.
- Retail borrowers tend to take smaller, shorter-duration loans, while institutions negotiate large size, longer tenure, and often bespoke terms.
- Some CeFi platforms are blending retail and institutional pools but segregating risk classes and offering tiered service.
- Institutions demand higher audit, legal, and compliance scrutiny, slowing adoption despite capital appetite.
Regional Adoption of Crypto Lending
- In the 12 months ending June 2025, APAC (Asia-Pacific) recorded a 69% year-over-year increase in on-chain crypto activity, making it the fastest-growing region.
- The U.S. has consistently ranked among the top countries in the Chainalysis Global Adoption Index for crypto activity and adoption.
- India also ranks high in adoption metrics, often trailing the U.S. in per-capita crypto engagement.
- In 2025, North America is among the largest regional markets for crypto lending platform activity.
- European markets show slower growth in crypto lending adoption, often hindered by stricter regulations and belt-and-braces compliance regimes.
- Emerging markets in Latin America and Africa show high grassroots crypto use, but lending adoption remains nascent due to infrastructure and regulatory gaps.
- In Southeast Asia, crypto lending services are growing, particularly in Vietnam, the Philippines, and Thailand, aided by mobile access and unbanked populations.
- Institutional adoption accelerates more in developed markets. EY’s 2025 survey notes that many institutions are increasing allocations to digital assets in the U.S., Europe, and Asia.
- Regulatory regimes differ; some jurisdictions view crypto lending as securities, others as consumer finance, which affects adoption speed regionally.
Crypto Lending Risks and Security Incidents
- Crypto thefts surpassed $2 billion globally in H1 2025, driven by large-scale protocol exploits and phishing attacks.
- The Kroll Cyber Threat team reported ~$1.93 billion in crypto-related thefts in just the first half of 2025.
- Security incident counts fell year over year, but damage per incident rose; fewer breaches, bigger losses.
- According to CoinLaw, security incidents in blockchain dropped in number but spiked in aggregate damages in H1 2025.
- Between 2018 and 2022, DeFi suffered over $3.24 billion in losses from attacks, showing persistent vulnerability trends.
- DeFi protocols often are targeted via oracle manipulation, reentrancy, and flash loan exploit paths.
- Newer designs (v3 protocols) show improved resilience; v3 liquidations correlate with greater system stability vs. v2 versions.
- Some protocols now integrate grace periods or reversible auctions to reduce liquidation cascades; in simulations, one design cut liquidated collateral by ~ 89.8%.
Flash Loans Statistics
- Flash loan volume exceeded $2.1 billion in Q1 2025 across top DeFi protocols such as Aave, dYdX, and Uniswap, with Aave alone processing over $1.5 billion.
- Aave processed over $7.5 billion in flash loans in a span of months in 2025, consolidating its leadership in instantaneous borrowing.
- Flash loans enable no-collateral borrowing, so long as borrowed funds are repaid in the same transaction.
- Flash loan attacks exploit the atomic transaction nature, often combining oracle manipulation or governance exploits.
- The flash-loan bot development ecosystem, covering arbitrage, sandwich bots, and liquidation bots, was estimated at $58.9 million, with projections nearing $65.2 million for 2025.
- Protocols are increasingly designing guard rails (e.g., price constraints, delay thresholds) to detect or block exploitative flash loans.
- Flash loan volume trends show that even during lull periods, arbitrage, liquidation, and sandwich strategies continue to drive activity.
- Flash loan attacks remain among the highest risk vectors because they can execute massive manipulation within single blocks.
- Some advanced defenses (e.g, SecPLF) analyze price state and timestamp constraints to limit oracle exploitation in flash loan contexts.
Stablecoins in Crypto Lending
- As of mid-2025, the stablecoin market cap surpassed $230 billion.
- The U.S. passed the GENIUS Act in July 2025, defining stablecoins as payment instruments and mandating full backing by low-risk assets.
- In 2024, ~63% of illicit crypto flows passed through stablecoins, highlighting their role in dark-finance channels.
- Average interest rates on DeFi stablecoin loans stand near 4.8% annualized.
- Over-collateralization ratios in lending dropped from ~163% in 2024 to ~151% in 2025, indicating more efficient capital use.
- RWA (real-world asset) lending via stablecoins surged to ~$1.9 billion in 2025, often backed by tokenized bills or receivables.
- Stablecoins offer lower volatility and predictable yield environments compared to volatile altcoins, making them preferred in lending markets.
- However, regulatory expectations (reserves, audits, disclosures) now tightly constrain stablecoin issuers.
- Some DeFi protocols permit stablecoin-to-stablecoin lending pools, offering near-stable borrowing costs within stablecoin circles.
Frequently Asked Questions (FAQs)
It increased by $11.43 billion, a 27.44% rise, reaching $53.09 billion in total.
DeFi loans rose by 42.1%, hitting about $26.47 billion in outstanding borrowings.
It shrank by 4.88%, falling by $2.03 billion to $39.07 billion.
71% of institutional investors had allocated capital into digital assets.
It is projected to grow at a 22.6% CAGR over that period.
Conclusion
Crypto lending and borrowing have matured significantly, but the terrain is still volatile. While DeFi leads innovation and share, CeFi and institutional models remain relevant for capital scale. Security risks, flash loan exploits, regulatory shifts, and institutional caution are shaping protocol design and user behavior. The next few years will decide whether crypto credit becomes as robust and trusted as traditional finance or remains a niche frontier. Dive into the full analysis above to chart how these statistics map to real platform strategies and market dynamics.


