In the ever-evolving landscape of the US life insurance industry, millions of Americans rely on these policies to secure their families’ financial future. With the industry witnessing significant changes due to evolving consumer preferences, technology, and economic factors, understanding the latest statistics provides a vital perspective on its current state and future. This 2025 overview dives deep into the trends shaping life insurance in the US, aiming to empower readers with insights into ownership rates, policy details, industry growth, and emerging trends that matter most.
Key Takeaways
- 158% of Americans now report owning at least one life insurance policy, showing consistent national coverage.
- 2In 2025, around 108 million adults in the US remain uninsured or underinsured for life insurance.
- 3As of 2025, 62% of insured Gen Z adults in the US hold permanent life insurance, the highest of any generation.
- 444% of insured adults feel their life insurance coverage is inadequate for future needs.
- 552% of Americans expect to leave behind $10,000 to over $30,000 in unpaid debt to loved ones after death.
Life Insurance Ownership
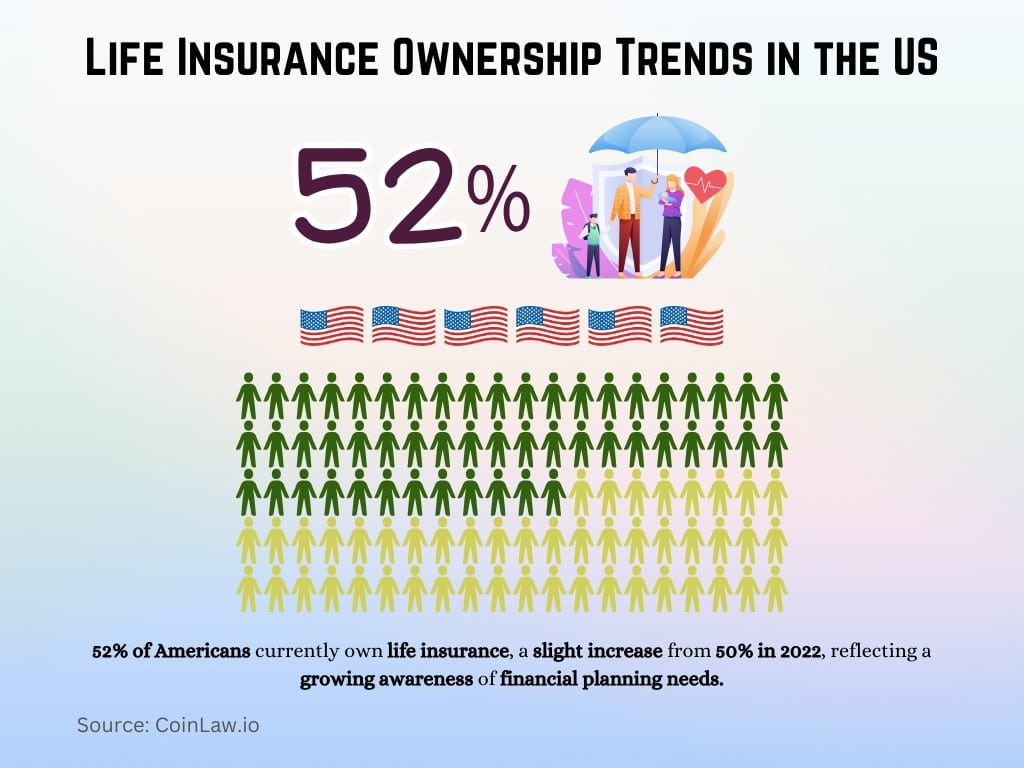
- 52% of Americans currently own life insurance, reflecting a growing awareness of financial planning needs.
- Among those without coverage, 47% cite affordability as the main barrier, while 20% feel they don’t need it due to other investments or savings.
- Millennials (ages 27-42) represent a notable portion of new life insurance buyers, accounting for 30% of policies sold.
- Family responsibilities are a primary motivator, with 74% of parents reporting they purchased life insurance to provide for dependents in case of their absence.
- Employer-sponsored life insurance remains a common source of coverage, with 55% of insured employees relying on workplace benefits for their primary life insurance.
- Awareness of policy features is low; 40% of policyholders admit they’re unclear on the specifics of their policy’s payout and benefits.
- The number of policy lapses decreased by 5% as more policyholders maintained their coverage despite economic challenges.
Life Insurance Policy
- Whole life insurance remains the most common, making up 61% of all individual policies currently in force.
- Term life insurance adoption grew by 8% in 2025, driven by younger buyers seeking affordable short-term coverage.
- Policies with critical illness and long-term care riders rose by 17%, reflecting higher healthcare-related financial risks.
- Guaranteed universal life policies gained 11% growth, as more consumers value premium stability and lifetime coverage.
- The average face amount for US life insurance policies is now $178,000, up from $170,000 in recent years.
- Simplified underwriting policies make up 35% of new policies in 2025, favored for their no-medical-exam convenience.
- The average monthly premium for a healthy 30-year-old non-smoker on a $500,000 20-year term policy is now $26.
Whole Life Insurance Global Market Growth
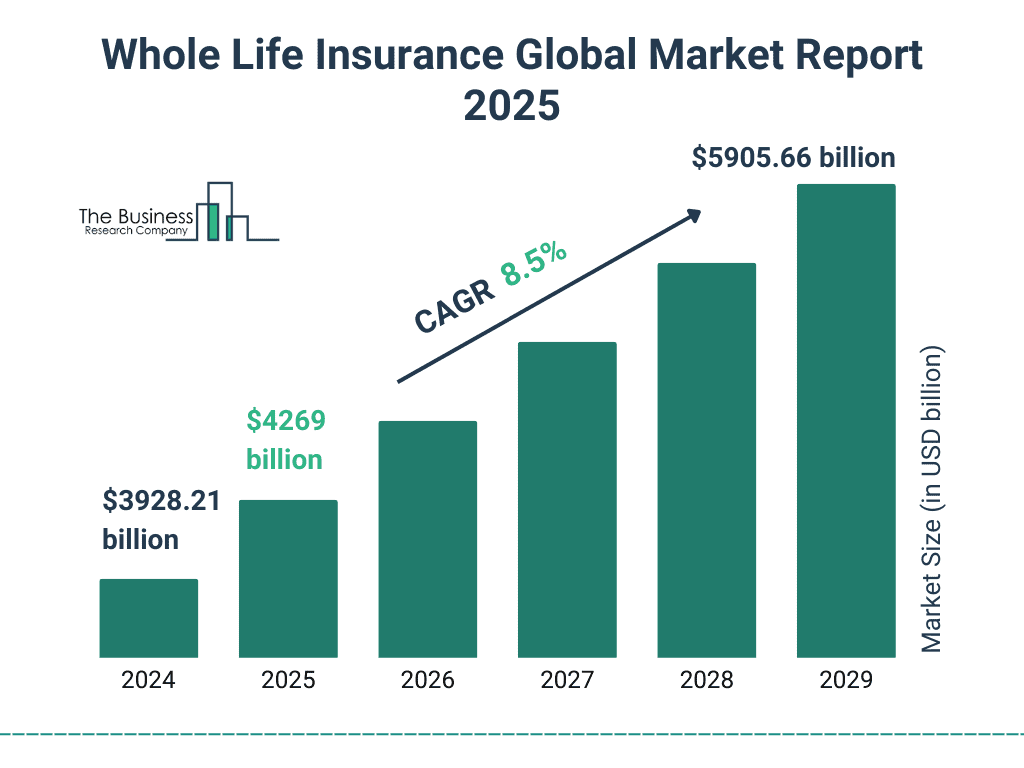
- The global market size for whole life insurance is projected to grow from $3928.21 billion in 2024 to $5905.66 billion by 2029.
- The market is expected to expand at a CAGR of 8.5% over the forecast period.
- In 2025, the market is estimated to reach $4269 billion.
- This steady upward trend highlights increased demand for long-term financial protection and stable investment products globally.
Life Insurance Claims
- In 2025, US life insurers paid out $89 billion in claims, marking a 4% increase from the previous year.
- The average claim processing time is now 9 days.
- 92% of claims were approved and paid out within the same year they were filed.
- $82 billion in death benefits were issued, continuing to provide vital family support.
- 22% rise in accelerated death benefits usage shows growing need among terminally ill policyholders.
- 0.04% of claims were flagged as fraudulent, showing strong verification controls.
- 1% of claims in 2025 were related to COVID, signaling a further decline in pandemic-related payouts.
Life Insurance Ownership by Generation in the U.S.
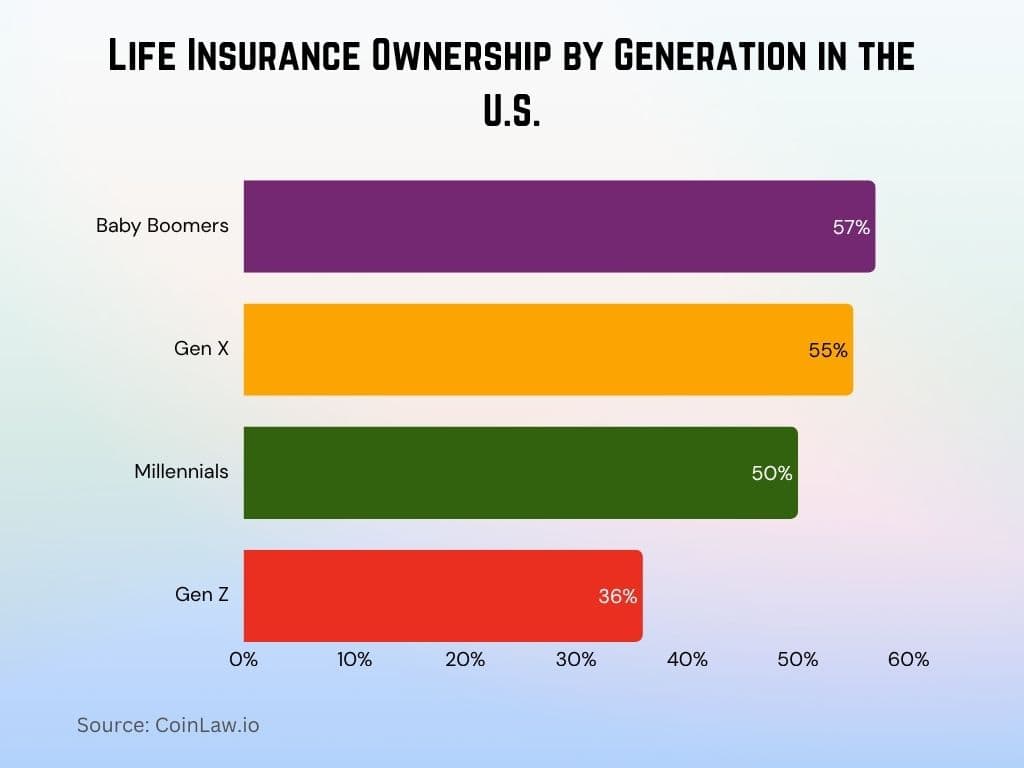
- Baby Boomers have the highest coverage, with 57% holding life insurance.
- Gen X closely follows, with 55% of adults having life insurance.
- 50% of Millennials report owning a life insurance policy.
- Gen Z shows the lowest ownership, with just 36% having life insurance.
Premiums by Line and Market Segmentation
- Term life policies remain the most affordable, with average annual premiums of $200–$300 for a $500,000 20-year term policy for a healthy individual.
- Premiums for whole life insurance averaged $2,500 annually for the same coverage amount, reflecting higher costs due to investment and cash value components.
- Smokers pay nearly 50% more in premiums than non-smokers, with premium rates adjusted based on risk factors.
- Annual premiums for policies purchased by individuals with high-risk health conditions are 35% higher than those for healthier individuals.
- Guaranteed universal life policies experienced a 10% reduction in premiums on average, due to higher market demand and competition.
- Premiums for simplified issue policies are 20% higher than traditional policies because they bypass medical underwriting, increasing risk for insurers.
- The family or joint life insurance market segment grew by 8%, as more couples opted for shared coverage to reduce premiums while providing joint benefits.
Leading Companies and Market Share
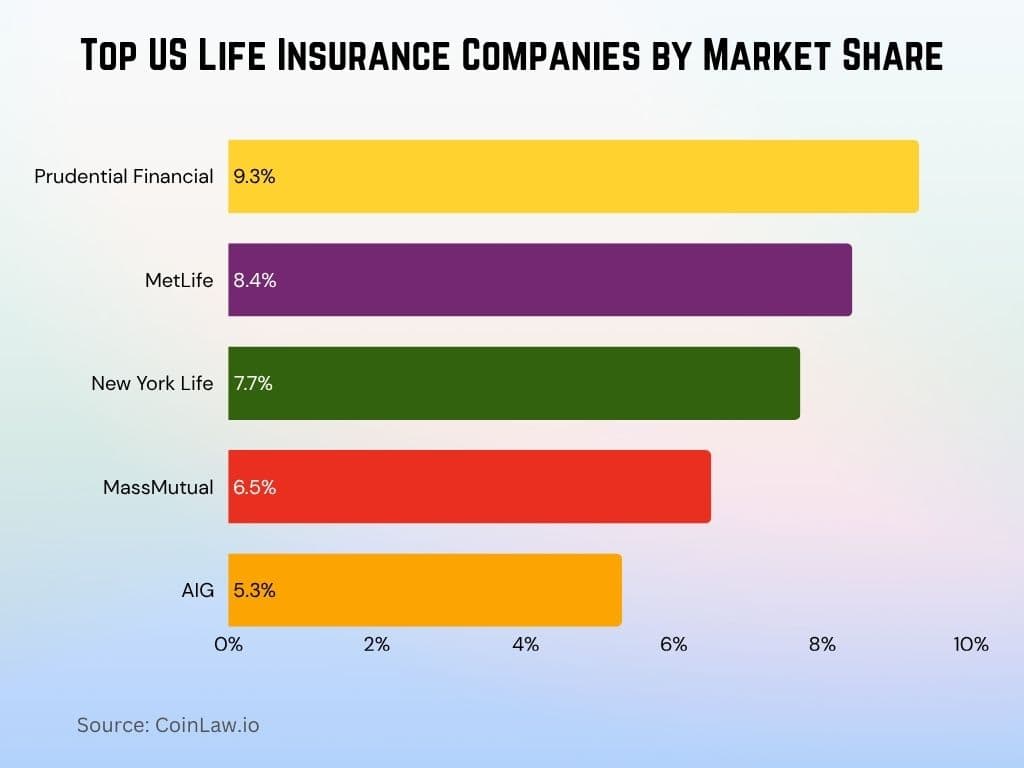
- Prudential Financial leads with 9.3% of the market, maintaining its edge through broad policy offerings and strong brand trust.
- MetLife follows with 8.4% market share, balancing group and individual life insurance growth.
- New York Life holds a solid 7.7% share of the market, supported by its mutual company strength.
- Northwestern Mutual grew to 7.2% market share, driven by demand for whole life and financial planning.
- MassMutual maintains 6.5% of the market, excelling in universal and group life policies.
- Lincoln Financial posted 6.2% growth in 2025, expanding via indexed and universal life products.
- AIG holds 5.3% of the market, focusing on custom solutions for affluent clients.
Financial Impact and Contributions to the Economy
- The US life insurance industry contributes $382 billion to GDP annually, reinforcing its role in national economic growth.
- Life insurers paid out over $89 billion in death benefits in 2025, offering vital support to millions of families.
- $6.3 trillion in invested assets is held by life insurers, much of it allocated to long-term national development.
- 1 in 5 Americans rely on life insurance income, underlining its importance in household financial stability.
- The sector supports over 2.1 million jobs, from advisors to claims processors, helping sustain employment nationwide.
- Life insurers invested over $315 billion in municipal bonds, backing state and local infrastructure efforts.
- The industry contributes around $26 billion in annual tax revenue, supporting public services and development.
Life Insurance Ownership by Salary Multiples
- 24% of Americans have life insurance worth 1x their salary or less.
- 23% own coverage equivalent to 2x their salary.
- 17% have life insurance valued at 3x their salary.
- 10% carry coverage at 4x salary.
- 11% hold policies equal to 5x salary.
- Only 4% have coverage of 6x salary.
- Another 11% have life insurance valued at 7x salary or more.

Adoption of Technology and Insurtech
- Digital policy applications grew by 44% in 2025, driven by demand for faster, mobile-first insurance services.
- Insurers using AI-driven underwriting cut processing times by an average of 33%, improving speed and accuracy.
- Chatbot support expanded by 27% across life insurance platforms, streamlining service and 24/7 assistance.
- Insurtech investments reached $4.3 billion in 2025, underscoring continued innovation in the insurance tech landscape.
- Mobile app usage for policy management increased by 35%, empowering users with real-time access and updates.
- Blockchain technology is now utilized by 18% of insurers for fraud prevention and transparent data handling.
- Telemedicine integration reached 23% of policies requiring health checks, offering flexible, remote assessment options.
U.S. Insurance Companies by Annual Ad Spending
- GEICO leads the industry with a massive $2160 million spent on advertising annually.
- Progressive ranks second, investing $1950 million in ad campaigns.
- State Farm allocates $1170 million each year toward advertising.
- Allstate spends $929 million, rounding out the top four.

Challenges Facing the Industry
- Low interest rates continue to impact profitability, as life insurance companies rely on investment returns to fund payouts.
- The industry faces a growing lapse rate among younger policyholders, with 15% of Millennials lapsing on their policies within the first three years.
- Regulatory changes are creating complexity; 70% of insurers report struggling to keep up with evolving compliance standards.
- Rising medical costs have increased risk factors, causing premiums to rise for health-contingent life insurance products.
- Climate change is beginning to impact underwriting models, with insurers adjusting risk assessments to account for climate-related health risks.
- Cybersecurity threats are a concern for 80% of life insurers, with increasing digital data requiring robust protection.
- Underinsurance remains an issue, with 40% of Americans feeling they do not have enough life insurance coverage to meet their needs.
Recent Developments
- In 2025, approximately 4.2 million Americans will reach the age of 65, the highest number in U.S. history. This demographic shift is expected to significantly impact financial markets, with annuity sales projected to exceed $520 billion, as retirees seek stable income sources.
- Sun Life Financial reported a 9% drop in shares after missing profit expectations and warning of challenges in its U.S. operations. The company experienced higher claims related to severe medical conditions, leading to plans for a 2% increase in insurance prices.
- Legal & General announced the sale of its U.S. life assurance business to Meiji Yasuda, planning to return over £5 billion to shareholders. This strategic move includes Meiji Yasuda acquiring a 20% stake in Legal & General’s U.S. pension risk transfer business.
- U.S. insurance companies are expanding their presence in private credit markets to enhance investment returns. This trend is exemplified by private equity-backed insurers like Apollo’s Athene, which have diversified into various asset classes to offer more competitive annuity products.
Conclusion
The US life insurance industry is navigating a transformative era marked by digital advancements, shifting consumer demographics, and increased focus on financial security. Life insurance continues to provide a cornerstone for financial protection and wealth transfer, adapting to changing demands while maintaining its fundamental role. As the industry addresses challenges like regulatory complexities, low interest rates, and cybersecurity risks, it also embraces technology and innovative solutions to meet the evolving needs of modern policyholders. With sustained growth and the incorporation of ESG investments and tech-forward solutions, life insurance will remain a crucial part of financial planning for future generations.


