The global trade finance industry remains critical to keeping world commerce moving. As cross-border trade volumes shift, driven by geopolitical tension, tariff changes, and supply-chain stress, finance tools such as letters of credit, guarantees, and supply-chain financing help reduce risk and maintain liquidity. Furthermore, in sectors ranging from manufacturing to agribusiness, trade finance enables exporters and importers to manage payment risk, secure working capital, and bridge cash-flow gaps. With that in mind, read on to explore the current data and trends shaping the trade finance landscape.
Editor’s Choice
- The market is forecast to grow to $53.8 billion in 2025, with a compound annual growth rate (CAGR) of 6.1% through 2033.
- In 2024, documentary instruments (such as letters of credit) accounted for 66.3% of the trade finance market by share.
- The supply chain finance market is projected to grow at a CAGR of 8.70% between 2025 and 2034.
- Nearly 70% of banks surveyed in 2025 reported higher trade finance volumes over the past year, signaling a rebound in demand.
- Credit risk remains low: overall default rates in trade, supply chain, and export finance stayed minimal across all regions in 2024.
Recent Developments
- World trade expanded by about 4% in the first half of 2025, with underlying growth at 2.5–3% after adjusting for temporary spikes.
- The market is expected to expand at a CAGR of about 6.1% between 2025 and 2033, taking it from the low $50 billion to over $90 billion by 2033.
- The global trade finance gap has stabilized at $2.5 trillion, highlighting unmet financing needs.
- Default rates in trade finance remain very low, typically below 0.3%, underscoring its status as a lower-risk asset class.
- About 80% of trade transactions now use open account terms, shifting from traditional instruments, but trade finance instruments remain critical for risk mitigation.
Trade Finance Market Overview
- The trade finance market is projected to grow at a CAGR of 3.5% (2026–2035), driven by globalization and increased cross-border trade.
- Market size is expected to rise from $9.97 billion in 2025 to $14.06 billion by 2035.
- Large enterprises account for a dominant 65% share of trade finance demand, reflecting their extensive global trade operations.
- Small and medium enterprises (SMEs) represent the remaining 35%, indicating room for growth if compliance barriers are reduced.
- North America leads regional market share with 35%, supported by a strong presence of institutional players.
- Key market players include DBS Bank, JP Morgan Chase, TD Bank, BNP Paribas, Bank of America, and Wells Fargo.

Trade Finance Transaction Volumes
- It is projected to grow to $53.8 billion in 2025, reflecting rising demand for cross‑border financing as trade recovers.
- Forecasts suggest this market could expand to $91.4 billion by 2033, assuming current growth trends hold.
- Growth is largely driven by rising international trade volumes and increased cross-border trade (goods and services) across both developed and emerging economies.
- Documentary trade finance instruments (e.g., letters of credit) held 66.3% market share in 2024, showing that traditional methods remain dominant in transaction volume.
- Non‑documentary mechanisms (open‑account trade, receivables financing) are growing steadily, projected to expand at a CAGR of 4.53% through 2030.
- Larger enterprises accounted for about 56.6% of trade‑finance volumes in 2024, benefiting from established banking relationships and access to collateral.
- Smaller and mid‑market firms, notably SMEs, are gradually increasing their share via digital platforms, which ease onboarding and permit invoice-level credit scoring.
Letters of Credit and Guarantees Statistics
- As of 2024, documentary instruments, including letters of credit (LCs) and guarantees, made up 66.3% of the global trade‑finance market share.
- The segment’s dominance reflects the value placed on non-payment protection in volatile trading corridors.
- The LC confirmation services market is projected to reach approximately $5.1 billion in 2025, according to niche trade finance market research, underscoring the continued reliance on traditional risk mitigation tools in international transactions.
- That market is expected to grow to approximately $6,078.7 million by 2034, at a projected CAGR of 3.15%.
- Another study estimates worldwide LC‑confirmation demand at $4.38 billion in 2024, with expectations to rise to around $4.57 billion in 2025.
- The increasing global trade volume, especially cross‑border commerce, continues to drive demand for LCs and guarantees as reliable payment mechanisms.
Trade Finance Revenue Share by End Use
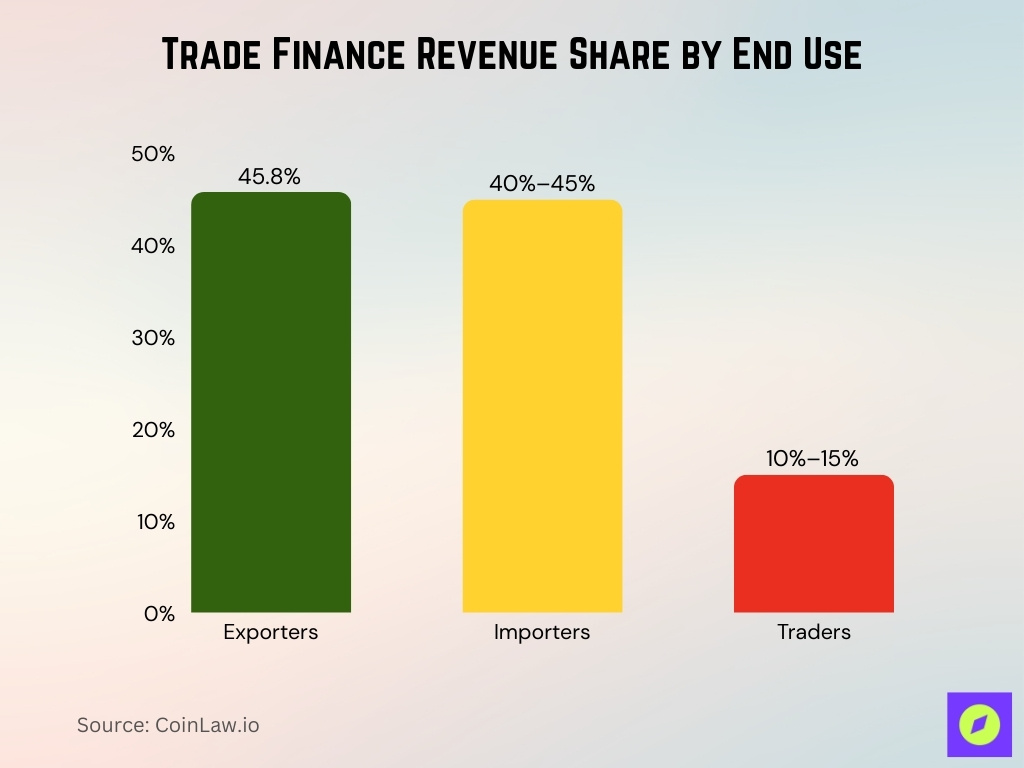
- Exporters account for 45.8% of global trade finance revenue, based on confirmed 2024 study figures.
- Importers hold the largest single segment share, ranging between 40–45%, depending on regional or product breakdowns in 2024–2025.
- Traders make up an estimated 10–15%, reflecting a smaller, specialized slice of the market in most global datasets.

Supply Chain Finance and Receivables Finance Statistics
- The global supply chain finance was about $7.57 billion in 2024 and is projected to grow to roughly $17.43 billion by 2034, implying a CAGR of around 8.7% over 2025–2034.
- The supply chain finance market is projected to grow at a CAGR of 8.7% from 2025 to 2034.
- Market value is expected to reach $17.43 billion by 2034.
- Non-structured financing methods, including receivables discounting, are growing at a CAGR of 5.74%.
- E-invoicing mandates and real-time data have boosted adoption, improving working capital efficiency by over 15% in some firms.
- Over 60% of new factoring contracts are adopted by small and mid-sized enterprises.
- Digital supply chain finance solutions could boost trade by 7.5% in Asia, Africa, and the Middle East by 2030.
- The US reverse factoring market was valued at $34.17 billion in 2023 and is expected to reach $65.12 billion by 2032.
- The receivables finance market grew to approximately $147 billion in 2024 with an expected CAGR of around 11.5% through 2025.
Export Finance and Import Finance Statistics
- Global merchandise trade flows reached an estimated $9–10 trillion+ in recent years, but the trade finance market itself represents a much smaller slice at around $50–51 billion in 2024.
- The market is projected to grow at a CAGR of 3.1% from 2025 to 2034.
- Exporters accounted for approximately 45.8% of global trade finance usage in 2024.
- Import finance demand has risen due to supply-chain complexity and working-capital needs, growing by about 4.2% in 2024–2025.
- Short-term import finance demand increased notably in regions with currency volatility by around 6%.
- Export and import finance providers remain highly valued by over 78% of surveyed trade specialists in 2025.
- Emerging markets contributed to a 7.5% increase in import finance demand in 2024.
- Banks and non-bank lenders expanded export-import finance product offerings by about 12% year-over-year in 2024.
- Asia-Pacific led export finance growth with over 35% market share in 2024.
- Trade finance transactions involving import finance grew by 8% in volume in emerging economies in 2024.
Blockchain and DLT in Trade Finance
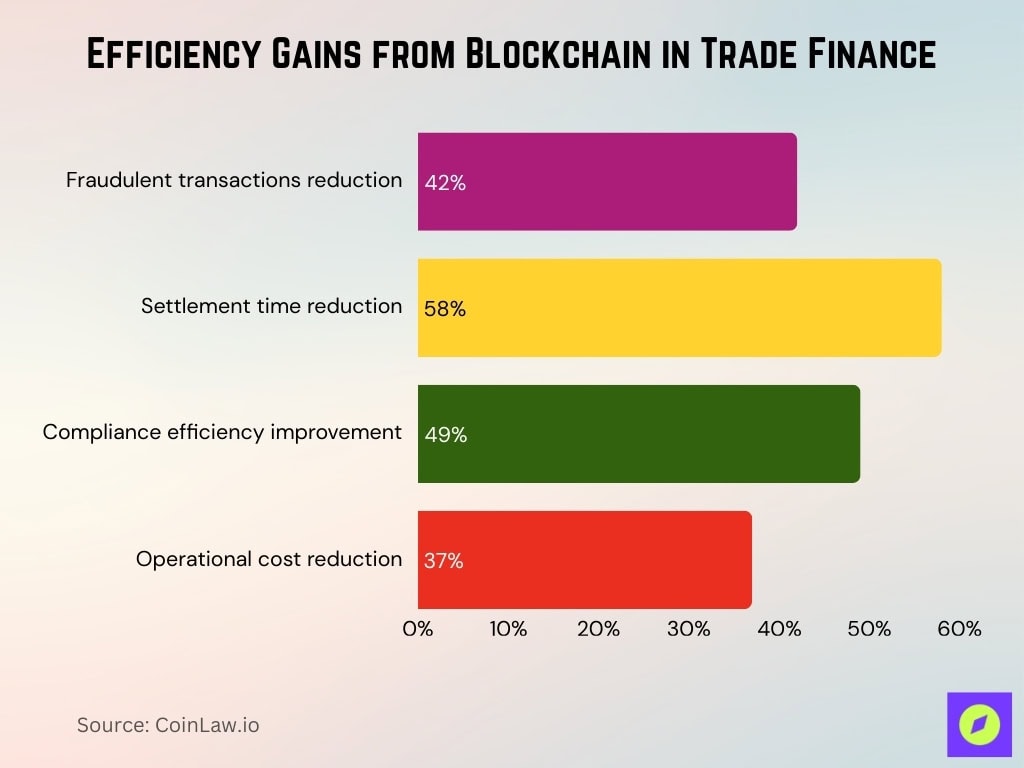
- Institutions using blockchain and DLT saw fraudulent transactions drop by about 42%.
- Settlement times shortened by roughly 58% using blockchain-based systems.
- Compliance efficiency improved by 49% in regulated financial environments using blockchain.
- Operational costs decreased by 37% due to blockchain integration.
- Blockchain adoption helped banks build “dynamic capabilities” like risk detection and faster settlement.
- Global DLT projects are active in Europe, Asia, and North America.
- Blockchain reduces fraud and double‑financing risks.
- Infrastructure gaps, legacy systems, and regulatory uncertainty slow adoption.

Bank vs Non-Bank Market Share in Trade Finance
- Banks still dominate trade finance, accounting for roughly two-thirds of global activity (about 67–68%), while non-bank providers make up the remaining 32–33%.
- Non-bank financial institutions (NBFIs) and fintech providers controlled approximately 32.1% of the market in 2025.
- Over 55% of banks planned to increase spending on trade finance technology in 2025.
- Among banks with increasing investment, 52% preferred in-house development of trade finance tech solutions.
- About 48% of banks opted to partner with external providers for technology solutions.
- Non-bank providers captured rising shares in supply chain finance and receivables finance, growing at a CAGR of 11.77% from 2026 to 2033.
- Traditional banks still dominate large-ticket documentary trade finance with a 66.3% market share in 2024.
- The use of AI and machine learning in trade finance transactions surged by 50% from 2024 to 2025 at banks.
- Non-bank fintechs excel in agility, capturing niche markets with flexible credit models and APIs, forming about $10.84 billion market in 2025.
Digital Trade Finance Adoption Statistics
- 55% of banks plan to increase investment in trade-finance technology platforms over the next 12 months, signaling a clear shift toward modernization.
- AI usage in live trade-finance transactions rose from 32% in 2024 to 45% in 2025, reflecting accelerating automation.
- 18% of banks reported platforms older than 10 years, prompting upgrades and system renewal.
- Digital platforms now enable real-time analytics, improving credit-risk assessments by up to 30%.
- Digital trade finance supports supply-chain resilience for roughly 60% of firms, strengthening operational continuity.
- Non-bank providers continue to lead digital-first receivables and payables financing with a growing 25% market share.
- Market growth powered by digital adoption is positioned to exceed baseline forecasts by 4–6%.
- Digital onboarding reduces paperwork and accelerates credit decisions, cutting SME approval times by 40%.
- Bank deployment of blockchain solutions in trade finance increased by 22% in 2025, highlighting rising trust in distributed systems.
- Cloud-based trade-finance platform usage expanded by 35% globally between 2023 and 2025, underscoring a strong migration to scalable infrastructure.
Impact of Regulations on Trade Finance
- Trade finance default rates remain low at around 0.25% despite regulatory pressures.
- AML, KYC, and sanctions compliance costs increased by 15% for banks in 2025.
- 40% of banks report that high compliance costs limit SME trade finance offerings.
- Regulatory capital charges reduce bank trade finance appetite by nearly 20%.
- Over 50% of emerging-market firms struggle with regulatory documentation burdens.
- Adoption of digital e-bills of lading is projected to reduce compliance times by 30%.
- Development finance institutions (DFIs) increased advocacy for trade finance reforms by 25% in 2025.
- Industry calls for blended regulatory reforms and digital innovation have grown by 18% in trade finance forums.
- Private sector fintech-driven solutions now account for 22% of regulatory compliance innovations.
- Trade finance compliance automation reduces manual review costs by up to 35%.

AI and Data Analytics in Trade Finance
- AI usage in live trade finance rose from 32% in 2024 to 45% in 2025, reflecting broader adoption.
- Decision times in trade finance dropped by up to 35% thanks to AI-driven real-time monitoring.
- Fraud detection accuracy improved 28% with AI-powered systems, enhancing risk management.
- Counterparty risk assessments using AI lowered defaults by approximately 15%, strengthening credit reliability.
- Smart trade platforms featuring AI now see 42% adoption among global banks, signaling growing integration.
- AI-powered solutions increased market responsiveness by 30% in 2025, supporting faster transaction cycles.
- Bundled AI services within trade platforms expanded 50% year-over-year among providers.
- Processing delays fell from an average of 21 days to under 14 days during legacy system replacements using AI.
- SME and mid-size firms gained 40% greater access to AI trade finance tools as digital infrastructure expanded.
- Adoption of AI analytics grew 48% across providers, fostering improved compliance and operational flexibility.
SME Access to Trade Finance and Rejection Rates
- Roughly 50% of trade‑finance requests from SMEs are rejected.
- In emerging markets, fewer than 25% of SMEs have meaningful access to trade finance.
- Structural barriers, like a lack of collateral and high compliance costs, block access.
- SMEs increasingly use invoice-finance and supply-chain financing.
- 40% of formal MSMEs in emerging economies remain credit‑constrained.
- Women‑owned MSMEs face a $1.9 trillion financing gap.
- Many SMEs are shut out of global trade and growth opportunities.
- Alternative lenders are helping close SME trade‑finance gaps.
Trade Finance Gap and Unmet Demand
- The global trade finance gap is $2.5 trillion in 2025.
- That represents 10% of global merchandise trade.
- The gap rose from $1.7 trillion in 2020.
- SMEs face higher rejection rates than large firms.
- The gap is worse in emerging markets with few correspondent banks.
- High trade costs and geopolitical risks increase unmet demand.
- In fragile regions, trade finance shortages affect essential goods.
- Africa’s trade finance shortfall is $80–120 billion annually.
Sustainability-Linked and Green Trade Finance
- Demand for green trade finance rose 22% in 2025 compared to 2024, signaling growing market interest.
- Digital traceability tools enhanced ESG compliance by 35%, supporting responsible trade practices.
- Sustainability-linked documentation unlocked roughly $250 billion in previously restricted financing.
- Around 30% of banks provide preferential financing terms for sustainable trade transactions.
- Standardized ESG documentation for SMEs could boost green trade finance adoption by 40%.
- Over 60% of SMEs report challenges related to ESG reporting and compliance, highlighting adoption barriers.
- Green trade finance supports responsible supply chains in agriculture, representing 28% of total green financing.
- Manufacturing and consumer goods sectors account for 45% of green trade finance volumes.
- Integrated ESG, digital, and finance reforms are expected to expand scalable green financing by up to 50%.
- Global green trade finance is projected to reach $1.2 trillion by 2030, reflecting long-term growth potential.
Top Trade Finance Banks and Providers
- The top 10 global banks oversee over 70% of corporate trade finance volumes, highlighting concentrated control.
- Non-bank providers capture roughly 30% of the SME and digital trade finance market, reflecting growing alternative participation.
- Development finance institutions (DFIs) such as IFC support over 25% of SME trade finance in emerging markets, driving financial inclusion.
- In 2025, 65% of providers invested in digital trade platforms, accelerating modernization.
- Around 40% of banks incorporated ESG terms into trade finance offerings, reflecting sustainability integration.
- Local banks in emerging markets handle 35% of SME trade finance transactions, emphasizing regional significance.
- Providers using modern technology reduce transaction processing time by 50% on average, boosting efficiency.
- Adoption of digital trade finance solutions grew 22% among providers in 2025, supporting broader digital transformation.
- Market diversification contributed to a 15% increase in fintech and non-bank trade finance entrants.
- Top providers emphasizing resilience and speed now manage 80% of the market’s digital trade finance volume.
Frequently Asked Questions (FAQs)
About $2.5 trillion
Expected to reach $95.74 billion by 2030.
By 2033, the supply chain finance market is on track to reach the mid–teens billions of dollars, consistent with projections of around $17.43 billion by 2034 from major market research providers.
Conclusion
The global trade‑finance market remains both critical and under stress. On one hand, trade‑finance instruments continue to enable multinational trade flows, supply‑chain financing, and cross‑border operations with relatively low default rates. On the other hand, a trade‑finance gap, especially affecting SMEs and emerging‑market firms, signals deep structural challenges.
SMEs, often the backbone of economic growth and innovation, still face high rejection rates, limited access, and cumbersome compliance burdens. Regulatory pressures, compliance costs, and risk‑aversion among providers keep many capable small businesses from scaling internationally.


