Layer 2 (L2) networks are reshaping how Ethereum users pay gas fees. We see dramatic compression in transaction costs and shifting behavior across DeFi, gaming, and payments. As an example, Base now earns more daily revenue than many rollups combined.
In practice, DeFi platforms migrate to L2s to reduce swap costs, and NFT projects drop minting onto rollups to keep mint fees under $0.10. Through this article, you’ll get a statistics-driven view of L2 gas fee markets.
Editor’s Choice
- $3.78, average gas fee per Ethereum transaction in 2025 (vs. ~$5.90 in March 2024).
- 70% decline, from peak daily gas revenue (≈ $23 million) to ~$7.5 million in early 2025.
- > 1.9 million, daily transactions processed across L2 networks.
- Base’s $185,291/day, average daily revenue over the last 180 days, surpassing Arbitrum’s ~$55,025/day.
- > $40 billion, total assets secured within L2 rollups as of Q1 2025.
- Over 50% of on-chain gas was consumed by optimistic MEV activity on Base & Optimism in Q1 2025.
- 29.48%, share of blocks constructed “inefficiently” per builder/rollup study after EIP-4844.
Recent Developments
- Ethereum Dencun (March 2024) / EIP-4844 introduced “blobs” to reduce L2 data posting costs drastically, squeezing rollup fees by 50–90% in many cases.
- Base, launched by Coinbase, now captures exceptional revenue, averaging $185,291/day, through high DEX activity and sequencer priority fees.
- Rollups misprice small transactions. A recent study warns that many L2s over- or underprice micro-transactions, which could open DoS or profit-arbitrage risks.
- Optimistic MEV growth, Base, and Optimism saw optimistic MEV consume >50% of on-chain gas in Q1, though these transactions only paid <25% of total gas fees.
- Builder/rollup inefficiency, post-EIP-4844 analysis shows ~29.48% of blocks are sub-optimally constructed, and 72.53% of type-3 transactions overpay.
- Causal feedback loops intensify, transaction fees and economic activity (DEX volume, stablecoin use) influence one another dynamically.
- Mempool prioritization bias, high-fee txs consistently jump ahead, even when not directly more efficient, exposing friction in EIP-1559 design.
- Mainnet congestion spikes, even with L2 offload, occasional surges on Layer 1 still push gas prices up to 100+ gwei (e.g., Feb 2025).
ERCOT Energy Demand from Crypto Mining
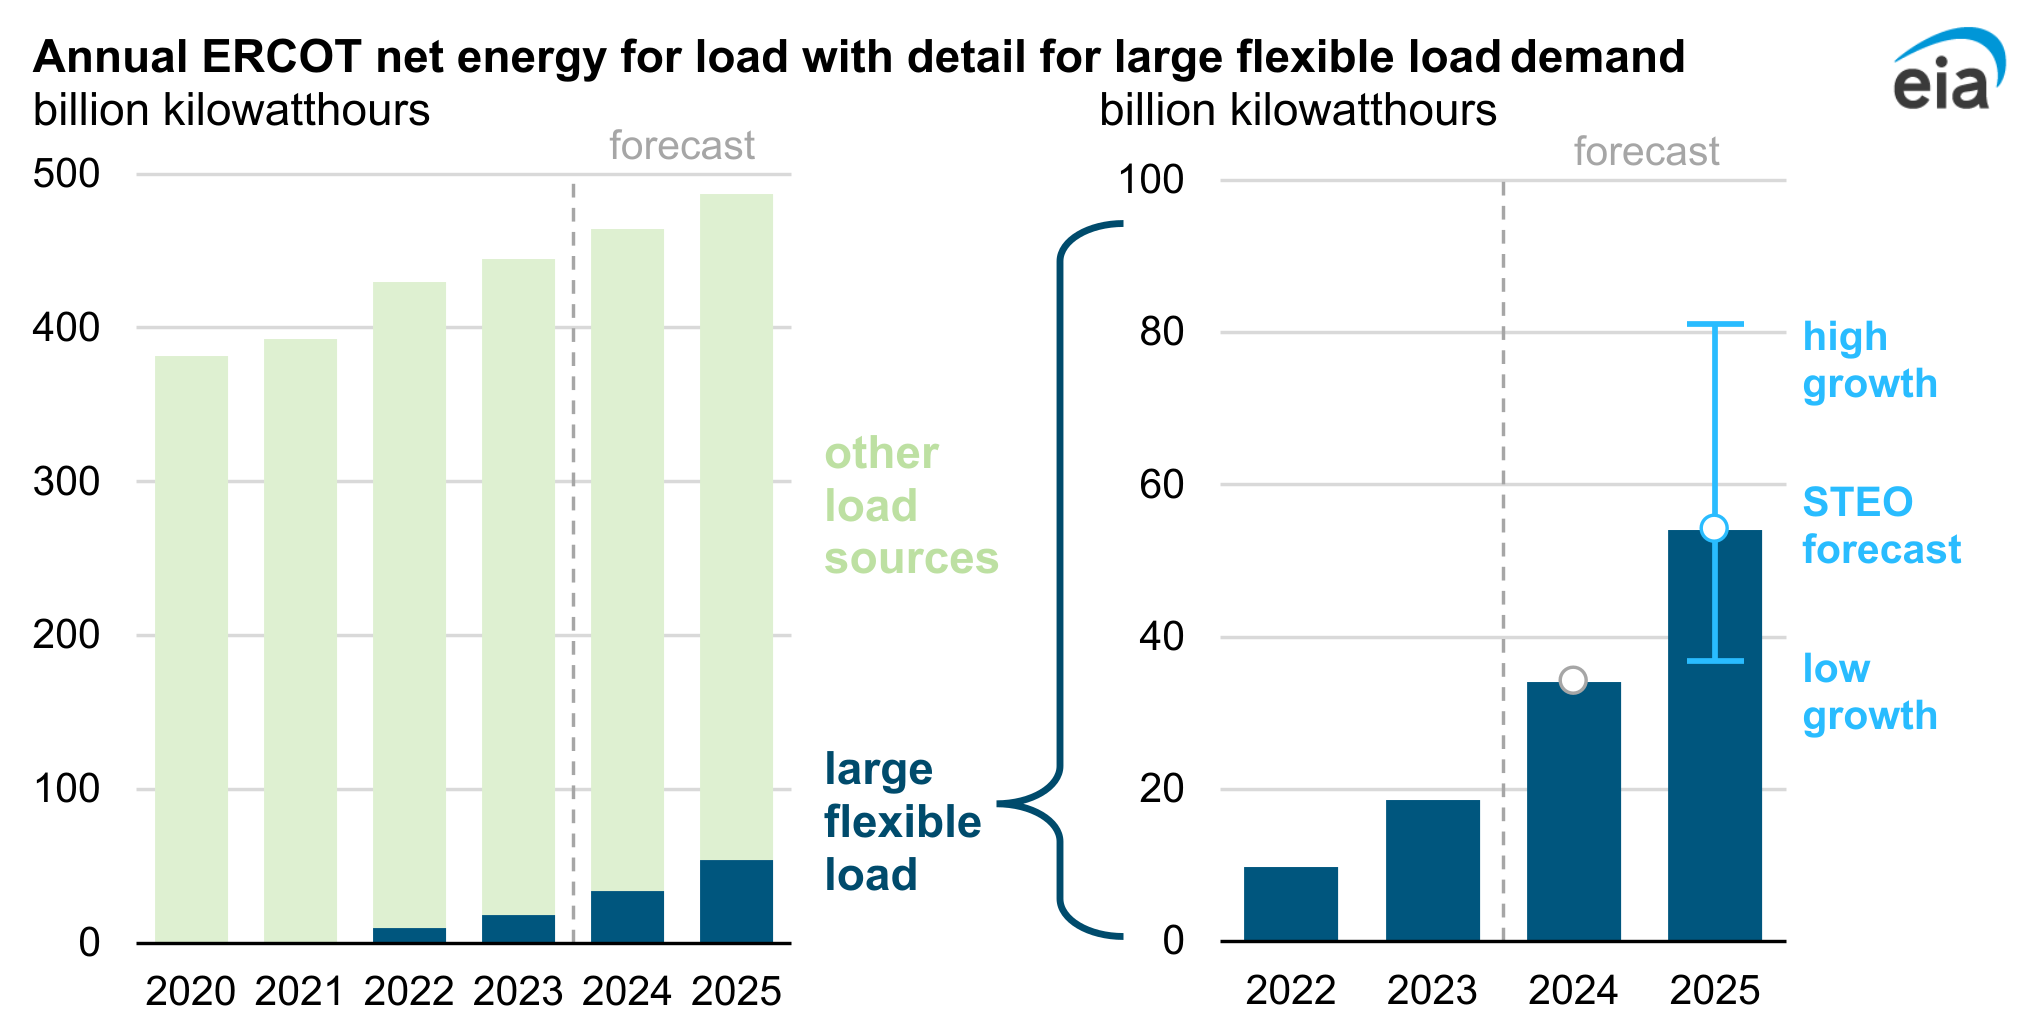
- ERCOT’s total load is projected to grow from ~430 billion kWh in 2022 to nearly 490 billion kWh in 2025.
- Crypto mining and other large flexible loads consumed about 10 billion kWh in 2022, rising sharply to ~18 billion kWh in 2023.
- By 2024, large flexible load demand is forecast to reach ~35 billion kWh, nearly double 2023 levels.
- In 2025, crypto mining demand could hit ~55 billion kWh, with scenarios ranging from 40 billion (low growth) to 80 billion kWh (high growth).
- Large flexible loads could represent over 10% of ERCOT’s total demand growth by 2025, making crypto mining a major driver of electricity consumption.
Overview of Layer 2 Gas Fee Markets
- In 2025, L2 networks collectively handle >1.9 million daily transactions.
- L2s often charge under $0.01 per transaction, contrasted with L1 spikes of $5–$50 under congestion.
- Ethereum mainnet average fees at $3.78 act as a cap; users migrate to L2 when that threshold is breached.
- Rollups must pay L1 data posting fees, forming a base cost for L2 operators.
- Sequencers collect not just base/gas, but priority (tip) fees, shaping ordering competition.
- MEV (Miner/Maximal Extractable Value) is now significant in L2 blocks, altering effective gas costs.
- Gas markets are evolving from fixed per-gas pricing toward multidimensional pricing (computation, data, proof).
- Efficiency depends on both block utilization and ordering strategies more than just gas price.
Types of Layer 2 Solutions
- Optimistic Rollups (e.g., Optimism, Base) assume transactions are valid by default; fraud proofs can reverse malicious ones.
- ZK-Rollups (e.g, zkSync, StarkNet) produce succinct proofs to validate batched transactions, offering faster finality.
- Validium / Volition Hybrids mix L2 off-chain data with on-chain proofs to balance cost and security.
- Sidechains / Commit Chains (less strict security) move data and validation off Ethereum entirely.
- Plasma / State Channels (less common today) enable off-chain transfers with periodic settlement on mainnet.
- Modular L2s decouple data availability from execution, giving flexibility in fee structuring.
- Rollups with “blob” support utilize EIP-4844 to post data more cheaply into Ethereum, lowering data costs.
- Sequencer-based L2s manage ordering internally, which allows them to implement priority fee auctions.
Gas Fees Across Major Blockchains
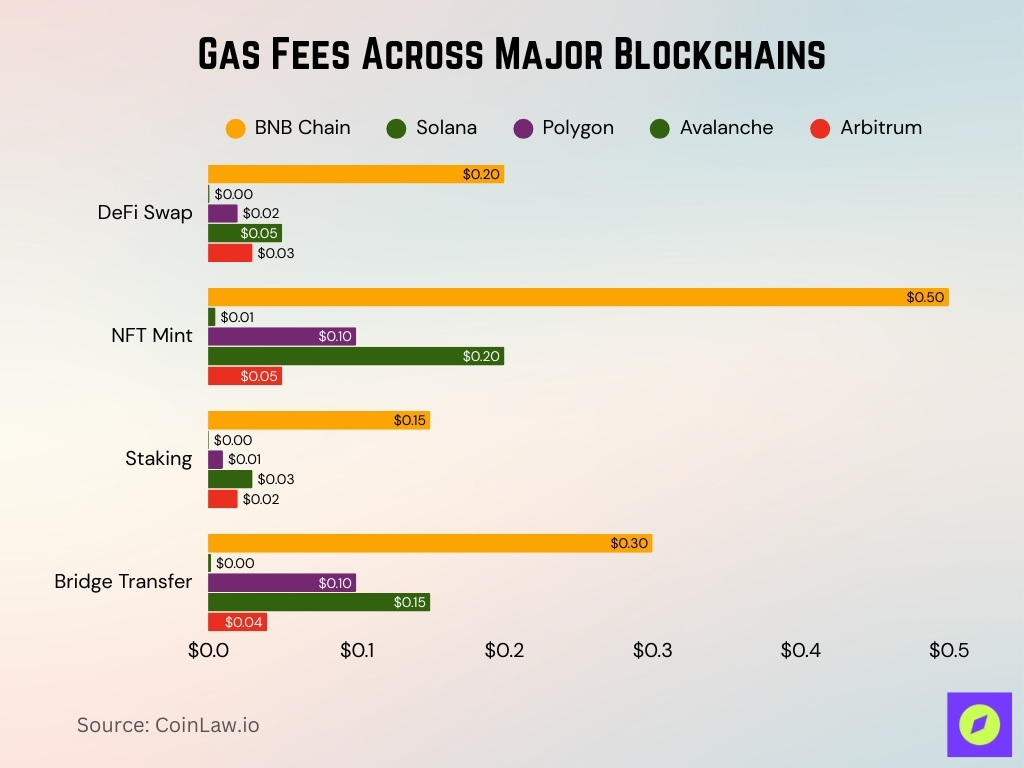
- DeFi Swaps cost $0.20 on BNB Chain, $0.001 on Solana, $0.02 on Polygon, $0.05 on Avalanche, and $0.03 on Arbitrum.
- NFT Minting is $0.50 on BNB Chain, $0.005 on Solana, $0.10 on Polygon, $0.20 on Avalanche, and $0.05 on Arbitrum.
- Staking transactions cost $0.15 on BNB Chain, $0.0005 on Solana, $0.01 on Polygon, $0.03 on Avalanche, and $0.02 on Arbitrum.
- Bridge Transfers are $0.30 on BNB Chain, $0.002 on Solana, $0.10 on Polygon, $0.15 on Avalanche, and $0.04 on Arbitrum.
Comparison of Gas Fees Across Layer 2s
- Base, often charges < $0.01, but sees variable priority fees due to heavy DEX usage.
- Arbitrum/Optimism is still among the largest, with efficient batching and moderate priority fees.
- zkSync/StarkNet includes proof costs, but benefits from lower data posting under EIP-4844.
- Polygon (zkEVM / Hermez), competitive fees, widely used in payments (growth +135% 2024 vs 2023).
- Blast, Mantle (emerging L2s), experiment with minimal fees to attract activity.
- Average L2 tx fee, often under $0.01, sometimes in the cents for complex transactions.
- Fee volatility, priority fees on busy networks can spike briefly to $0.10+ per transaction during high DEX activity.
- Misprice risk for small txs, some L2s overcharge or undercharge micro-transfers.
- Effective cost, including latency, slower inclusion may inflate risk and opportunity cost even if the nominal fee is low.
Major Layer 2 Platforms and Their Fee Structures
- Base (Coinbase’s L2), Average daily revenue around $185,291, with priority fees forming ~86.1% of its revenue.
- Arbitrum’s Timeboost, launched in April 2025, an express ordering feature has generated ~$2 million in fees so far.
- Optimism / OP-stack chains, Similar fee structure to Base (base fee + priority), but smaller user base, so priority fees are less dominant.
- zkSync / StarkNet (zk rollups) incur proof generation costs and more complex verification costs, which can raise the base cost per transaction under heavy load.
- Polygon zkEVM / Hermez, Competitive fees, especially post-EIP-4844, since data posting costs are reduced.
- Emerging L2s (e.g., Blast, Mantle), experiment with near-zero base fees to attract activity, relying more on priority fees or MEV capture.
- Cost stacks by L2, Onchain costs (calldata, blobs, compute, overhead) are visible per user op across L2s.
- L1 submission costs (data posting). These differ per chain depending on how efficiently they compress or use blobs.
- Revenue share vs operator payments. For instance, Base must pay L1 data cost and share revenue with the Optimism Collective before Coinbase retains net earnings.
Priority Fees and Sequencer Revenue
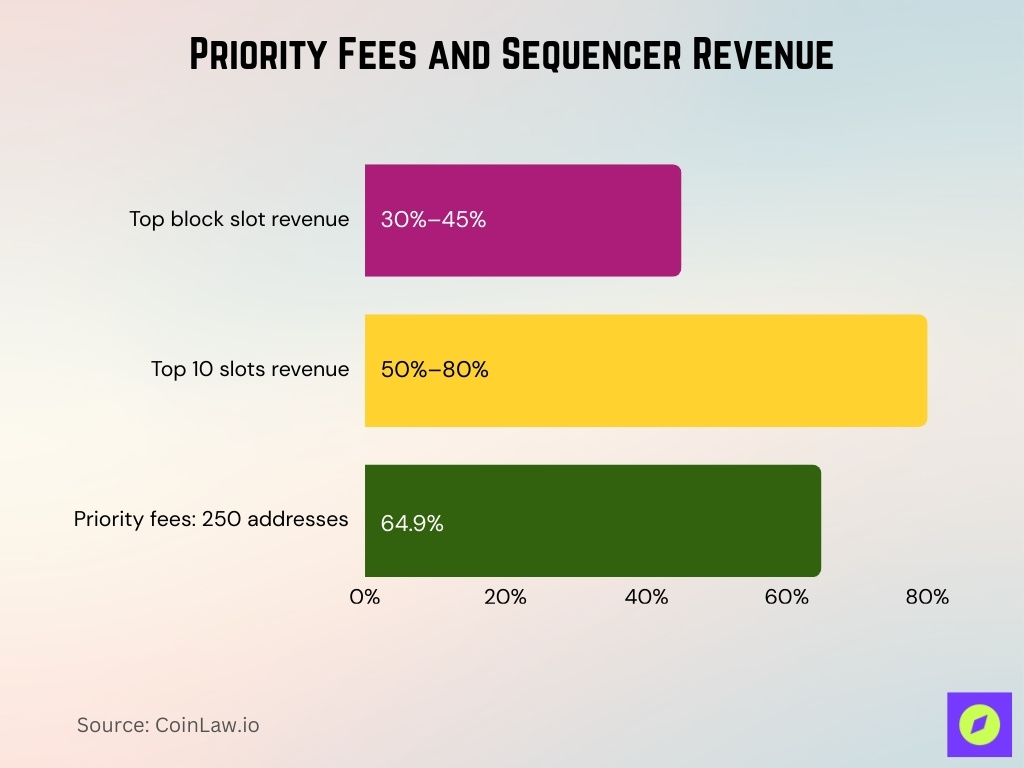
- Transactions in the top slot of each Base block contribute 30%–45% of daily revenue YTD 2025.
- The top 10 slots often contribute 50%–80% of Base’s priority fee revenue.
- A concentrated subset of addresses pays most of the priority fees, ~64.9% of all priority fees on Base came from just 250 addresses in one year.
- On Base, priority fees alone average $156,138/day and constitute ~86.1% of total daily sequencer revenue.
- The top individual address alone paid ~3.6% of all priority fees, or ~$1.99 million.
- On some L2s, priority fee volatility can spike temporarily, with values of $0.10+ per tx appearing during high DEX competition.
- Due to Flashblocks (introduced mid-2025), some high-priority txs land in lower confirmed block slots but still capture premium tip revenues.
- On L2s with weaker demand or less aggressive bidding, priority fees may only contribute a small fraction of sequencer revenue.
Historical Trends in Layer 2 Gas Fees
- In Q1 2025, L2 rollups secured over $40 billion of assets and processed nearly half of Ethereum’s DEX volume.
- Optimistic MEV consumed more than 50% of on-chain gas on Base and Optimism in Q1, but paid under 25% of total fees.
- At the same time, on Arbitrum, optimistic MEV represented just 7% of on-chain gas.
- Ethereum’s average gas fee dropped ~35% to $3.78/tx in 2025 compared to previous periods.
- Daily network gas revenue fell from peaks of ~$23 million down to ~$6.3 million in 2025.
- The decline in L1 fees has shifted gas burden to L2s, making L2 economics more central over time.
- Over 2024–2025, adoption of L2s increased, and more transactions have moved off L1, compressing L2 base fees via competitive pressure.
- Cost structure trends show per-user ops’ on-chain cost components have varied across protocols over time.
- The causal relationship between gas fees and economic activity is bidirectional; fees influence transaction volume, and volume influences fees.
Factors Influencing Layer 2 Gas Fees
- Demand/congestion, when usage surges, both base and priority fees rise.
- MEV and speculative activity. On some L2s, over 50% of gas is consumed by MEV probes, making blockspace persistently contested.
- Sequencer ordering and priority model: How the chain orders high-tip transactions affects how aggressively users must bid.
- L1 data submission cost, because L2s must publish data or proofs to Ethereum, their base cost floor depends on how cheap that is.
- Proof generation/verification cost (for zk rollups), which adds an overhead not present in optimistic rollups.
- Block size/throughput limits: If blocks can’t expand to absorb demand, fees rise.
- Latency/inclusion risk premium: Users may bid more to reduce wait or guarantee inclusion.
- External Ethereum upgrades: These reduce data cost and shift pressure on L2 economics.
- Interdependencies between fees and usage. Studies show DEX volumes, gas fees, and NFT activity influence each other causally.
Impact of DEX Activity on Gas Fees
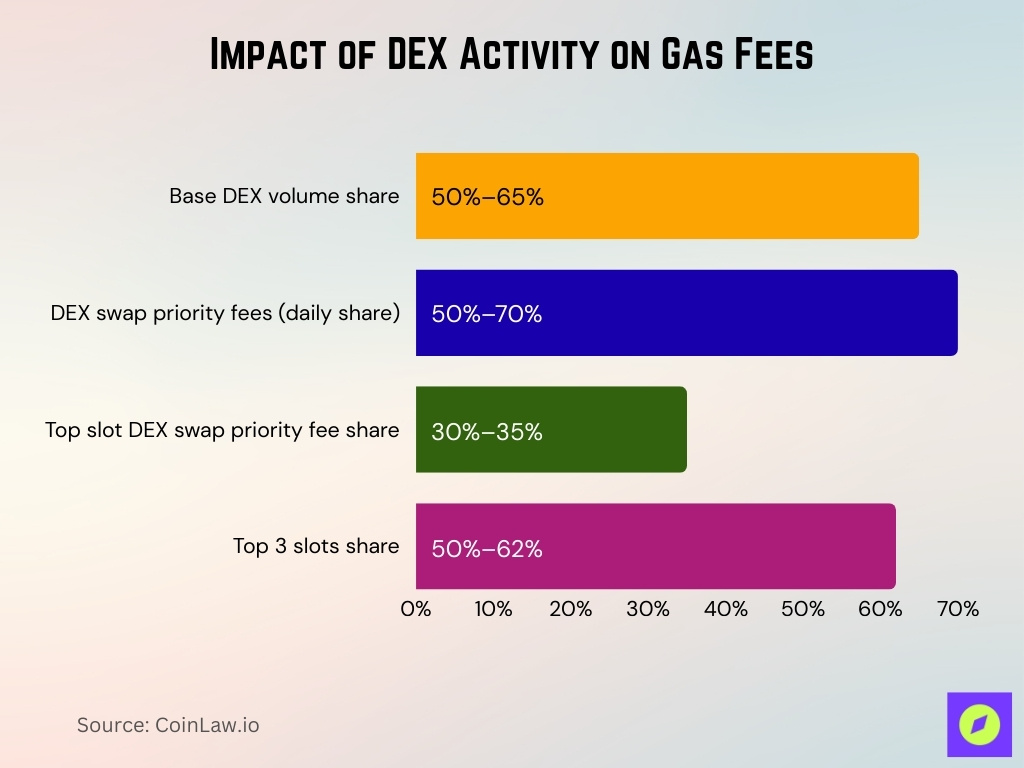
- On Base, DEX activity often accounts for 50% to 65% of total L2 DEX volume across platforms.
- Historically, DEX swap priority fees made up 50%–70% of daily Base sequencer fees; this share has dropped to ~34% in recent weeks.
- DEX swap priority fees in the first slot alone contribute 30%–35% of total priority fees daily.
- DEX swap priority fees from the top three slots contribute 50%–62% of total priority fees.
- Intense DEX usage drives more competition in slot bidding, pushing tip fees upward during peak hours.
- Swaps with urgency (arbitrage, front-running) disproportionately push gas costs upward.
- DEX-driven gas spikes are more volatile than simple transfer activity. During high-volume times, priority fees can dominate.
- On L2s with low DEX demand, gas revenue is more stable but lower overall.
Transaction Batch Processing and Fee Impact
- Batching multiple transactions into one L1 submission spreads the data cost over many users, reducing per-user overhead.
- Post-EIP-4844, data posting via blobs is cheaper, so batch cost per tx has dropped ~50–90% in many cases.
- Some chains adapt batch size dynamically; they may process smaller or larger batches depending on network conditions.
- Larger batches mean more compressibility and lower marginal cost per tx, but batching delay may add risk.
- Overhead accounts for a share of per-user cost; batching helps dilute this overhead.
- Efficient batch construction yields better gas efficiency than naive grouping.
- Poorly constructed batches or wasted slots can raise effective per-transaction cost by 5–20%.
- Some sequencers or bundlers prioritize which txs to include; higher-paying ones get in earlier.
Rollup Technologies: ZK Rollups vs Optimistic Rollups
- Optimistic rollups (e.g., Base, Optimism) assume transactions are valid by default and rely on fraud proofs.
- ZK rollups / zkEVMs (e.g., zkSync, StarkNet) generate succinct cryptographic proofs that transactions are valid.
- ZK rollups incur proof generation and verification overhead, which may raise base cost under load.
- Optimistic rollups tend to have lower overhead in typical conditions, but may suffer during fraud disputes.
- Post-EIP-4844, data posting costs are lower, which benefits both categories.
- Throughput and cost efficiency, ZK rollups scale well when many transactions are batched; optimistic rollups may handle bursts better.
- Many hybrid and modular designs try to combine advantages for balance.
- Security vs cost trade-off, ZK gives stronger cryptographic guarantees at potentially higher cost, optimism gives cost savings with a risk window.
Fee Optimization Strategies on Layer 2
- Batching & aggregation, bundling multiple user operations into one on-chain submission, reduces per-tx overhead.
- Off-peak scheduling, scheduling non-urgent transactions during low network usage, can cut costs by ~20–40%.
- Smart contract gas tuning, optimizing loops, reducing storage writes, using efficient data types, and eliminating redundant logic.
- Lazy execution/“lazy contracts”, push computation off-chain until necessary, so gas is only used on dispute or non-trivial events.
- Gas abstraction/meta-transactions, enabling relayers or payers to sponsor gas so users don’t pay directly.
- Fee prediction & dynamic tipping, using models to estimate optimal tip levels and avoid overpaying.
- Priority slot strategies, bidding only when needed for urgent inclusion, avoiding high tip wars when demand is low.
- Sequencer pricing protocols, some L2s implement dynamic fee markets or auctions to discourage overbidding.
- Cross-rollup routing/aggregation, using multi-rollup aggregators that route transactions through the cheapest paths.
- Reusable proofs & modular execution, in ZK rollups, reuse intermediate proofs or optimize proof cost amortization.
Influence of Ethereum Upgrades on Lay
- Lower data posting cost reduces the base cost floor for L2s, especially for data-heavy rollups.
- Greater fee predictability emerges from improved L1 sampling and data sharding, which stabilizes L2 gas markets.
- Throughput expansion, more blobs per block, means L2s can post more data without congestion.
- Compression/encoding innovations, as Ethereum evolves, L2s benefit from better compression standards.
- Interplay of L1 gas volatility, upgrades reduce spikes in L1 gas, smoothing L2’s margin risk.
- Incentives for blob utilization, rollups will compete for blob slots, potentially creating a new submarket.
- EIP-4844 legacy effects, earlier blob design already cut data cost significantly, subsequent upgrades amplify that gain.
- Network effect on developer confidence, upgrades signal long-term scalability, attracting more projects to deploy on L2s.
Accounting and Margin Analysis for Layer 2 Operators
- Revenue per block = base fee + priority fees – L1 data posting cost – operator overhead.
- Priority fee share, e.g., on Base, priority fees averaged $156,138/day, ~86.1% of total revenue.
- Cost of L1 data/blob submission eats a predictable portion of revenue.
- Marginal cost per transaction declines as batch size increases.
- Return on capital (ROC), sequencers invest in infrastructure, margin depends on throughput and tip capture.
- Slot competition rent, top block slots command disproportionate tip premiums.
- Concentration risk: A few high-paying addresses can dominate tip revenue.
- Efficiency losses, analyses found ~29.48% of blocks are built inefficiently, and ~72.53% of type-3 transactions overpay.
- Fee discount/rebate programs, some L2S offer a rebate or discount to strategic users.
- Operational costs, hardware, prover costs, bandwidth, and maintenance must be accounted for.
Scalability and Efficiency Metrics
- Transactions per second (TPS), measured under typical load (e.g., 300–2,000 TPS).
- Gas utilization, how fully each block’s gas capacity is used, ideally > 90%.
- Average batch size, number of user ops per L1 datum posting.
- Proof latency/throughput, speed at which ZK proofs are generated and verified.
- Data compression ratio: how much calldata or blob data is compressed relative to the raw payload.
- Slot inclusion delay, average wait time for user transactions to be included.
- Fee variance coefficient, standard deviation of gas prices relative to the mean.
- Throughput resilience, the ability to maintain TPS under sudden surges.
- Per-tx cost (USD), total cost including base, tip, proof, and data posting.
- Effective gas cost per user op, total gas used / number of user ops.
Frequently Asked Questions (FAQs)
Over the past 180 days, Base has earned an average of $185,291 per day in revenue
Optimistic MEV accounts for over 50% of on-chain gas usage on Base and Optimism in Q1 2025.
Daily gas revenue has dropped from about $23 million at peak down to $6–7.5 million, a ~70% decline.
Priority (tip) fees represent around 86.1% of Base’s daily revenue.
Conclusion
Gas fee markets on Layer 2 have evolved from simple scaling-down of Ethereum costs into complex microeconomies shaped by priority fees, batching strategy, MEV dynamics, and Ethereum protocol upgrades. Sophisticated sequencing algorithms, predictive models, and tooling are central to capturing margins and keeping user costs low. As Ethereum’s Fusaka upgrade further reduces data costs and stabilizes throughput, Layer 2s will face greater competition but also greater opportunity. The future will favor rollups and operators that blend economic intelligence, execution efficiency, and transparent fee mechanics.


