Imagine stepping into a bank branch in the early 2000s, pen in hand, filling out paperwork for a simple wire transfer. Fast forward to 2025, and a 20-year-old in Nairobi can earn, lend, and stake digital assets, all from a smartphone app connected to a decentralized finance (DeFi) protocol.
This transformation from traditional banking to DeFi isn’t just a shift in tools; it’s a reshaping of trust, access, and efficiency in financial ecosystems. As we dive into the numbers, you’ll see how DeFi is challenging legacy banking, not just ideologically, but statistically.
Key Takeaways
- 1$247 billion in DeFi total value locked (TVL) in Q2 2025, up 31% year-over-year.
- 25.4 billion people globally remain unbanked or underbanked, many now reached via DeFi.
- 3$19.7 trillion in total assets held by the five largest U.S. banks.
- 457% of Millennials and Gen Z prefer DeFi apps over mobile banking platforms in 2025.
Largest DeFi Lending Protocols
- AAVE V2 led the market with a lending volume of $4.1 billion, making it the top DeFi lending protocol.
- JustLend followed with a substantial $3.39 billion in lending, securing the second spot in the rankings.
- Venus recorded $878.25 million in lending volume, placing it third among major DeFi lending platforms.

Global Market Size Comparison of DeFi and Traditional Banking
- $247 billion is the DeFi market size as of May 2025.
- $370 trillion represents the total global traditional banking assets.
- 9.4% compound annual growth rate (CAGR) for DeFi, projected to hit $540 billion by 2027.
- $1.9 trillion in DeFi transactions per quarter this year.
- $32 billion in annual revenue generated by DeFi platforms.
- $1.5 trillion global fintech market in 2025, with DeFi accounting for nearly 16% of it.
- 72% market share in consumer lending held by traditional banks; DeFi accounts for 6.8%.
- $13 billion collected in gas fees across Layer-2 DeFi platforms.
- 3.5x growth in DeFi user funds since 2023.
User Growth and Adoption Rates
- 312 million active DeFi users globally in Q2 2025.
- 6.9% annual increase in traditional bank account holders.
- 61% of DeFi users are under 35 years old.
- 47 million monthly active users on Ethereum-based DeFi apps.
- 39% year-over-year increase in first-time DeFi users accessing via mobile wallets.
- 84% of traditional bank users rely on centralized apps, but only 26% trust them for investing.
- 88 countries report active DeFi usage.
- 25 million new users onboarded via Layer-2 platforms like Arbitrum and Base.
- 14.3% DeFi user retention rate, versus 7.1% in traditional retail banking apps.
- 3x higher account reactivation rate among DeFi users.
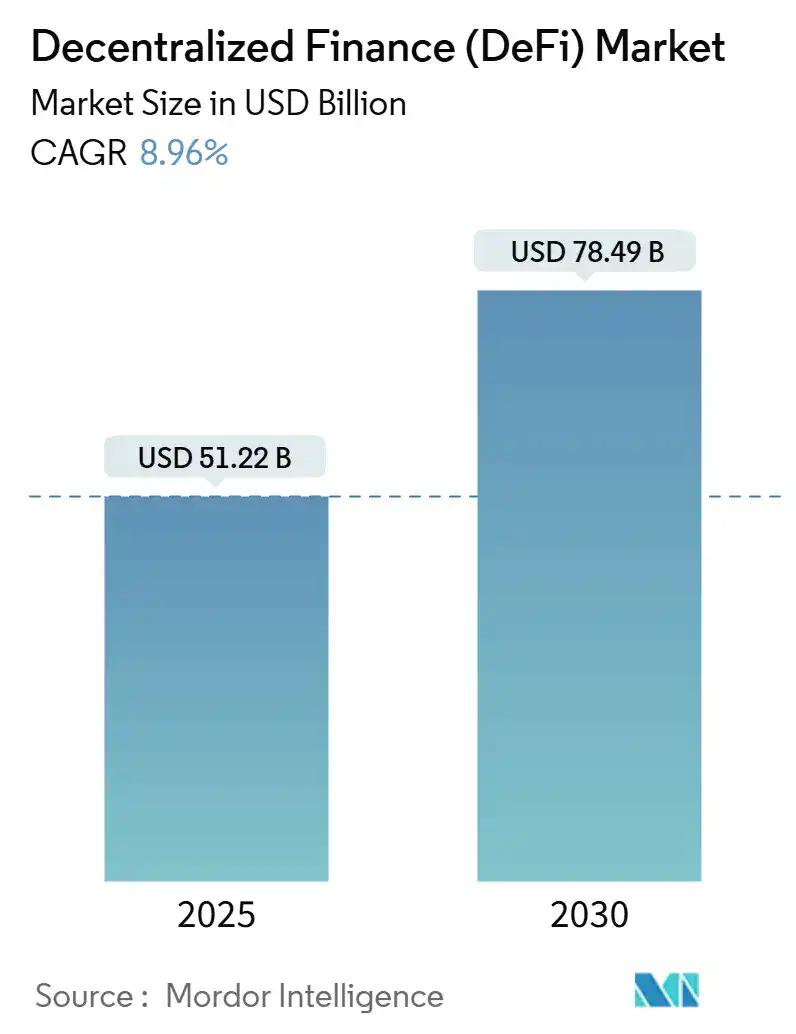
Projected Growth of the DeFi Market
- The DeFi market size is projected to reach $51.22 billion in 2025.
- By 2030, the market is expected to grow to $78.49 billion.
- This expansion reflects a CAGR of 8.96%, indicating steady and sustainable growth in the decentralized finance space.
Transaction Volume and Value
- $1.9 trillion in quarterly DeFi transaction volume in Q1 2025.
- $405 trillion in transaction volume handled by the global banking system.
- $1.07 is the average DeFi transaction fee on Layer-2s.
- 72 million average daily DeFi transactions.
- 3.6 seconds average time to finalize a DeFi transaction; traditional international wire transfers average 28 hours.
- $34 billion in quarterly decentralized exchange (DEX) volume.
- 16.2% rise in institutional DeFi trading activity.
- 4.1x increase in DeFi collateralization of NFTs.
- $108 billion in synthetic assets traded through DeFi, including tokenized stocks and forex.
- $12.6 billion in flash loan activity for 2025.
Geographic Distribution of DeFi vs. Traditional Banking Usage
- 33% of DeFi users in 2025 are based in Asia, with Vietnam, India, and the Philippines among the top adopters.
- 21% of DeFi adoption comes from Latin America, led by Brazil, Argentina, and Colombia.
- 19% of active DeFi users are in Sub-Saharan Africa, particularly Nigeria and Kenya, where mobile finance is dominant.
- 47% of global banked individuals live in North America and Europe, but only 14% of global DeFi adoption occurs there.
- 78% of traditional banking institutions still require in-person identity verification in emerging markets.
- 86 countries now support on-ramp access to DeFi via local fiat currencies.
- 12% of U.S. households used at least one DeFi application in 2025.
- 53% of new wallet creations in 2025 are from mobile-first regions in Southeast Asia and Africa.
- 16.4% of DeFi adoption growth comes from MENA (Middle East and North Africa) in 2025.
- 91% of traditional banking infrastructure investment is concentrated in G20 countries.
How Users Perform Different Banking Activities Across Channels
- 48% of users inquire about a product through traditional banking, while only 37% use online banking and 15% use mobile apps.
- For international money transfers, 53% prefer online banking, 24% use mobile apps, and 23% rely on traditional methods.
- When updating account details, 47% use online banking, followed by 26% on mobile apps, and 27% through traditional banking.
- Paying bills is most common via mobile apps (41%), closely followed by online banking (44%), and only 15% use traditional banking.
- 48% of users transfer money to others using mobile apps, compared to 38% via online banking and just 14% traditionally.
- Similarly, account-to-account transfers are done by 48% through mobile apps, 38% online, and 14% via traditional channels.
- For balance inquiries, 56% turn to mobile apps, while 29% use online banking, and 15% still go the traditional route.

Interest Rates and Yield Comparison
- 8.2% average yield for DeFi staking and lending platforms in 2025.
- 2.1% is the average global savings interest rate offered by traditional banks this year.
- 14% yield is offered on select DeFi protocols for stablecoin lending.
- 1.9% average rate for 1-year fixed deposits in U.S. banks in 2025.
- 6.5% is the return from DeFi yield farming on Layer-2 ecosystems such as Optimism and Arbitrum.
- 0.01%–0.50% is the yield range still offered by traditional savings accounts in major retail banks.
- 9.8% average APY on DeFi liquidity pools pairing stablecoins with blue-chip crypto assets.
- 7.4% returns from staking native assets such as ETH and SOL on-chain.
- 0.9% is the effective interest earned by U.S. consumers after adjusting for inflation in traditional accounts.
- 2.5x is the average multiple by which DeFi rates outpace traditional high-yield bank products.
Security Incidents and Fraud Rates
- $1.1 billion in reported DeFi exploits and protocol hacks in the first half of 2025.
- $2.8 billion in traditional banking fraud losses in the U.S. alone during the same period.
- 52% of DeFi-related breaches occurred due to smart contract vulnerabilities.
- 38% of DeFi hacks were mitigated within 24 hours due to community alerts and circuit breakers.
- 97% of banking fraud involved account takeovers or unauthorized transactions.
- 11 million phishing attacks targeted traditional bank users in Q1 2025.
- 19% of total DeFi security incidents involved rug pulls.
- 87% of DeFi protocols were audited in 2025.
- 0.18% of the total DeFi value locked was lost to hacks in 2025.
- $418 million in frozen funds were successfully recovered by white hat hackers and bounty programs in DeFi.
Generational Concerns About Banks Collecting Personal Data
- 21% of Gen Z Brits are most concerned about online banking and data collection.
- 19% of Millennials express high wariness over banks collecting their personal data.
- 10% of Gen X are cautious about data use in online banking.
- Only 5% of Baby Boomers show concern over data collection practices.
- The Silent Generation is the least worried, with just 4% expressing concern.

Operational Costs and Efficiency Metrics
- 60–70% lower operational overhead for DeFi platforms compared to legacy banks.
- $0.06 is the median cost per DeFi transaction on Layer-2 networks.
- $9.40 is the estimated cost for processing a bank wire transfer, including human capital and compliance.
- 5.4x faster average settlement time in DeFi protocols than in SWIFT-based systems.
- 93% of DeFi smart contract deployments in 2025 are automated with no human intervention post-launch.
- 23 minutes average resolution time for user-side issues in decentralized exchanges.
- $1.2 billion saved globally in remittance fees by using DeFi-based channels over traditional banking.
- 81% of DeFi operating costs are allocated to infrastructure and audits, with minimal spend on human resources.
- 42% reduction in overhead observed in hybrid financial institutions that adopted on-chain operations.
- 4.7 million transactions per day processed through DeFi rails with less than 0.3% error rate.
Regulatory Impact and Compliance
- 43 countries have established specific DeFi regulatory sandboxes or frameworks in 2025.
- 31% of global DeFi volume now comes from jurisdictions with clear legal recognition of DAO structures.
- $2.5 billion in DeFi platform revenue was subject to compliance-based disclosures in 2025.
- 61% of traditional banks increased regulatory costs due to enhanced KYC and AML requirements.
- $820 million in fines levied on banks globally for compliance failures in H1 2025.
- 16 DeFi protocols voluntarily adopted on-chain KYC modules without compromising decentralization.
- 24.6% of users now prefer protocols that comply with travel rule regulations.
- 11% reduction in regulatory delays reported by DeFi projects operating under proactive legal advisory.
- $173 million in grants issued by global fintech regulators to study DeFi governance models.
- 7 countries are piloting CBDC-DeFi interoperability projects in collaboration with blockchain foundations.
Top Factors People Consider When Choosing a Bank
- 43% of respondents prioritize convenience when selecting a bank.
- 35% consider bank charges as a key deciding factor.
- 15% focus on getting a favorable interest rate.
- Only 5% value the location of the bank.
- A minor 2% choose based on other reasons.

Customer Trust and Satisfaction Levels
- 63% of DeFi users report higher satisfaction with transparency compared to traditional banking.
- 29% of U.S. adults in 2025 trust decentralized apps more than banks with investment-related transactions.
- 71% of DeFi platforms offer real-time asset verification and open audit trails.
- 19% of traditional banking customers feel confident that their institution operates in their best interest.
- 47% of Gen Z consumers say they would rather lose access to a bank account than their crypto wallet.
- 89% of surveyed DeFi users cite control over funds as their main reason for preference.
- 12% of DeFi users experienced platform failures or withdrawal delays in the last year, versus 6% for online banks.
- 91% of DeFi apps display protocol fees and rules up front; only 34% of banks do the same for service fees.
- 38% of new users say social proof and community reviews influenced their trust in DeFi protocols.
- 58% of DeFi platforms now include native dispute resolution tools to improve user confidence.
Cross-Border Payment
- $1.2 trillion in global cross-border DeFi transactions processed in the first half of 2025.
- 3.6 seconds is the average time to finalize a DeFi-based international payment.
- $46 billion saved globally in remittance fees by switching from traditional payment rails to DeFi.
- $14.7 is the average fee per cross-border transfer via traditional banks in 2025.
- 96% of DeFi cross-border payments use stablecoins like USDC and DAI.
- 71 countries have seen stablecoin volumes exceed their local banking corridors.
- 4.3x faster settlement speed in DeFi systems compared to bank-based cross-border SWIFT transfers.
- $387 million processed daily through decentralized remittance platforms like Celo and Stellar in 2025.
- $2.9 billion in total value moved across refugee and aid networks through DeFi in regions with failed banking access.
DeFi Semi-Annual Revenue Breakdown by Segment
- Total DeFi revenue reached $1.5 billion on a semi-annualized basis.
- Exchanges dominated the sector, generating $1.2 billion, or 80% of total revenue.
- Lending protocols contributed $0.3 billion, accounting for 20% of the total.
- Asset management platforms brought in a minimal $0.04 billion, showing a limited revenue share.

Mobile and Digital Access Penetration
- 92% of DeFi users in emerging markets access platforms via mobile apps.
- 4.8 billion people globally now have mobile internet access, fueling DeFi’s grassroots growth.
- 61% of DeFi usage happens on mobile-first platforms with wallet-native apps.
- 82% of users under age 30 prefer managing their DeFi assets on mobile wallets.
- 27% of banking apps in low-income regions are still inaccessible due to outdated tech stacks.
- 43 million active monthly users on MetaMask Mobile, with 19 million on Trust Wallet in 2025.
- 11% of all DeFi activity now comes from decentralized social apps with embedded financial tools.
- 6.3x growth in DeFi users via mobile onboarding flows since 2020.
- 72% of DeFi users say ease of mobile access was their top reason for adoption.
DeFi Lending vs. Traditional Loan
- $97 billion in total value issued through DeFi lending protocols in H1 2025.
- $4.1 trillion in total global consumer loans issued by traditional banks in the same period.
- 9.1% is the average annual interest rate on unsecured DeFi loans.
- 4.6% is the average interest rate offered by U.S. traditional lenders for personal loans.
- 0.08 seconds is the average loan approval time in DeFi, versus 1–3 days for traditional banks.
- 72% of DeFi loans are overcollateralized with digital assets, ensuring lower credit risk without intermediaries.
- 32% of users borrow in DeFi to access capital in underbanked economies.
- 18% of DeFi borrowers are repeat users with positive repayment histories.
- 14% of U.S. small businesses used DeFi to secure capital in 2025.
- 3.3x higher capital efficiency for DeFi loan protocols than legacy systems, thanks to smart contract automation.
Recent Developments
- April 2025: Ethereum’s Dencun upgrade improved Layer-2 throughput by 3.7x, reducing costs and congestion.
- $1.6 billion: Total market cap of tokenized U.S. Treasury products on DeFi platforms like Ondo and Maple.
- 9.4 million new wallets onboarded via AI-driven DeFi onboarding tools in Q1 2025.
- 51% of DAOs now use zero-knowledge governance frameworks for private voting.
- $418 million in DeFi ecosystem investments announced by major fintech VCs in 2025 alone.
- 1.5 million users interacted with DeFi via Telegram-integrated bots and embedded mini-apps.
- April 2025: Uniswap v4 launched hooks and custom LP pools, increasing platform volume by 38% in 3 weeks.
- $280 million in grants allocated by the Ethereum Foundation for DeFi protocol R&D in 2025.
- 7 central banks are piloting interoperability standards with DeFi bridges and CBDC contracts.
- 89% of DeFi teams now use embedded AI tools for fraud detection, pricing models, and user support automation.
Conclusion
DeFi is no longer a fringe experiment; it’s a parallel financial ecosystem growing with exponential sophistication. While traditional banking continues to dominate in volume, DeFi is rapidly gaining ground in user engagement, transparency, and efficiency.
From lending protocols issuing loans in seconds to cross-border payments settled instantly, decentralized finance is reshaping what users expect from financial services. Traditional institutions must adapt or risk becoming obsolete in a landscape where code, not clerks, powers finance.


