Decentralized stablecoins are reshaping the crypto finance landscape. Unlike fiat‑backed stablecoins issued by centralized entities, decentralized stablecoins rely on smart contracts, over‑collateralization, or algorithmic mechanisms to maintain value. In sectors like DeFi lending, decentralized stablecoins enable trustless borrowing and lending, while in cross‑border remittances, they offer lower fees and faster settlement compared to traditional banking rails. As regulation tightens and usage grows, understanding the numbers behind this evolution matters. Let’s explore the latest adoption statistics for decentralized stablecoins.
Editor’s Choice
- Decentralized stablecoins now represent about 20% of the stablecoin market cap in 2025.
- DAI leads decentralized stablecoins with a market value exceeding $10 billion in 2025.
- Total market capitalization for all stablecoins has approached $250‑$300 billion in mid‑2025.
- Stablecoin transaction volume in 2024 hit $5.7 trillion across ~1.3 billion transactions, and 2025 H1 already accounts for ~$4.6 trillion across ~1.0 billion transactions.
- Adjusted monthly stablecoin transaction volume has risen ~49%, from ~$472B/month in 2024 to about $702B/month in 2025.
- Centralized stablecoins still dominate; roughly 90% of market capitalization remains with centralized models.
- Institutional interest is growing, 54% of financial institutions/corporates not yet issued stablecoins expect to begin implementation by 2026.
Recent Developments
- MiCA in the EU continues to enforce transparency and reserve requirements for stablecoins operating in European jurisdictions.
- Increasing integration with payment infrastructure (Visa, Mastercard) in more than 10 global networks has strengthened utility and trust for stablecoins.
- Regulatory pressure, e.g., audits, full reserve requirements, is influencing centralized and decentralized issuers alike.
- New decentralized stablecoins or algorithmic/hybrid models (e.g., FRAX, LUSD) are gaining traction, especially in DeFi contexts.
- Stablecoin transfers on Ethereum and other major chains show upward trends in transfer volume, signaling increased active usage.
- Concerns over peg stability and risk have led to improvements in collateralization and more rigorous protocol audits.
- Adoption in emerging markets is rising sharply, often driven by inflation, currency instability, or lack of reliable local banking infrastructure.
Growth of Decentralized Stablecoins Market
- In mid‑2025, the stablecoins market capitalization is approximately $252‑300 billion, depending on the source.
- Decentralized stablecoins make up ~20% of that total, compared to ~18% in 2023.
- The supply of stablecoins (centralized + decentralized) grew ~59% in 2024 over the prior year.
- Among decentralized stablecoins, DAI is the largest, with a value > $10 billion in 2025.
- Supply of decentralized stablecoins like RSV is modest (≈ $500 million), but growing, especially in Latin America.
- Ethereum accounts for ~70% of stablecoin supply overall, with Binance Smart Chain holding ~15%.
- Overcollateralization in decentralized stablecoins remains high, with average collateral ratios near 160%.
- Usage in DeFi applications for decentralized stablecoins and stablecoin‑related assets represents roughly $60 billion in value in 2025.
Market Capitalization of Decentralized Stablecoins
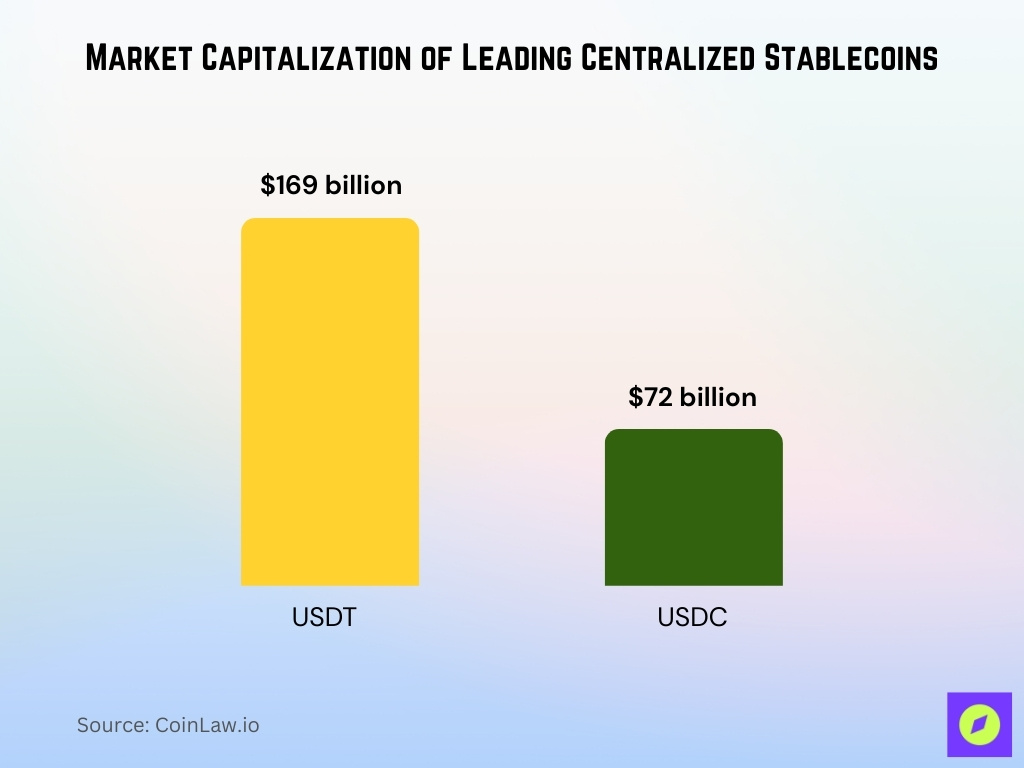
- Centralized stablecoins such as USDT (~$169 billion) and USDC (~$72 billion) dominate the rest of the market.
- DAI leads the decentralized stablecoin category with a market cap exceeding $10 billion as of 2025.
- FRAX and other hybrid models contribute a part of the remaining share of decentralized stablecoins.
- Decentralized stablecoins are about 20% of the total stablecoin market cap (~ $250‑300 billion); hence, their combined cap is ~ $50‑60 billion.
- BUSD, TUSD, USDP, etc., account for smaller centralized stablecoin market shares.
- Decentralized stablecoins tend to have smaller supply volatility and tighter overcollateralization.
- Most decentralized stablecoins live on Ethereum; others are spread but currently have much smaller caps.
- Despite growth, decentralized stablecoins still face liquidity constraints compared with major centralized options.
Leading Decentralized Stablecoins by Adoption
- DAI (MakerDAO) is the leading decentralized stablecoin in terms of market cap (>$10 billion) and usage.
- FRAX is also notable for its hybrid model, used in governance, liquidity pools, and as collateral in DeFi.
- LUSD and similar algorithmic or liquid staking‑backed stablecoins are growing in usage among DeFi participants.
- RSV has about $500 million in supply, mostly in Latin America.
- Decentralized stablecoins see an increasing number of unique wallets interacting with their smart contracts.
- Platforms like MakerDAO have invested in improving risk controls, smart contract audits, and stress tests.
- The top decentralized stablecoins maintain collateralization ratios near 160%, mitigating downside.
- Decentralized stablecoins are increasingly used in liquidity pools and as collateral in lending/borrowing protocols.
Adoption Trends by Region and Country
- APAC led global on‑chain crypto activity growth at 69% year‑over‑year in value received.
- Nigeria has the highest stablecoin adoption rate globally at ~9.3% of the population.
- Brazil sees ~90% of crypto flows tied to stablecoins.
- Vietnam is among the top five countries for crypto adoption, with over 20% of the population owning digital assets.
- Some emerging markets rely heavily on stablecoins for remittances and everyday transfers.
- Regulatory clarity in the U.S. has begun affecting regional adoption.
- Regions with high inflation see adoption of stablecoins as a hedge.
- North America and Europe show slower percentage growth, but higher absolute value.
Stablecoin Issuers as Major Holders of U.S. Treasuries
- Stablecoin issuers could hold $1.2 trillion in U.S. Treasuries by 2030, surpassing every individual country in the world.
- This projected figure would place stablecoin issuers ahead of Japan ($1.08 trillion) and China ($761 billion), the current top foreign holders.
- Today’s stablecoin treasury holdings sit at around $120 billion, highlighting a 10x projected increase by the end of the decade.
- The UK holds $740 billion, followed by Luxembourg ($410 billion) and the Cayman Islands ($405 billion) as other leading holders.
- Smaller but notable holders include India ($226 billion), Brazil ($199 billion), and Saudi Arabia ($127 billion).
- South Korea, with $122 billion, currently matches stablecoin issuers’ present-day exposure to U.S. Treasuries.
- The projection underscores the growing role of stablecoins in global financial infrastructure, particularly in U.S. debt markets.

Decentralized Stablecoins Usage in DeFi
- DeFi total value locked (TVL) in 2025 is $123.6 billion, with stablecoins contributing about 40%.
- Active stablecoin wallets increased by over 53% year‑over‑year.
- Transfer volume on Ethereum has increased in 2025.
- MakerDAO’s DAI continues to be heavily used in lending, collateral, and liquidity.
- DeFi platforms require higher collateralization and smart contract audits.
- Yield opportunities range from 5‑10% APY, sometimes more.
- Ethereum remains the primary chain hosting decentralized stablecoins.
User Adoption and Wallet Growth
- The number of active stablecoin wallets grew by over 53% year‑on‑year.
- Latin America, Sub‑Saharan Africa, and APAC saw double‑digit wallet growth.
- Emerging markets use wallets for savings and transfers.
- Wallet growth in the U.S. and EU is driven more by institutional and DeFi users.
- Non‑custodial wallets are common in decentralized stablecoin usage.
Stablecoin Payments & Infrastructure Trends: Decline in Adoption Barriers
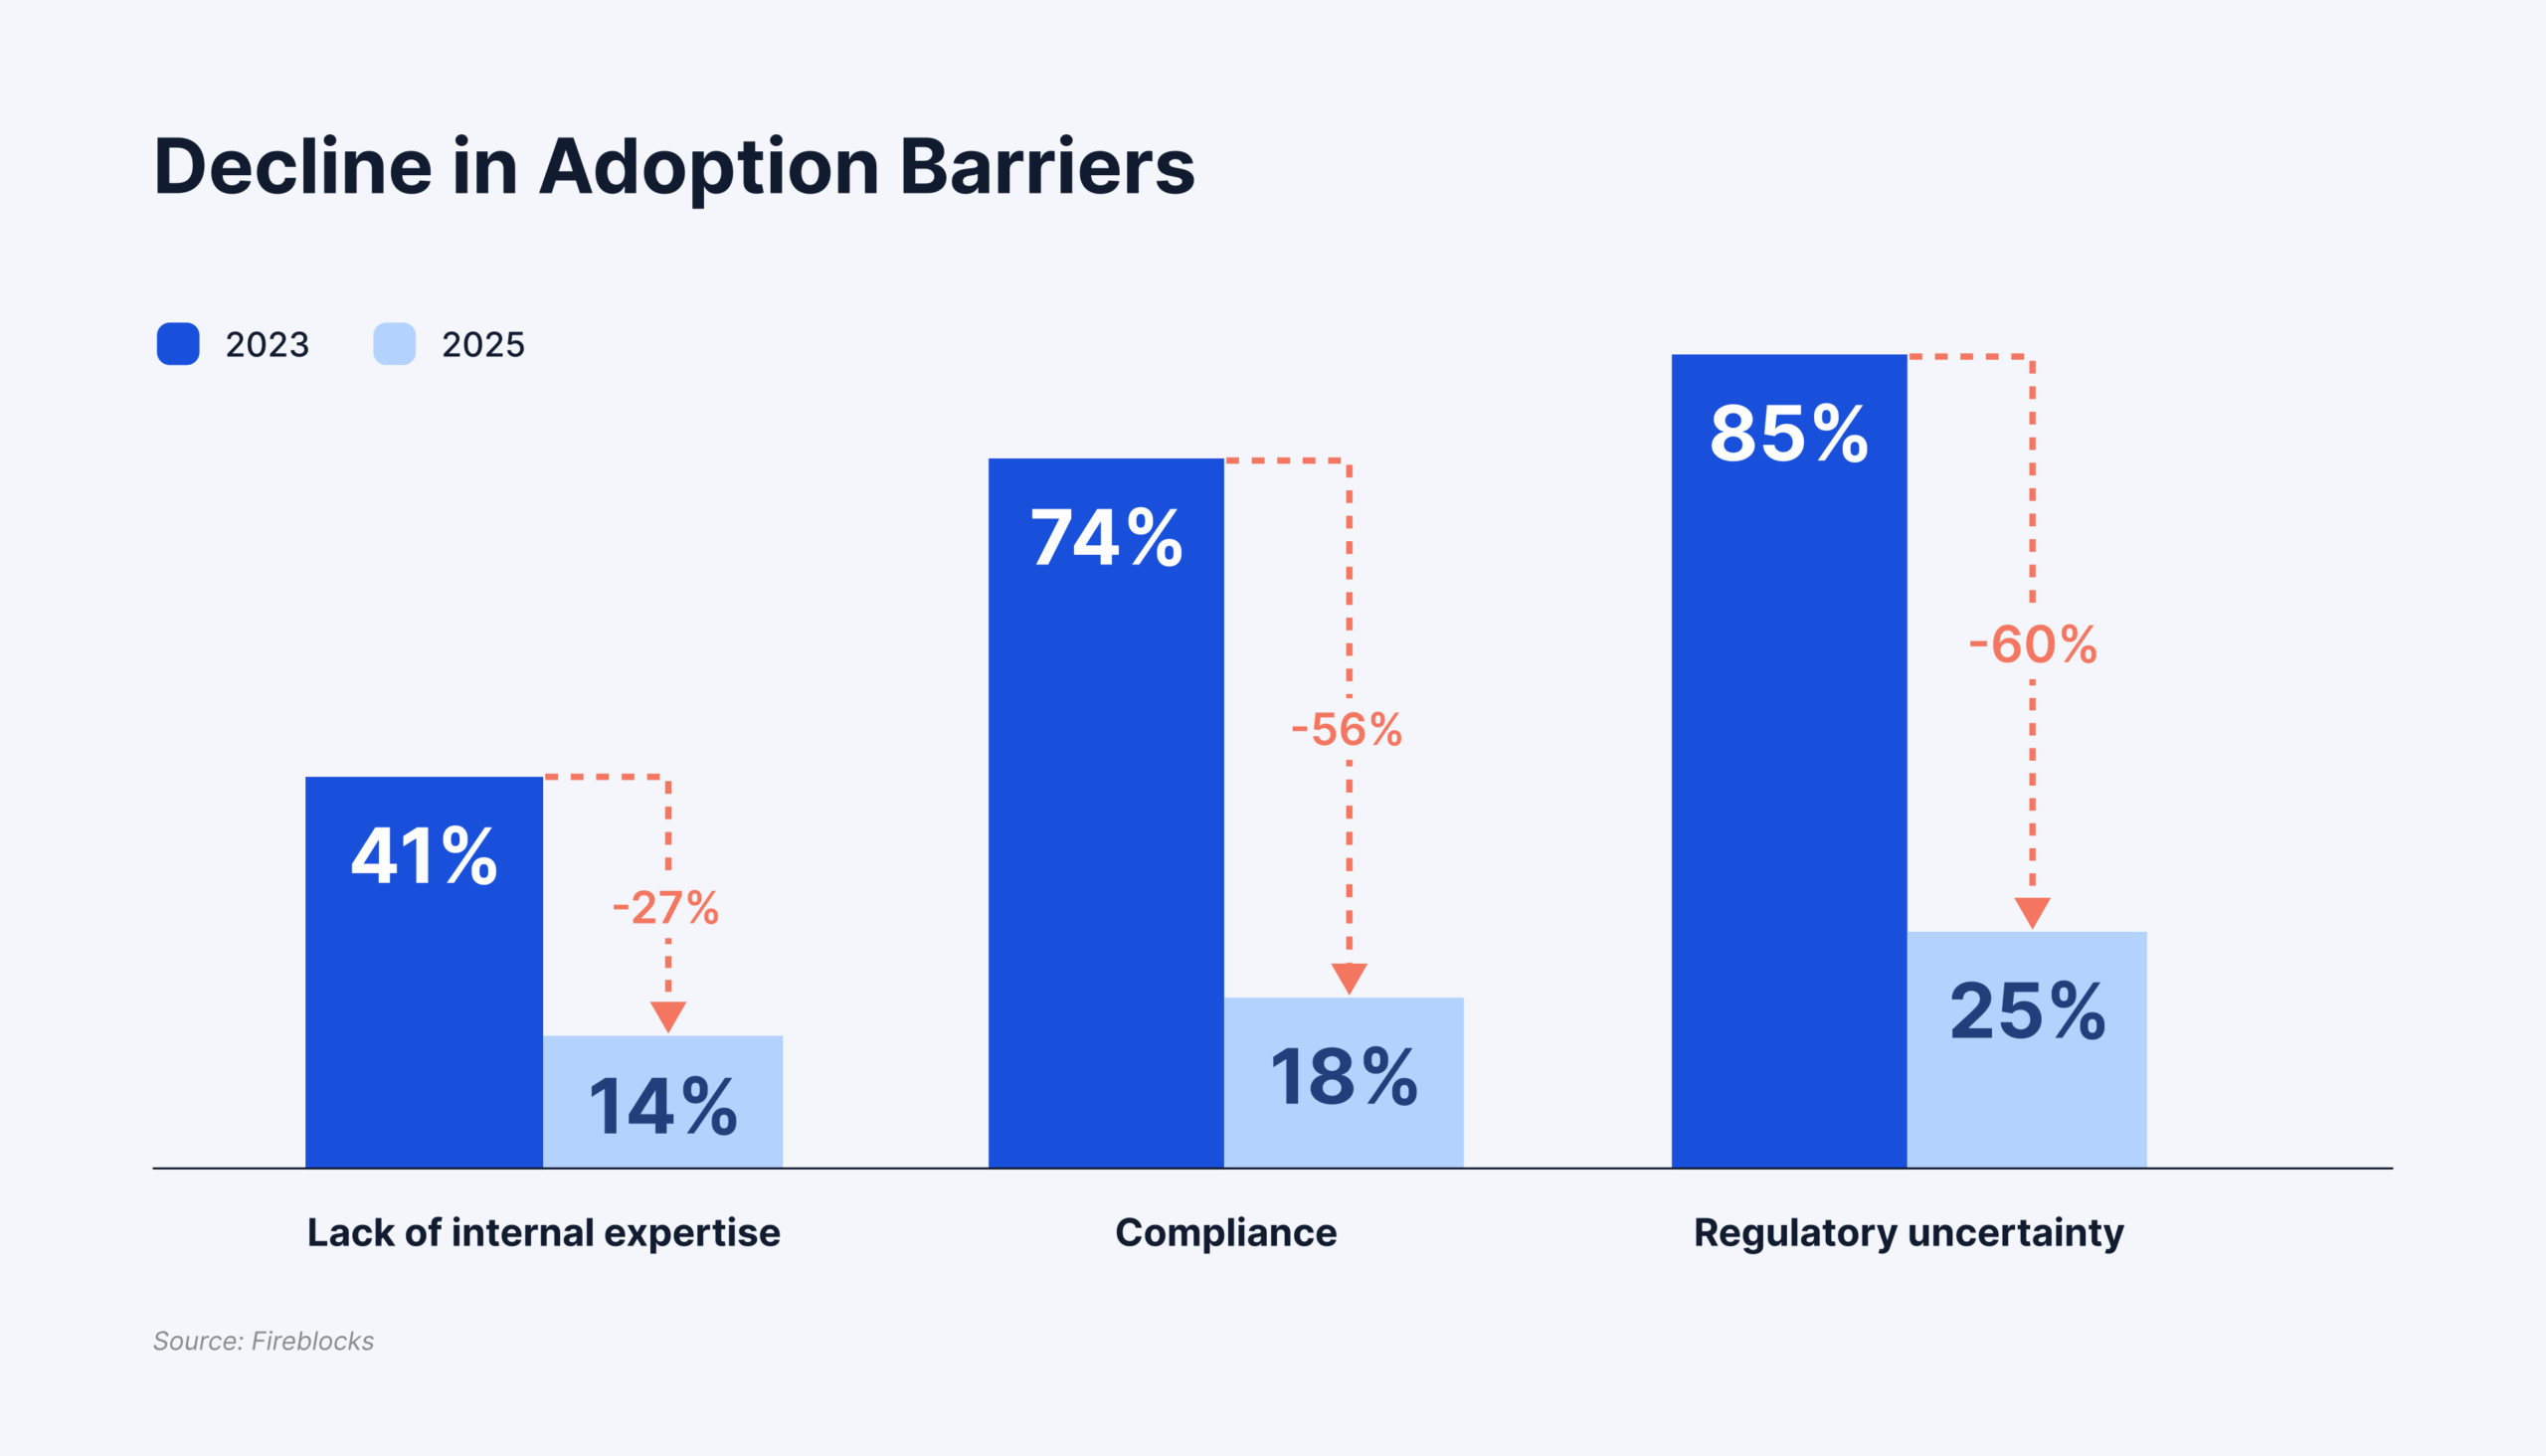
- Lack of internal expertise as a barrier dropped from 41% in 2023 to 14% in 2025, a 27 percentage point decline, showing improved team readiness and technical capability across organizations.
- Compliance concerns significantly decreased from 74% to 18%, a 56 percentage point drop, indicating that regulatory frameworks and KYC/AML processes for stablecoin payments have become more streamlined.
- Regulatory uncertainty, long seen as the biggest hurdle, fell from 85% in 2023 to just 25% in 2025, a massive 60 percentage point reduction, suggesting greater global clarity on stablecoin classifications and oversight.
- This data reflects a maturing ecosystem where institutional adoption of stablecoin infrastructure is accelerating due to fewer legal, technical, and governance obstacles.
- The trend supports the notion that stablecoins are becoming viable rails for cross-border payments, settlements, and on-chain commerce in mainstream finance.
Transaction Volume and Activity
- Stablecoins processed over $8.9 trillion in on‑chain volume in H1 2025.
- Stablecoin market cap in mid‑2025 reached about $255‑$277 billion.
- 5‑8% of stablecoin transaction value is unrelated to trading/DeFi.
- Ethereum stablecoin transfer volumes increased in 2025.
- Brazil’s crypto flow is ~90% stablecoin‑based.
- Average remittance fees with stablecoins are 2‑3%, versus ~6% for banks.
- Stablecoins contribute ~40% to DeFi TVL.
Merchant and Corporate Adoption
- Mastercard supports stablecoin payments at over 150 million locations.
- Rain raised $58 million in 2025 to expand stablecoin‑backed Visa cards.
- 81% of corporations plan ROI analyses for stablecoin adoption.
- 63% of organizations prefer existing providers for integration.
- Integration complexity and customer trust are barriers.
- Stablecoins reduce FX and conversion costs.
- Corporate treasuries use stablecoins for liquidity.
- Firms like Amazon and Walmart are exploring stablecoin issuance.
How Stablecoins Are Used Across dApps
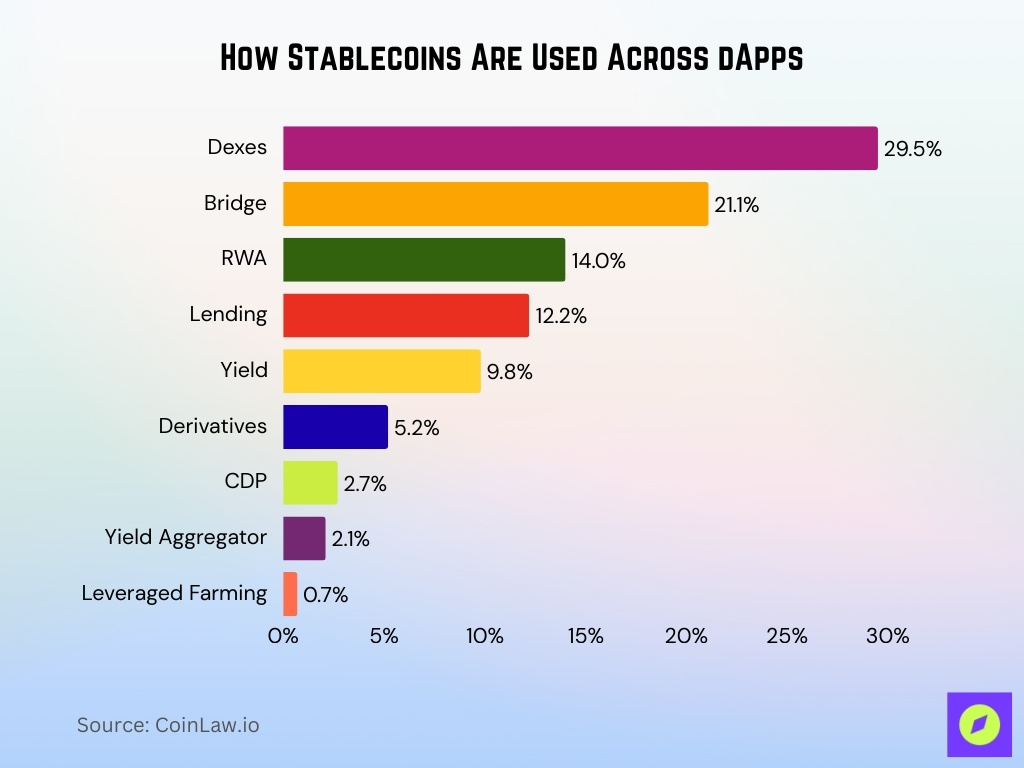
- Decentralized exchanges (Dexes) lead stablecoin usage, accounting for 29.5% of total dApp-related activity, showing strong demand for liquidity and token swaps using USDT, USDC, DAI, FRAX, USDE, and PYUSD.
- Bridges come second at 21.1%, reflecting the growing need for cross-chain stablecoin transfers and interoperability across L1 and L2 blockchains.
- Real World Assets (RWA) dApps represent 14.0%, a sign that tokenized treasuries, real estate, and yield-bearing assets are gaining traction in on-chain finance.
- Lending platforms make up 12.2%, highlighting stablecoins’ role as collateral and borrowing currency in DeFi protocols.
- Yield-related apps, including staking and interest-bearing vaults, capture 9.8% of stablecoin usage, as users seek low-volatility yield opportunities.
- Derivatives platforms account for 5.2%, reflecting moderate usage in futures and options trading denominated in stablecoins.
- CDPs (Collateralized Debt Positions) represent 2.7%, often tied to over-collateralized minting protocols like MakerDAO.
- Yield aggregators such as Yearn and Beefy account for 2.1%, automating stablecoin-based yield farming strategies.
- Leveraged farming is the smallest category at just 0.7%, indicating reduced risk appetite for high-leverage stablecoin strategies in 2025.
Remittance and Cross‑Border Payments Usage
- Cross‑border payments using stablecoins are accelerating in 2025.
- Stablecoins help cut costs and speed settlement.
- 71% of Latin American users report using stablecoins for cross‑border transfers.
- 49% of Asia‑based users cite global expansion as their top stablecoin driver.
- Regulatory improvements enable more cross‑border activity.
- Remittance platforms integrate stablecoin rails.
Adoption Drivers and Benefits
- 73% of organizations cite regulatory uncertainty as a barrier.
- Near‑instant transfers attract corporate interest.
- Lower transaction fees benefit merchants.
- Financial inclusion improves in underbanked regions.
- Corporations use stablecoins for treasury and FX efficiency.
- Stablecoins offer 24/7 settlement.
- Smart contract programmability adds innovation potential.
Collateralization and Risk Management Statistics
- Transparent reserves lead to stronger adoption.
- Decentralized stablecoins hold ~15‑20% of market cap.
- 78% of institutional investors use formal crypto risk frameworks.
- Smart contract, oracle, and liquidity risks persist.
- Protocol audits and disclosures are increasingly common.
- Over‑collateralization is standard in decentralized models.
Comparison With Centralized Stablecoins
- Centralized stablecoins hold ~90% market share.
- Centralized options offer greater liquidity and exchange presence.
- Decentralized models focus on transparency and community governance.
- Reserve verification differs between models.
Regulatory Impact on Adoption
- The GENIUS Act provides a stablecoin framework in the U.S.
- MiCA has been operational in the EU since early 2025.
- Regulatory uncertainty hinders ~73% of market participants.
- Reserve and audit requirements are becoming industry norms.
Institutional Participation and Adoption
- Over three‑quarters of institutions plan to increase digital asset allocation.
- 78% have risk management frameworks for crypto.
- Transparency and compliance drive stablecoin selection.
- Institutions use stablecoins for treasury and payments.
Frequently Asked Questions (FAQs)
Decentralized stablecoins account for 20% of the stablecoin market in 2025.
DAI has a market capitalization exceeding $10 billion in 2025.
Active stablecoin wallets have grown by over 53% year‑over‑year in 2025.
The total stablecoin market cap in mid‑2025 is about $252 billion‑$300 billion.
Conclusion
Decentralized stablecoins are progressing from niche protocols toward stronger real‑world utility. Corporations, fintechs, and institutions increasingly prefer stablecoins for speed, cost reduction, global reach, and financial innovation. Regulatory developments in the U.S. (GENIUS Act) and the EU (MiCA) are removing major frictions. However, challenges around regulatory clarity, technical risk, liquidity, and trust remain.
If decentralized stablecoin protocols can continue bolstering transparency, collateral practices, and integration capabilities, they may capture a much larger share of both payment rails and financial infrastructure. In the coming years, their growth will likely be shaped more by policy, security, and use‑case execution than by mere speculation.


