Credit scoring models play a pivotal role in financial decision-making, guiding lenders and consumers alike. In industries such as mortgage underwriting and auto-loan origination, scoring models affect access, pricing, and risk. For example, lenders assessing a home loan may apply a credit-score threshold to approve or decline a borrower; similarly, fintech firms use credit scoring to decide whether to offer a credit card. This article dives into key statistical trends for credit-scoring models, offering data-driven insight for both industry and individual readers.
Editor’s Choice
- In Q3 2025, new credit-card originations among subprime borrowers increased 21.1% year-over-year.
- The national 30-day delinquency rate for credit-card debt in the U.S. was approximately 3.2% in Q1 2025, with significantly higher rates observed among subprime or low-income segments.
- Usage of the VantageScore credit-scoring model climbed to 41.7 billion scores in 2024, a 55% increase over 2023.
- Average U.S. consumer credit-card balances were approximately $6,000–$7,500 in October 2025.
- Revolving consumer credit increased at a seasonally adjusted annual rate of 2.0%, and nonrevolving at 2.9% in September 2025.
- A “good” credit score range under VantageScore 3.0 is 661-780 as of March 2025.
Recent Developments
- The consumer-credit market saw consumer risk diverge, with more individuals in both the super prime and subprime tiers by Q3 2025.
- Credit-card origination volumes rose 9% YoY in Q3 2025 (20.5 million new accounts in Q2).
- Average new credit-line size for cards declined 1.6% YoY in Q3 2025, driven by subprime reductions of 5.0%.
- Credit-card debt in delinquency (30 + days) rose from 12.6% in the lowest-income ZIP codes in Q3 2022 to 22.8% in Q1 2025.
- For 90-day delinquency, the U.S. rate stood at 10.7% in Q1 2025, lowest-income ZIP codes at 16.1%.
- The total consumer credit (revolving + nonrevolving) increased at an annual rate of 2.7% in Q3 2025.
- The VantageScore CreditGauge report (June 2025) flagged rising mortgage delinquencies even among higher-score borrowers.
- Use of alternative scoring models widened, and more lenders adopted VantageScore 4.0 and 5.0 in mid-2025.
Global Credit Scoring Market Highlights
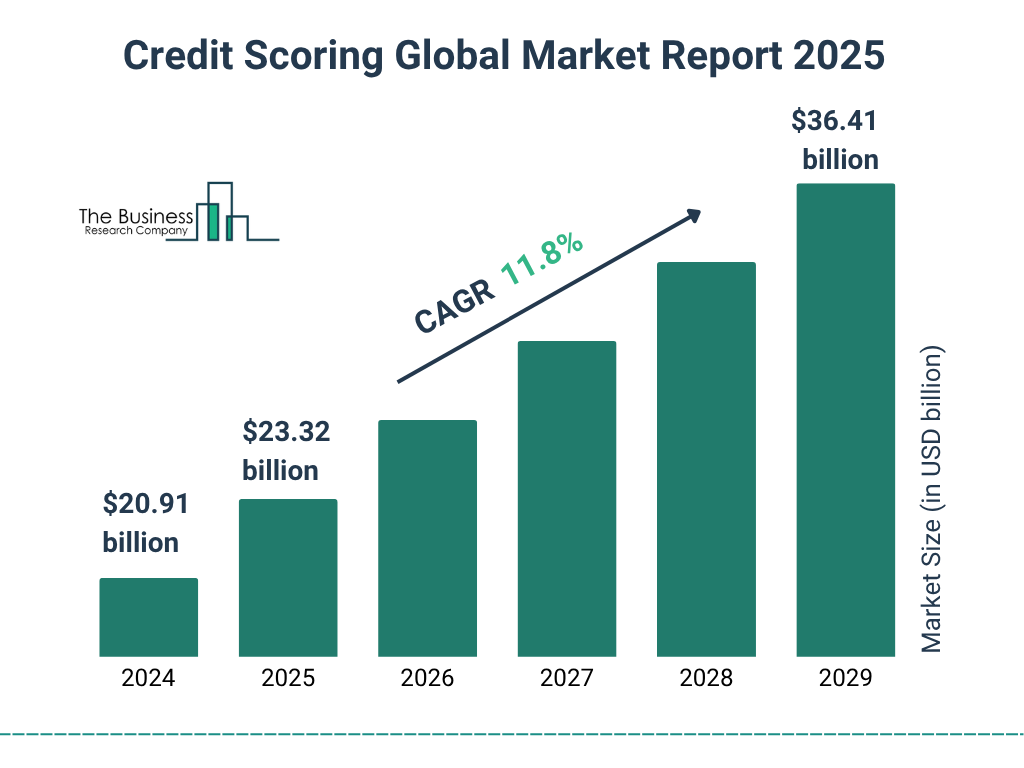
- The global credit scoring market reached $20.91 billion in 2024, reflecting strong demand for modern risk assessment solutions.
- Market size is projected to grow to $23.32 billion in 2025 as lenders and fintechs expand automated scoring adoption.
- The industry is forecast to grow at a 11.8% CAGR, driven by AI models, digital lending, and alternative data usage.
- By 2029, the market is expected to reach $36.41 billion, nearly doubling from its 2024 level.
- Overall growth underscores the global shift toward data-driven and automated credit decisioning across financial systems
What Is Credit Scoring?
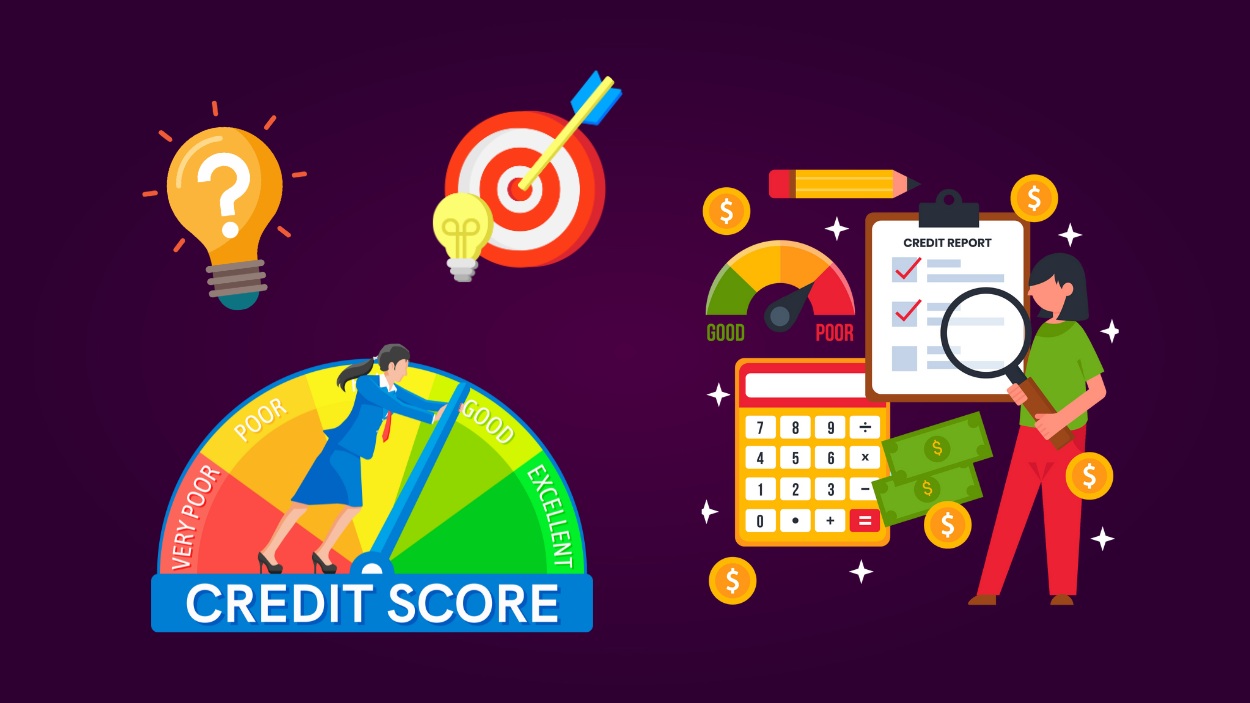
- Credit scoring assigns a numeric value summarizing the creditworthiness of a consumer, based on credit-report data.
- The most commonly used U.S. credit scores range from 300 to 850, where a higher score indicates lower credit risk.
- Around 90% of U.S. lenders use FICO scores for credit decisions on loans and credit cards.
- Nearly 22% of U.S. consumers have thin credit files, lacking enough data for traditional scoring.
- Minor updates in credit scoring models can impact credit access for millions of consumers due to shifts in factor weighting.
- A substantial share of low-risk thin-file borrowers, often estimated at around 50–60%, face loan denial under traditional models, though exact percentages vary across lenders.
Key Credit Scoring Models
- The FICO Score is used in 90% of U.S. lending decisions.
- VantageScore covers approximately 94% of U.S. consumers, including 33 million more than traditional models.
- Over 3,700 financial institutions use VantageScore models as of 2025.
- FICO 8 is the most adopted version, though FICO 10T uses trended data for improved accuracy.
- Industry-specific scores, such as auto and bank-card models, have ranges from 250 to 900.
- VantageScore 5.0 offers up to 9% improved predictive lift for consumers with thin credit files.
- VantageScore usage grew 55% to 42 billion credit scores in 2024.
- Consumers may see score differences of up to 40 points between bureaus using the same VantageScore model.
FICO Score 8 Factor Breakdown
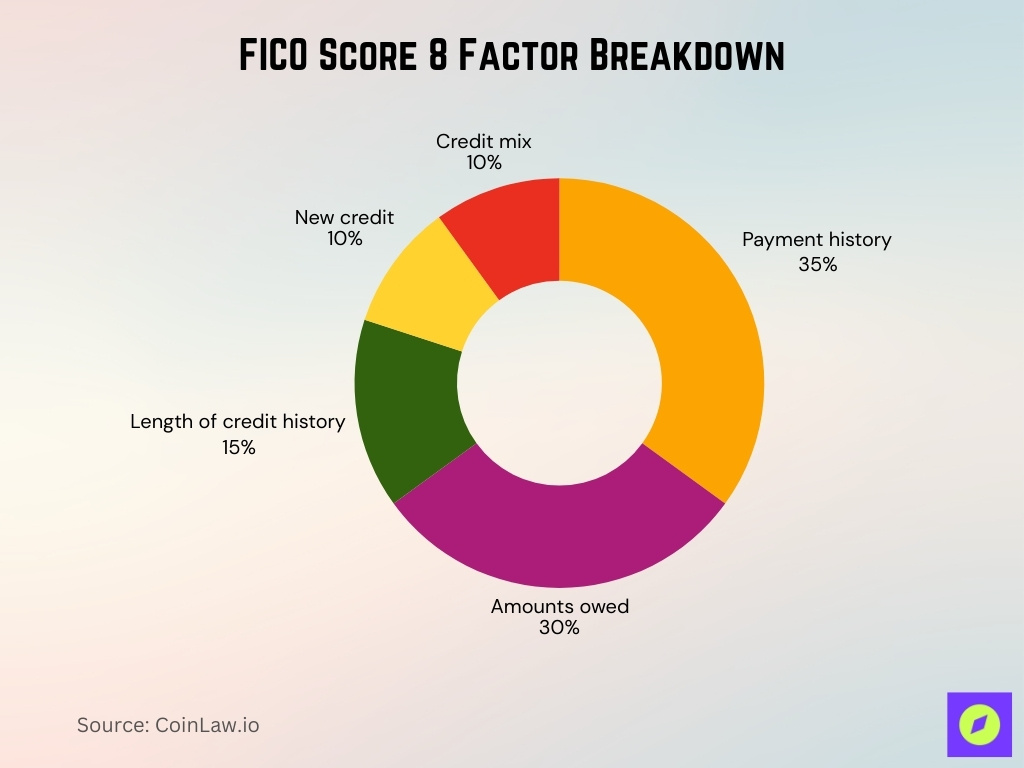
- Payment history makes up the largest share at 35%, showing how crucial on-time payments are for maintaining a strong credit score.
- Amounts owed account for 30%, highlighting how credit utilization and outstanding balances heavily influence creditworthiness.
- Length of credit history contributes 15%, rewarding consumers who maintain long-standing accounts.
- New credit represents 10%, reflecting how recently opened accounts and credit inquiries can impact scores.
- Credit mix also makes up 10%, emphasizing the benefit of having a diverse combination of credit types.
VantageScore Model Overview
- VantageScore usage climbed by 55% to 41.7 billion credit scores in 2024.
- VantageScore 5.0 launched in April 2025 with up to 9% predictive performance lift over earlier versions.
- The model scores 33 million more consumers than older frameworks, aiding thin-file and credit-invisible individuals.
- By October 2025, the average credit balance for users had hit a post-pandemic high of $6,000–$7,500.
- Credit delinquencies 60+ days past due increased notably among lower-income consumers in mid-2025.
- VantageScore 4.0 is accepted by Fannie Mae and Freddie Mac for conforming mortgages.
- Lenders using VantageScore can broaden underwriting to include renters and underserved groups.
- VantageScore usage in the credit card sector grew 142% in 2024, driving massive volume gains.
Other Credit Scoring Models
- CreditXpert and Intelliscore cater to niche borrowers with proprietary scoring models used in mortgage and business lending.
- Industry-specific models like auto and bank-card risk models now represent about 20% of scoring applications in 2025.
- Alternative data usage has increased inclusion by up to 33 million additional scoreable consumers.
- The middle credit score range (600-749) shrank from 38.1% in 2021 to 33.8% in 2025 according to FICO model migration data.
- FHFA validated models like VantageScore 4.0 and FICO 10T for incorporating broader data such as rent and utility history.
- Custom enterprise scoring models claim up to 10% higher predictive accuracy compared to off-the-shelf models.
- FICO maintains a dominant market share in many segments, typically mid-to-high 90%, while VantageScore gains ground through innovation.
- About 1.7 billion unbanked adults globally could benefit from alternative data-based scoring solutions.
Credit Score Ranges and Classifications
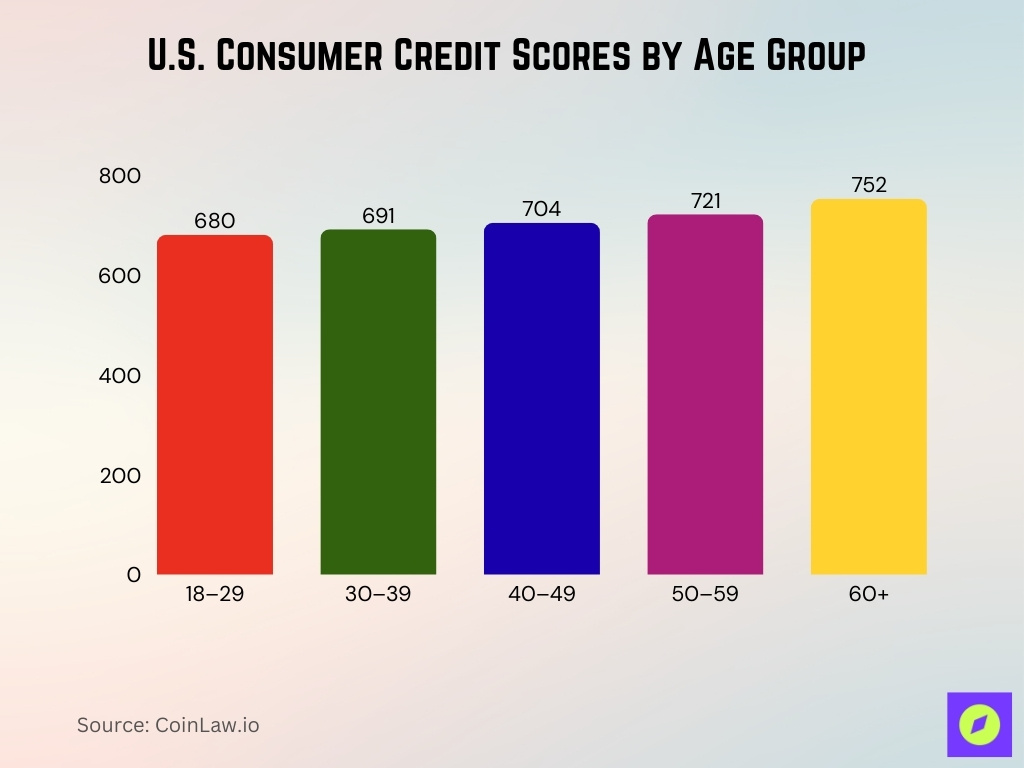
- Age-group averages in 2025, 18-29 yrs ~ 680, 30-39 yrs ~ 691, 40-49 yrs ~ 704, 50-59 yrs ~ 721, 60+ ~ 752.
- In the U.S., the standard consumer credit-score range for FICO is 300 to 850, where a higher number indicates lower credit risk.
- According to Experian, the average credit score going into 2025 is about 715, unchanged from 2023.
- According to the Consumer Financial Protection Bureau (CFPB) origination data for April 2025, Deep subprime (below 580), Subprime (580-619), Near-prime (620-659), Prime (660-719), Super-prime (720+) categories are active segments with published rates of originations and year-over-year changes.
- At the state level, the highest average credit score is in Minnesota (742), and the lowest is in Mississippi (680) as of the latest data.
- The range of classifications is important for lenders; consumers in the “good” to “very good” bands (670–799) tend to qualify for better terms, while those below 580 face limited access and higher costs.
- Some models, like VantageScore, also use the 300–850 scale, aligning with FICO to make interpretation easier for consumers.
Application vs Behavioral Scoring Models
- Application scoring relies on data at the application, like income, employment, and credit history, accounting for 40-50% of initial credit decisions.
- Lenders using behavioral scoring report up to 15% lower default rates compared to relying solely on application scoring.
- Hybrid models combining application and behavioral data improve predictive accuracy by 10-12% in pilot studies.
- Application scoring is essential for compliance with regulations like the Equal Credit Opportunity Act, covering 100% of new credit applications.
- Behavioral models increasingly incorporate non-traditional data such as digital footprints and transaction behavior for enhanced risk assessment.
- Behavioral scoring enables lenders to respond faster to changes like rising credit utilization, reducing losses by up to 12%.
- About 60-70% of lenders in 2025 use behavioral scoring models to support account management and pre-approval monitoring.
- Behavioral scoring helps detect fraud and financial anomalies early, improving lender risk management effectiveness by 20%.
- Ongoing data collection in behavioral scoring allows for dynamic credit limit adjustments, reducing risk exposure by up to 10%.
Types of Credit Scoring (Individual, Enterprise, Product-Based)
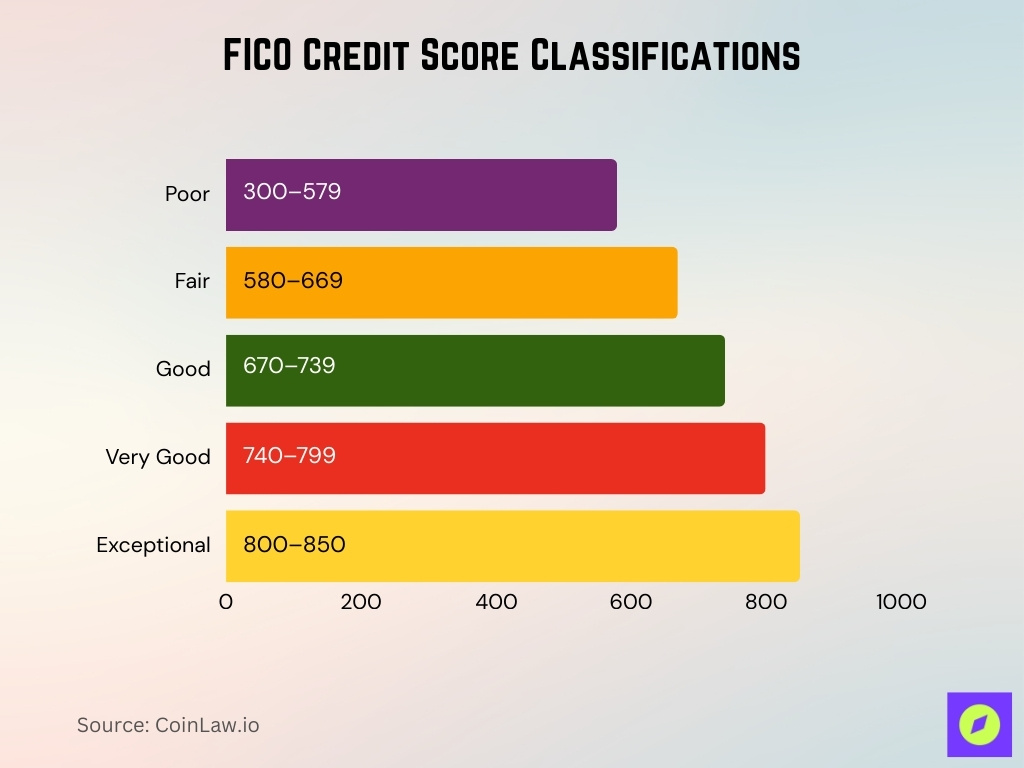
- Classification bands for FICO typically are Poor (300-579), Fair (580-669), Good (670-739), Very Good (740-799), Exceptional (800-850).
- The average individual credit score in the U.S. was 715 in 2025, according to FICO data.
- Enterprise credit scoring uses financial statements and owner guarantees, widely applied for 85% of small business loans.
- Portfolio-specific scoring models can improve risk segmentation efficiency by up to 15% for targeted product lines.
- Enterprise models integrate macroeconomic factors, e.g., commodity prices, influencing credit risk predictions by about 10-12%.
- Modular scoring engines reduce infrastructure costs by 20-30% through shared systems for individual, enterprise, and product models.
- Consumers often have multiple scores; product-specific scores can differ from individual scores by up to 40 points.
- Combining individual and product-based data enhances underwriting accuracy by up to 8% in cross-product lending.
- Nearly 70% of lenders in 2025 use modular or hybrid scoring engines for flexibility and cost savings.
- AI and data integration in scoring models have boosted predictive power by an estimated 12% in recent years.
Industry-Specific Scoring Models
- Auto financing models weigh vehicle age, mileage, and residual value, improving risk assessment by 15-18% over generic scores.
- Small-business commercial scorecards focus on cash flow and receivables, boosting predictive accuracy by up to 20%.
- Industry-specific models improve predictive performance by 5-20% compared to generic consumer scores.
- Credit-based insurance scores reduce claim risk prediction errors by about 12% versus traditional models.
- BNPL providers use short-term behavior data, increasing default prediction accuracy by 18%.
- Supply-chain financing models emphasize vendor reliability, improving risk detection by 15%.
- Equipment-leasing lenders report up to 10% better portfolio performance with specialized scoring models.
Statistical Methods Used in Credit Scoring
- Logistic regression and discriminant analysis remain core statistical methods in credit scoring for many lenders.
- Machine-learning methods like gradient boosting machines and neural networks have improved accuracy by up to 8% over traditional models.
- A Dec 2024 study reported 99.45% accuracy and 99% F1-score using a hybrid XGBoost-Deep Neural Network model.
- Scorecard performance is often measured with AUC, KS statistic (typically KS > 40 is considered strong), Gini coefficient, and PSI metrics.
- Incorporating 24-month trended utilization data in models like VantageScore improves predictive stability and responsiveness.
- Feature selection techniques include principal component analysis (PCA) and Linear Discriminant Analysis (LDA) for dimensionality reduction.
- Data splits of 70-30 or 80-20 with cross-validation are standard to avoid model over-fitting during training.
- Model monitoring triggers recalibration when PSI surpasses 0.25, ensuring model performance consistency.
- Hybrid analytics combining statistical and machine learning approaches deliver 5-8% better predictive power than logistic regression alone.
Model Risk and Accuracy in Credit Scoring
- A new default-risk model achieved an accuracy rate of 96.53% for credit default prediction.
- The same study reported a precision rate of 95% in distinguishing default vs non-default outcomes.
- Improving score precision for underserved groups could cut misclassification and approval-rate disparities by roughly 50%.
- A U.S. financial-services bank study found that AI and big data adoption reduced SME default rates by 2.7 percentage points (≈ 29.6%) after implementation.
- Model-drift monitoring is now standard; many lenders trigger recalibration when the Population Stability Index (PSI) exceeds 0.25, indicating significant population shifts.
- Vendors claim newer model versions (e.g., VantageScore 5.0) deliver up to 9% uplift in predictive performance versus earlier versions.
Use of Alternative Data in Credit Scoring
- Using retail transaction data boosted predictive power by 12-15% for thin-file consumers.
- Alternative data from utility and telecom payments expanded scoring access to 33 million underserved borrowers.
- MSMEs increasingly rely on digital payments and profile data as core alternative data in credit scoring.
- New U.S. models incorporating rental and utility data improved score inclusiveness by up to 20%.
- Vendors adopting alternative data have scored 33 million more consumers than legacy systems.
- Lenders report up to 18% better risk differentiation using alternative-data scores for thin-file individuals.
- Alternative data use leads to 10-12% higher approval rates among renters and younger borrowers.
- Some fintech firms process alternative-data scoring near real-time, reducing decision time by 30-40%.
Machine Learning & AI Adoption in Credit Scoring Models
- 72% of U.S. enterprises use machine learning for credit scoring and fraud detection.
- Automation via ML/NLP cuts approval times by up to 90% for low-risk credit applicants.
- ML models improve predictive accuracy and inclusivity for borrowers with low credit history by 7-10%.
- AI and ML adoption in financial services is growing despite increased institutional scrutiny.
- AI-driven credit scoring incorporates complex non-traditional data, enhancing risk segmentation by 12-15%.
- ML-enabled platforms reduce loan loss rates by 5-8% compared to traditional logistic regression models.
- Large U.S. banks report 30-50% faster decision-making and increased approvals using AI in small-business lending.
- ML credit models emphasize interpretability and bias reduction, critical due to protected-class regulations.
- Around 60% of lenders now employ AI/ML to augment traditional credit scoring frameworks in 2025.
- Continuous ML model training adapts to evolving market trends, improving risk detection responsiveness by 15%.
Evolution and Changes in Credit Scoring Model Practices
- Adoption of VantageScore 4.0 and FICO 10T for agency-eligible mortgages expanded significantly in 2024-25.
- Trended data over 24 months replaces single-point credit snapshots in many scoring models.
- Hybrid models combining generic scores and behavioral data deliver 20-30% cost savings for lenders.
- Portfolio monitoring now includes continuous recalibration and real-time model drift detection.
- Alternative data and new model acceptance have increased scoring access for millions of previously unscoreable borrowers.
- Regulatory approval of models for GSE mortgage use has intensified vendor competition since 2024.
- Model risk management with bias monitoring and explainability is now standard for 85% of lenders.
- Scoring is integrated with decision engines for credit limits, lifecycle accounts, and fraud analytics in over 70% of firms.
- Behavioral modeling adoption reflects dynamic consumer behavior beyond initial application data, improving accuracy by 8-12%.
- Shifts toward real-time decisioning reduced loan processing times by up to 35% in advanced lenders.
Credit Scoring in Modern Financial Systems
- U.S. consumer lending of about $4 trillion relies on credit scoring for millions of annual loan decisions.
- FinTech credit originations using integrated scoring and automation have reduced decision times from days to under 10 minutes.
- Mortgage, auto, and card lenders use scoring within a continuum of decisioning, account management, and portfolio monitoring.
- Inclusion of renters and thin-file borrowers increased by 15-20% through alternative data and newer scoring models.
- SME and business credit increasingly incorporate consumer scoring methods and alternative data for risk management.
- Real-time ML-powered scoring enables continuous account monitoring, reducing lender risk exposure by up to 12%.
- Adaptability and recalibration of scoring models are now strategic priorities amid inflation and rising consumer stress.
- Cross-channel data from digital transactions and open banking is integrated in over 65% of modern scoring models.
- Consumers expect faster decisions and transparency, boosting lender adoption of new scoring technologies by 25% yearly.
- Traditional bureau data usage declined as newer data sources expanded scoring coverage by roughly 30% since 2022.
Frequently Asked Questions (FAQs)
23% of U.S. consumers.
Approximately 33 million additional consumers.
Above 4% as of Q1 2025.
Conclusion
The landscape of credit-scoring models is evolving rapidly. Model accuracy, alternative-data inclusion, and the adoption of AI/ML are all reshaping how lenders assess creditworthiness. At the same time, regulatory pressures and broader financial-system changes are driving new practices in scoring, monitoring, and decisioning. For consumers and institutions alike, understanding these trends offers a clearer view into how credit access, cost, and risk are shifting.


