Credit card rewards programs have become a defining feature of consumer finance, shaping how millions of Americans spend, redeem, and perceive value. These incentive systems influence everything from daily grocery purchases to large travel bookings. For instance, major airlines structure loyalty tiers around credit card points, and retailers partner with banks to co‑brand cards that drive customer loyalty. Dive into the full article to see how rewards trends are evolving and what the numbers say about their future.
Editor’s Choice
- Americans earned $41.4 billion in credit card rewards and redeemed $35 billion.
- On average, general-purpose cards return about 1.6 cents per dollar spent in rewards.
- Approximately 19% of consumers’ total spending falls into reward‑eligible categories.
- The Consumer Financial Protection Bureau (CFPB) recorded over 1,200 complaints involving rewards misadministration.
- WalletHub rated Wells Fargo as having the best credit card rewards program in 2025, with a score of 93%.
- In a Bank of America survey, 70% of cardholders said cash back is the most valued reward.
- The CFPB has issued warnings to issuers to avoid devaluing rewards via hidden terms.
Recent Developments
- The CFPB warned card issuers that devaluing or revoking rewards may breach consumer law protections.
- Reward-related consumer complaints rose 71% in 2023 compared to pre-pandemic years.
- 18% of major card issuers raised redemption thresholds or tightened terms due to cost pressures last year.
- Regulatory scrutiny has led 58% of issuers to update transparency on restrictions and bonus conditions.
- Complaints about “bait and switch” in co-brand transfer programs increased by 52% year-over-year.
- 31% of issuers now use dynamic rewards, where categories adapt to user spending patterns.
- As of 2024, 44% of issuers added retention perks like annual credits to reduce user churn.
- 59% of new rewards card launches now advertise flat-rate cash back (2–4%) over complex rotating categories.
- Transparency initiatives accelerated, with 73% of issuers simplifying expiration and restriction disclosures in the past 18 months.
- In response to the CFPB, 26% of issuers reviewed their program terms for compliance in 2023–2024.
Why Americans Use Credit Cards
- 63% of Americans say they use credit cards to earn cashback and rewards, showing strong engagement with loyalty programs.
- 51% cite convenience as a primary reason, highlighting credit cards’ role in streamlining everyday purchases.
- 32% admit they can’t afford to pay upfront, relying on credit cards for essential purchases due to cash flow issues.
- 11% need credit to keep up with bills, indicating a segment facing financial stress or debt reliance.

Credit Card Rewards Program Participation Rates
- Approximately 71% of Americans carry at least one rewards credit card.
- Since 2020, more than three-quarters of general‑purpose credit cards issued have been rewards cards.
- Younger generations show especially high participation: 41% of Gen Z and 40% of Millennials cite rewards as a major reason to use credit.
- Among active credit card users, about 80% say rewards influence how much they spend on cards.
- In a 2025 survey, over 65% of cardholders said they almost always use cards tied to rewards programs.
- Participation is higher among higher-income cohorts (top 20%): more than 85% hold at least one rewards card.
- Among cardholders aged 60+, rewards card ownership lags, around 55%, primarily due to a preference for low-fee or secured cards.
- Regional variation, in states like New York and California, rewards card penetration exceeds 75%, while in rural states like West Virginia, it hovers near 60%.
Average Rewards Earned per Cardholder
- On average, credit card users earn about $43.40 in rewards per billing cycle, corresponding to ~4% of spending in rewardable categories.
- Reward‑earning spending accounts for ~19% of total spending, while non‑reward spending makes up ~81%.
- For some premium cardholders, the average reward value can exceed $200–300 per month, depending on usage and bonuses.
- One industry estimate, rewards programs return roughly 1.6 cents per dollar on general-purpose cards.
- Among the top 10% of spenders, rewards earned can reach $1,000+ annually.
- In 2022, total rewards issued to consumers in the U.S. amounted to $41.4 billion, which, divided by active participants, implies several hundred dollars per person per year.
- Variation by card type, travel, or premium cards often yields 2–3× more rewards per dollar than basic or no-fee cards.
- The standard deviation on rewards earned is high; many cardholders earn minimal rewards (< $10) while heavy users earn hundreds or thousands.
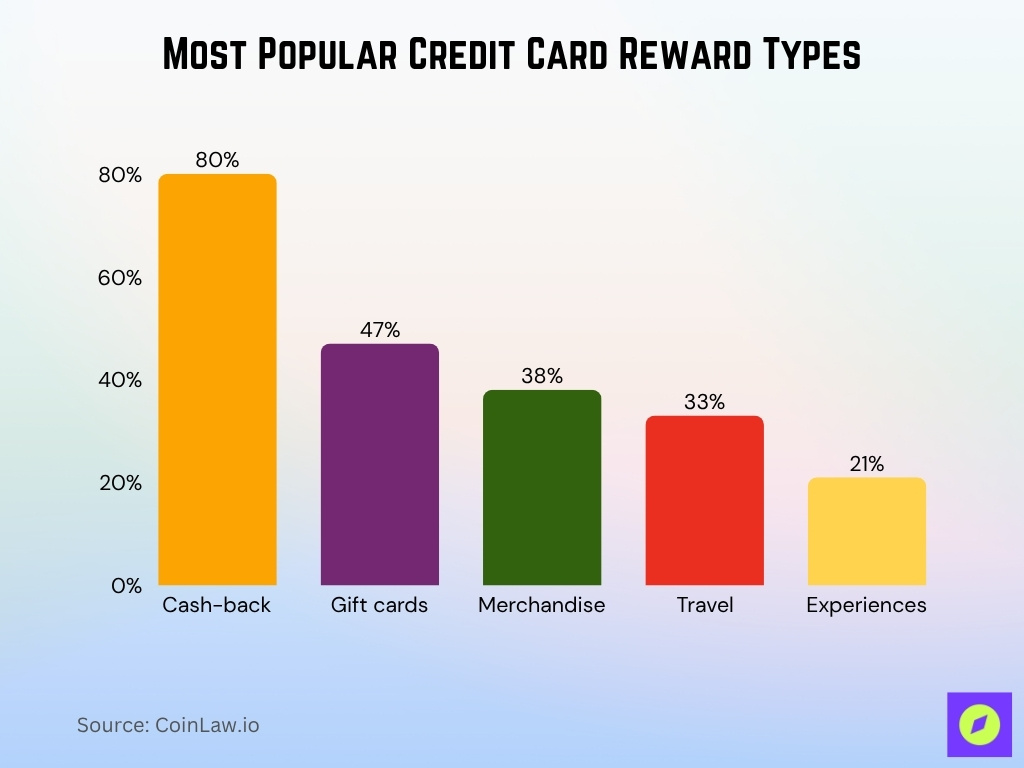
Most Popular Credit Card Reward Types
- 80% of credit card users prefer cash-back, making it the most sought-after reward type.
- 47% choose to redeem points for gift cards, offering flexible shopping options.
- 38% use rewards for merchandise, indicating interest in physical goods redemption.
- 33% apply their points toward travel, showing continued value in flights and hotels.
- Only 21% redeem rewards for experiences, such as concerts or exclusive events.
Value of Credit Card Rewards Points
- Many general rewards cards return ~1.6 cents per dollar spent in value.
- In 2022, of the $41.4 billion in rewards earned, $21 billion came from points, $15.2 billion from cash back, and $5.2 billion from miles.
- Issuers often discount transfers or travel redemptions by 10–30% behind the scenes.
- Premium and travel cards sometimes offer 2–5× points multipliers on select categories like dining or airfare.
- Some programs now price 1 point at 0.8 to 1.25 cents, depending on redemption path.
- The liability reserves for unredeemed rewards held by major issuers have grown sharply, indicating many points never get converted to value.
- Issuers often adjust “value per point” when they change partners or transfer ratios, effectively devaluing users’ points.
- Advanced cardholders may optimize “sweet spot redemptions” where point value approaches 2 cents+ under ideal conditions.
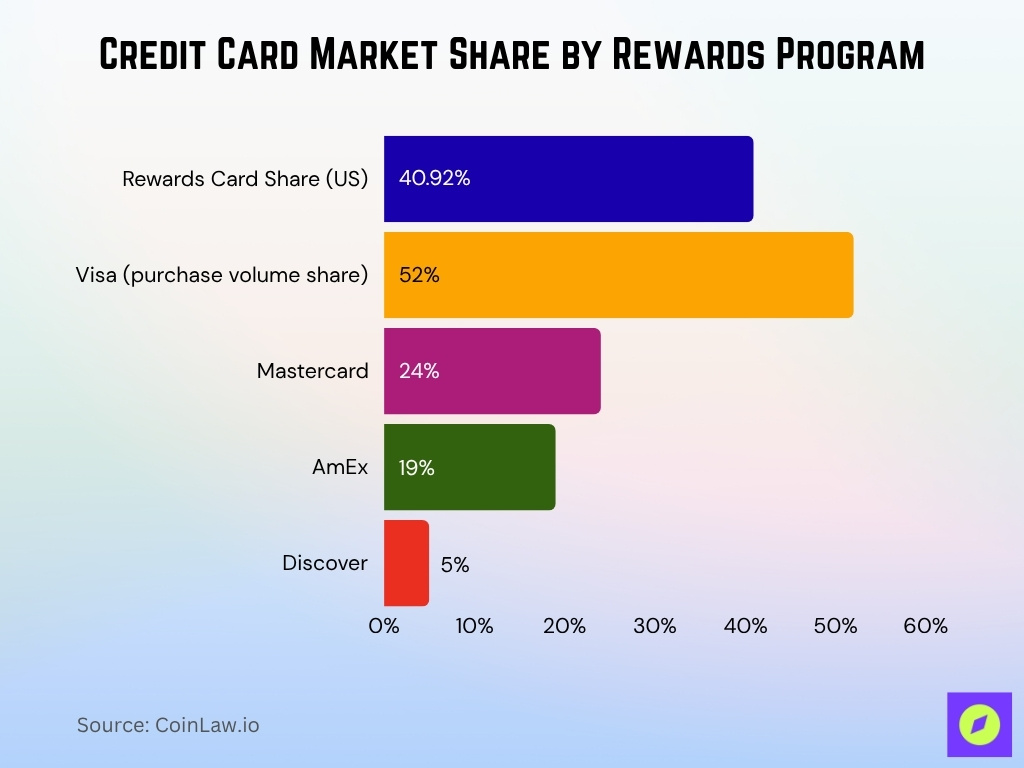
Credit Card Market Share by Rewards Program
- The rewards card segment made up ~40.92% of the U.S. credit card market by 2024 in terms of dollar volume.
- Among card networks, Visa accounts for ~52% of U.S. credit purchase volume, Mastercard ~24%, AmEx ~19%, and Discover ~5%.
- The top five issuers, Chase, AmEx, Citi, Capital One, and Bank of America, control more than half of the credit card market in volume.
- Six large issuers paid out $67.9 billion in reward redemptions and partner payouts in 2022.
- The card rewards services industry is projected to $952 million in the U.S. in 2025.
- The loyalty management market was ~$12.07 billion globally in 2024, with North America holding over a third of that share.
- The broader credit card market is expected to grow at ~9.5% CAGR from 2025 to 2032.
- Issuers frequently bundle rewards with co‑brand or transfer partners to gain share over pure cash-back competitors.
Demographic Trends in Rewards Card Usage
- About 71% of Americans report having a rewards, points, or cashback credit card.
- 70% of cardholders said cash back is the perk they value most.
- 41% of Gen Z and 40% of Millennials cite rewards as a major factor in card usage decisions.
- Only 16% of Gen Z redeem points immediately, and over 10% say they don’t redeem at all.
- More than 80% of users receive reward offers, and ~72% redeem within 90 days.
- Those with higher credit scores (superprime) redeem the lion’s share of rewards; 82% of redemptions came from this cohort.
- Subprime cardholders forfeit rewards more often; they lose ~7% of rewards vs. ~4% average.
- Older cardholders tend to prefer straightforward, simple rewards, while younger users are more open to experiential rewards.
Average Number of Rewards Cards per Person
- On average, U.S. consumers have ~3.7 active credit cards in use.
- This is a decline from ~4.1 a decade ago.
- The average number of cards held is ~4.1.
- For Gen Z, the average is about 2.3 cards, while Millennials average ~3.7.
- Baby Boomers may carry 4.8 cards on average in some datasets.
- Some sources simplify to “about 3 cards per person” as a baseline.
- Many “power users” hold 5–10 cards for strategy, though this is a minority.
- Consumers often streamline their card portfolio, focusing on their top 2–3 reward cards to minimize complexity and fees.
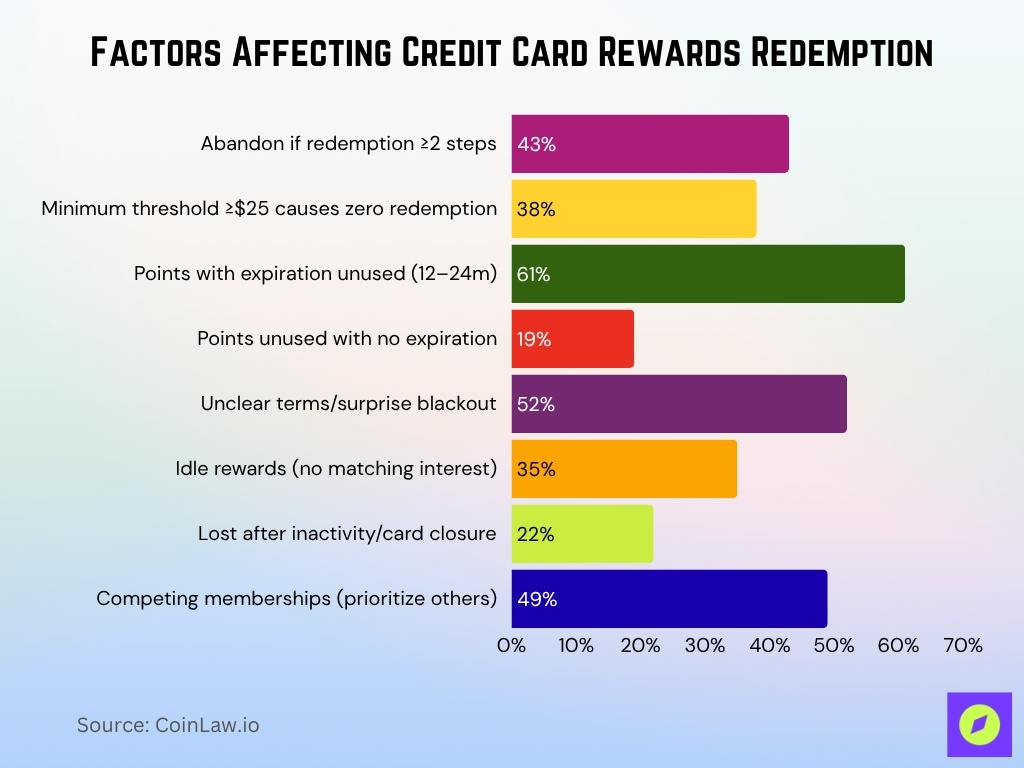
Factors Affecting Rewards Redemption
- 43% of users abandon rewards if the redemption process requires more than two steps.
- Programs with minimum redemption thresholds of $25+ cause 38% of users to never redeem their rewards.
- 61% of points in programs with 12–24 month expiration windows expire unused, versus 19% with no expiration.
- 52% of participants cite unclear terms or surprise blackout dates as reasons for not redeeming rewards.
- When the value per point is less than $0.01, redemption drops by 27% compared to higher-value programs.
- 35% of members say rewards stay idle if available options don’t match their interests, such as a lack of travel or gift card choices.
- 22% report losing points after account inactivity or card closure without warning.
- In households with five or more loyalty memberships, 49% deprioritize credit card rewards for other loyalty programs.
Average Credit Limit on Rewards Credit Cards
- $8,172 is the average credit limit across all U.S. credit cards, while rewards credit cards average $11,820.
- Premium rewards cards often have limits of $20,000 to $50,000 for prime users.
- Subprime rewards cardholders typically receive limits as low as $2,600 to $4,200.
- 29% of issuers automatically review and increase limits for active rewards cardholders annually.
- Income influences credit limits, with users earning $100K+ receiving limits over $40,000 on average.
- Some issuers temporarily raise limits by 14% to support large signup bonus spending thresholds.
- Credit history impacts limits, with applicants having 790+ scores seeing average initial limits of $18,000.
- Aggregate available credit on rewards cards is 41% higher than on no-fee or secured cards.
- For prime users, mid-tier rewards cards offer average limits of $9,600 to $15,400.
- High utilization risk is lower among rewards cardholders due to 34% higher available aggregate credit.
Credit Card Sign‑Up Bonus Statistics
- In 2022, the average sign‑up bonus value was $326, up from $276 in 2019.
- Many premium travel cards now offer 75,000 to 125,000 points after required spending within the first 3–6 months.
- Some mid-tier cards offer $200 to $300 bonus cash or points after modest minimum spend.
- Issuers increasingly require 3–4× normal category spend to unlock the bonus, making them harder to attain.
- Welcome offers now often come with tiered bonus windows, higher tiers if you spend more.
- Sign‑up bonuses constitute up to 20–40% of the total value a new cardholder receives in the first year.
- In a cooling economy, issuers are testing reduced bonus amounts or stricter thresholds to manage costs.
Percentage of Unredeemed Rewards
- About 23% of cardholders reported not redeeming rewards they were entitled to in the past year.
- A similar survey found 23% left rewards unused in a 12‑month period.
- In 2022, six major U.S. issuers spent $67.9 billion on reward redemptions and partner payouts, implying that many rewards did get redeemed, unused share remains significant.
- Between 20% and 30% of rewards are unredeemed across many programs, depending on the ease of redemption issues.
- Among lower‑income households (< $50,000), 31% left rewards unused; among high earners, only ~12% did.
- Subprime card users have a higher breakage rate; some reports estimate ~7% of rewards are forfeited, versus ~4% for prime users.
- Older cardholders are more likely to let rewards lapse compared to some younger cohorts.
- One cause is confusion or complexity; ~9% of non‑redeemers say rewards are too confusing, ~11% say they didn’t know how to redeem.
Regional Differences in Credit Card Rewards Usage
- 71% of North American users redeem credit card rewards for local retail purchases, compared to 32% for travel.
- In Asia-Pacific and Latin America, 64% of cardholders opt for immediate redemption on groceries or mobile top-ups instead of travel.
- Urban U.S. states like California and New York have 23% higher rewards card penetration than rural states.
- Coastal and tourist-heavy regions show 49% more travel-point redemptions than inland states.
- In international programs, 87% of users in Latin America prefer cash back, avoiding complex redemptions.
- 45% of Europeans and 56% of Canadians value non-expiring points, versus 22% of U.S. consumers.
- High-inflation U.S. states see 36% greater frequency of reward redemptions as users offset rising costs.
- 29% of U.S. issuers offer regionally targeted categories like gas or groceries, boosting redemption in high-cost states.
- In Southeast Asia, 54% of cardholders say rewards are a key factor influencing credit card choice.
- Canadian users report 17% more frequent redemptions for flexible spending than for travel rewards.
Generational Differences in Rewards Program Preferences
- 62% of Gen Z say they prefer experiences or subscriptions as rewards, compared to 49% of Millennials and just 23% of Boomers.
- 41% of Gen Z would pick points or travel perks with slightly lower cash value, while only 18% of Gen X say the same.
- 69% of Gen X and 74% of Boomers favor simple cash back or statement credits over other reward options.
- 89% of Boomers redeemed rewards at least once last year, compared to 76% of Millennials and 68% of Gen Z.
- Just 16% of Gen Z typically redeem rewards immediately; over 10% of Gen Z admit they never redeem their points.
- Among those who don’t redeem, 58% of Boomers blamed “forgot” or “confusion,” versus just 29% of Millennials.
- 51% of Millennials and 46% of Gen Z use three or more rewards cards; only 19% of Boomers do.
- 34% of Gen Z and 29% of Millennials reported switching loyalty programs in the past year, compared to 9% of Boomers.
- Gen Z is 2.4x more likely than Boomers to value gamified features in rewards apps.
- On average, Gen X holds rewards points nearly twice as long before redeeming compared to Millennials.
Frequently Asked Questions (FAQs)
About 23 % of cardholders reported they did not redeem credit card rewards in the past year.
There were about 631 million active credit card accounts in 2025.
The average redemption rate is roughly 49.8 % across loyalty and rewards programs.
Approximately 71% of Americans say they have a rewards, points, or cashback credit card.
Conclusion
Credit card rewards programs remain a central battleground in consumer finance. With welcome bonuses often exceeding $300, breakage still at ~20–30%, and generational and regional behaviors diverging, the data offers no single playbook. Issuers are pushing personalization, tiered retention incentives, and easier redemption paths to sustain engagement. Meanwhile, consumers must stay sharp about redemption terms, expiration, and true point value.


