Imagine walking into a bustling store where payment lines are nonexistent, transactions are seamless, and customer satisfaction is at its peak. This is not a vision of the distant future; it’s the reality that modern Point-of-Sale (POS) systems are enabling across industries. As technology reshapes how businesses operate, the POS ecosystem continues to evolve rapidly. This article delves deep into the latest POS statistics, offering insights into market trends, mobile advancements, and software innovations, guiding businesses to harness the potential of this vital technology.
Editor’s Choice
- The global POS market is valued at $33.41 billion in 2024 and projected to grow further in 2025 at a CAGR of 16.1%.
- The mobile POS (mPOS) market is projected to exceed $40 billion by 2026, reflecting strong global growth in mobile payment adoption.
- Mobile POS was used by over 68% of SMEs globally in 2025, with strong sales growth.
- The tablet POS systems market is valued at $5.16 billion in 2024, with continued growth expected in 2025.
- Soft-POS transactions globally reach $23.9 billion in 2025, driven by mobile-first adoption.
POS Market Share by Enterprise Size
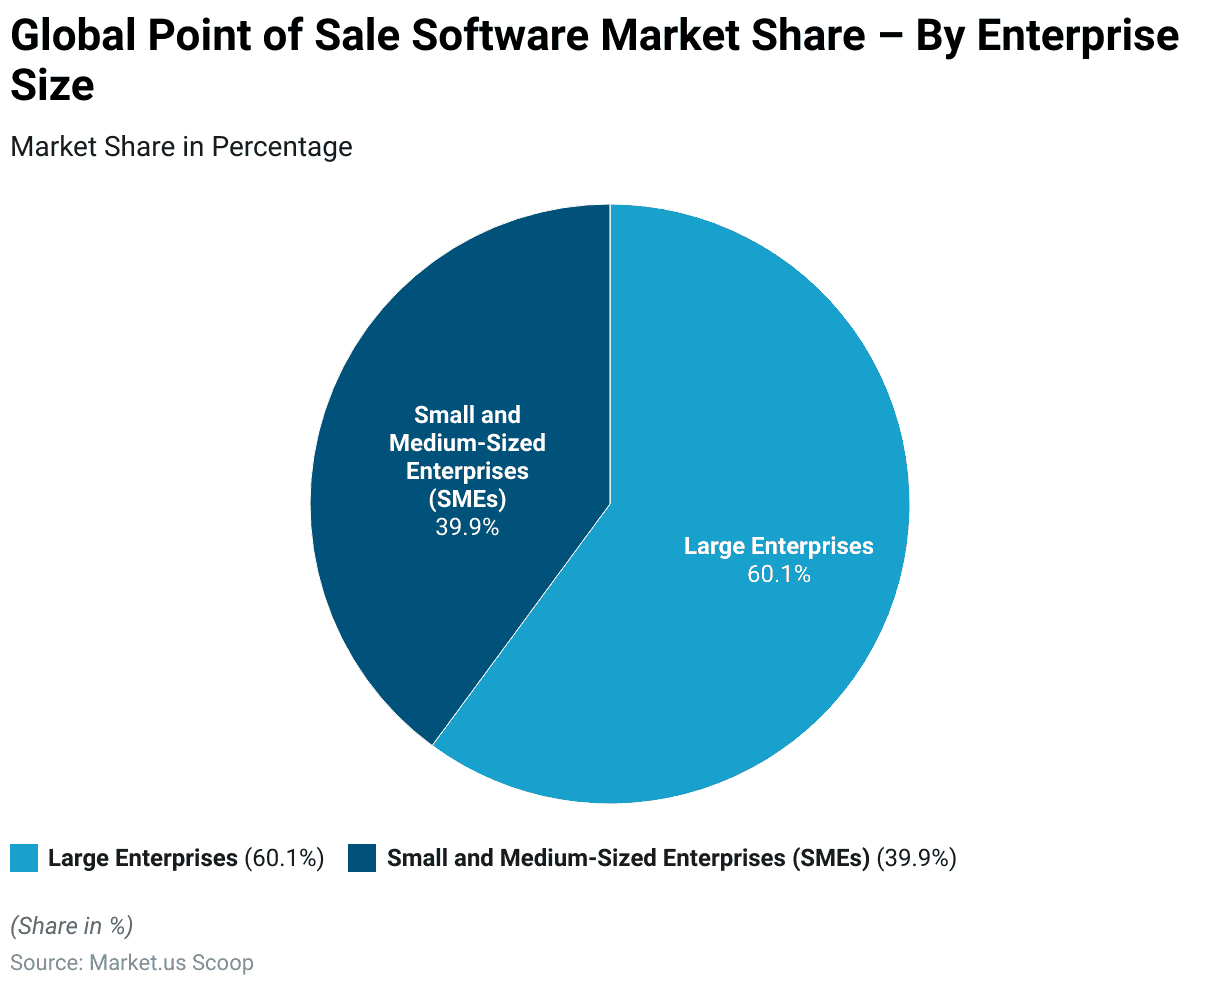
- Large Enterprises account for 60.1% of the global POS software market, reflecting dominant investment in scalable, integrated systems.
- Small and Medium-Sized Enterprises (SMEs) hold 39.9% of the market, highlighting growing adoption but slower upgrade cycles compared to large firms.
Current State of the POS Market
- The US POS terminals market is estimated at $29.11 billion in 2025, propelled by mobile and contactless payment technologies.
- The European POS terminals market is projected to $32.33 billion in 2025 amid digital payment adoption and regulatory momentum.
- Emerging markets in India and Southeast Asia are recording double-digit SME‑driven growth in 2025.
- Global e‑commerce POS transactions account for approximately 30 % of total POS sales in 2024, continuing upward trends into 2025.
- Adoption of omnichannel POS systems rises by roughly 48 % among mid‑sized businesses in 2025.
- Urban areas see cashless POS usage near 80 % in 2025, while rural areas remain mixed in payment methods.
- POS hardware market, including terminals and handheld devices, is on track to reach $78 billion by 2025.
- POS systems have evolved into comprehensive business solutions, enhancing customer experience and operational efficiency in 2025.
Mobile Point-of-Sale Statistics
- The global mPOS market is valued at $49.7 billion in 2025, with strong year-over-year growth.
- Mobile POS devices in circulation reached 113 million in 2025.
- Mobile POS solutions continue to reduce transaction costs for retailers in 2025.
- mPOS device market projected at $37.2 billion in 2025 with steep growth across regions.
- Tablet-based mPOS systems account for 58% of retail and hospitality usage in 2025.
- Hardware maintains dominance in the mPOS sector with a 61.8% share in 2025.
- North America holds the largest regional mPOS market share at 35.2% in 2025.
POS System Market Share by Provider
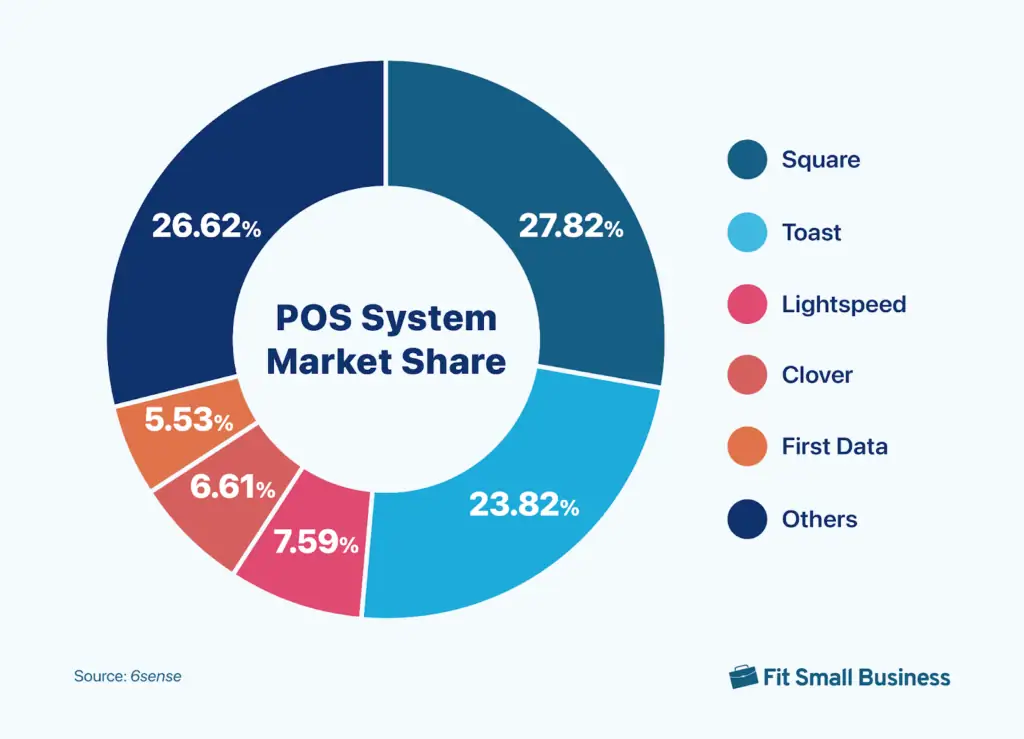
- Square dominates with a 27.82% market share, making it the most widely used POS system, especially among small and mobile-first businesses.
- Toast holds a strong 23.82%, driven by its tailored solutions for restaurants and food service businesses.
- Lightspeed commands 7.59% of the market, appealing to niche retailers and cloud-focused merchants.
- Clover accounts for 6.61%, favored for its flexible hardware offerings and omnichannel capabilities.
- First Data captures 5.53%, maintaining presence among traditional and legacy enterprise systems.
- Other POS providers collectively represent 26.62%, highlighting a fragmented space with rising niche and regional players.
Retail POS Statistics
- Global retail POS terminals market projected to reach $29.7 billion in 2025, reflecting steady growth.
- Retailers using real-time tracking saw stockouts drop 37% and customer satisfaction rise by 24% in 2025.
- Cloud-based POS adoption in retail climbed to 72% in 2025, boosting scalability and integration.
- Retailers leveraging unified commerce via POS reported a 9.5% revenue increase in 2025.
- Omnichannel retailing integration through POS systems met 68% of consumer expectations in 2025.
- The mobile POS segment in retail was valued at $55 billion in 2025, underscoring rapid adoption.
- The POS software market reached $16.4 billion in 2025, highlighting increased reliance on digital tools.
Point‑of‑Sale in the Restaurant Industry
- The restaurant POS terminals market is valued at $26.04 billion in 2025, continuing robust expansion.
- Quick‑service restaurants (QSRs) report an average 25% reduction in order wait times with mobile POS systems.
- 83% of US restaurants now use cloud‑based POS solutions in 2025.
- Online ordering integrations with POS account for about 55% of restaurant sales by 2025.
- 58% of diners prefer restaurants offering digital payment options through POS systems.
- Studies suggest that digital tip prompts in POS systems can increase tip amounts, but the exact uplift varies by context; some quick-service restaurants report increases of 10–15%.
- Real‑time inventory tracking via POS software cuts food waste by 12% in restaurant operations.
Top POS Service Priorities Among Retailers
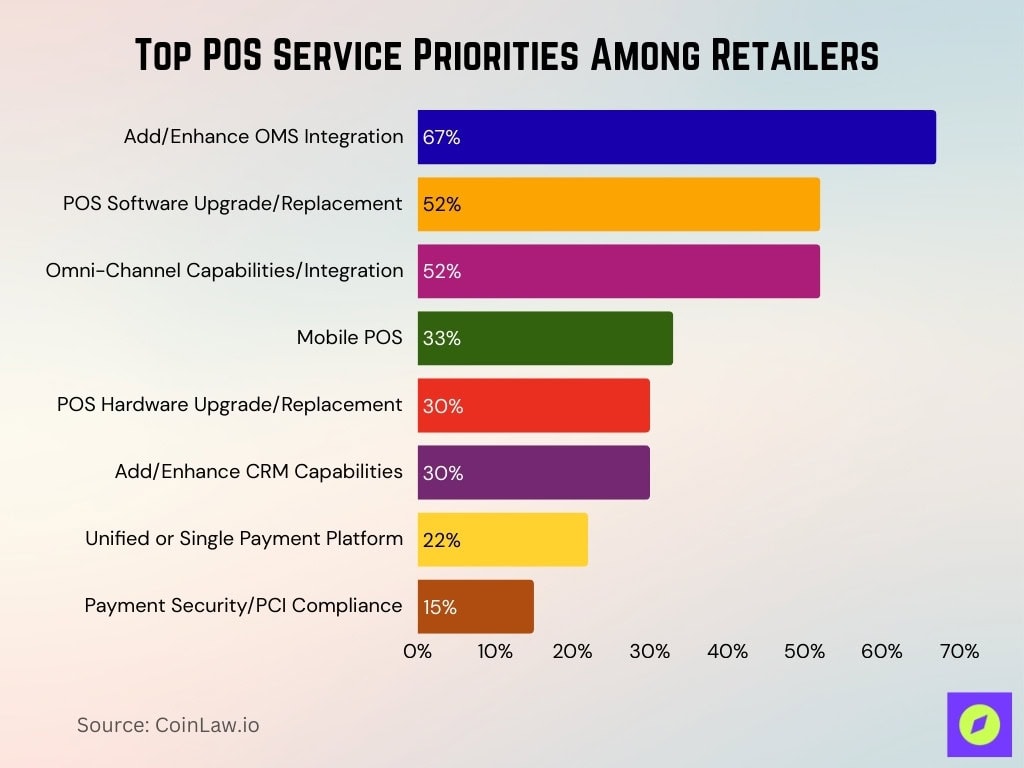
- 67% of North American retailers prioritize adding or enhancing OMS integration, making it the most critical POS service need.
- 52% are focused on POS software upgrades or replacements, aiming to modernize and optimize system performance.
- 52% also emphasize omni-channel capabilities, reflecting the growing need for unified customer experiences across physical and digital channels.
- 33% are investing in mobile POS solutions, supporting flexibility and faster transactions on the sales floor.
- 30% plan POS hardware upgrades or replacements, pointing to aging devices and new tech adoption.
- 30% seek to add or improve CRM capabilities, showing a rising demand for customer engagement tools.
- 22% aim to implement a unified or single payment platform to simplify and streamline transactions.
- 15% still prioritize payment security and PCI compliance, suggesting either existing coverage or gaps in attention.
Market Concentration & Characteristics
- 50% of businesses surveyed in 2025 cite vendor lock-in as a concern when selecting a POS system.
- Open‑source POS software adoption increased by 14% in 2025, giving businesses more customization and integration control.
- POS system implementation costs range widely in 2025, from about $70 for startups to $5,200 for larger setups, depending on hardware, software, and scale.
- 68% of enterprises prioritize customer‑centric POS features like loyalty programs and CRM integrations in 2025.
- Integrated POS systems are helping businesses achieve about a 20% improvement in cross‑channel visibility in 2025.
Point‑of‑Sale Software Statistics
- The global POS software market is valued at $13.53 billion in 2025, with strong growth ahead.
- Cloud‑based POS software is preferred by 74 % of businesses in 2025, favored over on‑premises systems.
- 41 % of US retailers had upgraded their POS software by 2025 to include AI‑driven analytics and better inventory tracking.
- 52 % of chain retailers utilize multi‑location management tools in their POS software as of 2025.
- Adoption of customizable POS software features increased by 27 % in 2025, supporting niche industries like hospitality and wellness.
- 65 % of businesses prioritize cybersecurity features such as end‑to‑end encryption in POS software in 2025.
- Mobile POS software apps have grown by 45 % in 2025, enabling on‑the‑go payment processing and sales management.
Limitations of POS Data
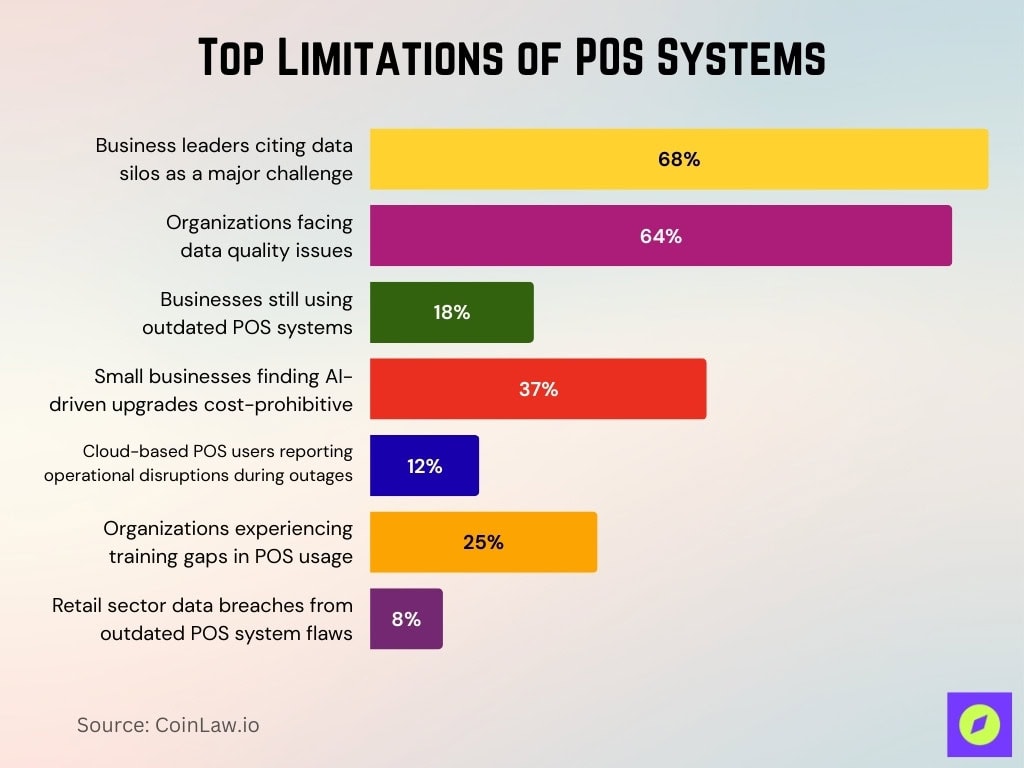
- 68% of business leaders in 2025 cite data silos as a major challenge that hinders cross-departmental data utilization.
- 64% of organizations face data quality issues, which complicate decision-making and analytics.
- About 18% of businesses in 2025 still use outdated POS systems that struggle to integrate with modern platforms.
- 37% of small businesses find AI-driven POS analytics upgrades cost-prohibitive.
- 12% of cloud-based POS users report operational disruptions during outages because of limited offline functionality.
- 25% of organizations in 2025 experience training gaps in POS system usage, reducing data interpretation and utilization.
- 8% of retail sector data breaches in 2025 stem from security flaws in outdated POS systems.
Product and Component Insights
- Touchscreen displays remain dominant in POS systems, featured in about 85 % of new hardware in 2025, reflecting their continued popularity.
- High-speed thermal receipt printers are still essential, with roughly 70 % of businesses choosing them in 2025.
- Barcode scanners integrated with POS systems continue to boost checkout speed by approximately 18 % enhancing customer satisfaction in 2025.
- IoT-enabled components like RFID scanners see 22 % adoption in retail environments by 2025, highlighting growing demand for real-time data.
- The average cost for a complete POS setup, including touchscreen, printer, scanner, and cash drawer in 2025, ranges between $1,200 and $2,000 per unit, depending on configuration.
- Energy-efficient components are gaining ground as 38 % of POS hardware now incorporates sustainability-focused design in 2025.
Deployment and End‑Use Insights
- Retail remains the top end‑use sector for POS systems with approximately 52 % of global installations in 2025, reflecting its leadership role.
- Restaurants and QSRs account for roughly 28 % of POS deployments in 2025, driven by features like table‑side payments and integrated online ordering.
- Cloud‑based deployments surpassed traditional setups, now representing about 67 % of all POS installations in 2025.
- SMEs continue to lead adoption with a 25 % year‑over‑year increase in POS deployments in 2025, driven by affordability and user‑friendly interfaces.
- The healthcare sector shows rising POS usage, with adoption climbing 19 % in 2025 for patient payments and data handling.
- Hybrid deployment models combining cloud and on‑premises capabilities saw a 30 % rise in 2025, offering enhanced flexibility and scalability.
- The education sector is emerging as a growing market for POS systems, particularly in cafeterias, bookstores, and ticketing, with an approximate 14 % CAGR into 2025.
The Value of POS Data
- 74% of businesses in 2025 report using POS data to optimize inventory management and prevent stockouts.
- 64% of retailers leverage customer purchase history from POS data to enhance personalized marketing campaigns in 2025.
- 58% of businesses use real‑time POS sales data to adapt pricing strategies, boosting revenue during peak seasons.
- POS analytics helped reduce wasted inventory by 22% in 2025 by identifying underperforming products.
- Cross‑channel POS data integration improved supply chain efficiency by 15% in 2025, streamlining order fulfillment.
- Adoption of AI‑driven POS analytics increased by 29% in 2025, enabling businesses to predict sales trends and customer behavior.
- POS systems with embedded fraud detection capabilities helped reduce losses by 18% in 2025 across industries like retail and hospitality.
Technological Innovations
- AI-powered POS systems are now built into more than 50 % of modern platforms offering predictive analytics and dynamic pricing in 2025.
- The global biometric POS market is expected to surpass $8.5 billion by 2026, driven by fingerprint and facial recognition technologies improving payment security.
- Blockchain-enabled POS systems are being trialed, with early adoption at around 12 % in high-risk sectors like finance and healthcare in 2025.
- Voice-activated POS interfaces are featured in about 18 % of new installations in fast-paced retail and hospitality settings in 2025.
- While AR is emerging in luxury retail for immersive experiences, its integration into POS systems is still in the early adoption phase, with limited implementation and minimal public data on penetration rates.
- IoT-enabled POS systems support real-time inventory tracking and are adopted by about 30 % of retailers in 2025.
- 5G-ready POS systems are gaining momentum, providing faster transaction speeds and improved connectivity for remote and mobile operations in 2025.
Recent Developments
- Square and Clover launched new AI-enabled POS software in 2025, boosting predictive analytics and dynamic pricing capabilities.
- Over 50% of POS systems in 2025 now support biometric payment authentication, including fingerprint and facial recognition, advancing security.
- About 88% of POS terminals worldwide in 2025 now support NFC payment technology.
- Walmart rolled out fully automated POS systems and cut average checkout time by 50%, setting a new efficiency benchmark in retail.
- PayPal is integrated with major POS platforms to enable seamless cross-border payments, strengthening global e-commerce operations.
- In Europe, the deployment of 5G-powered POS systems improved transaction speeds by up to 70%, enhancing mobile and remote performance.
- Google launched a beta AI-driven POS analytics tool that promises real-time customer insights and a new era of data analysis for retailers.
Conclusion
Businesses now have unprecedented opportunities to streamline operations, enhance customer experiences, and drive revenue growth as the POS landscape evolves. Companies can stay competitive in an increasingly digital marketplace when they adopt cloud-based solutions, leverage AI-powered analytics, and integrate innovative technologies. Challenges such as data silos and upgrade costs still exist, but modern POS systems deliver long-term benefits that outweigh those limitations. Companies that embrace these trends don’t just follow a strategy; they take a necessary step toward success in today’s fast-paced business environment.


