The rise of liquid staking and restaking marks a turning point in how blockchain networks generate yield and mobilize capital. Liquid staking lets holders lock assets yet retain a tokenized claim, enabling use in DeFi; restaking takes that a step further by re‑utilizing staked assets to secure additional protocols. In institutional crypto treasuries and DeFi yield strategies, these models are already reshaping participation and reward dynamics. The following sections explore the key numbers behind this shift and invite you to dive deeper into the full article.
Editor’s Choice
- The total value locked, TVL, across liquid staking protocols hit a record ~$86.4 billion in mid‑2025.
- Liquid staking accounts for about 27% of total DeFi TVL in early 2025.
- On Lido, the flagship liquid staking platform, one protocol’s TVL reached around $41 billion.
- In Q3 2025, liquid‑staking and restaking combined represented over 45% of the TVL on Ethereum equivalents.
- The global DeFi market’s TVL rebounded to around $170 billion by September 2025, showing maturity in infrastructure.
Recent Developments
- The SEC published a detailed policy statement on liquid staking on August 5, 2025, giving clarity that non‑managerial functions by providers may avoid securities classification.
- Restaking protocols, particularly EigenLayer, grew rapidly, reaching about $18 billion and peaking above $20 billion TVL by mid‑2025.
- Institutional flows into crypto staking strategies increased, driven by regulatory clarity and yield differentials compared with traditional finance.
- The broader DeFi market TVL recovered to ~$170 billion by September 2025, indicating that staking‑related capital is regaining momentum.
- Total value locked in ETH liquid staking tokens stood at ~$46 billion as of August 2025.
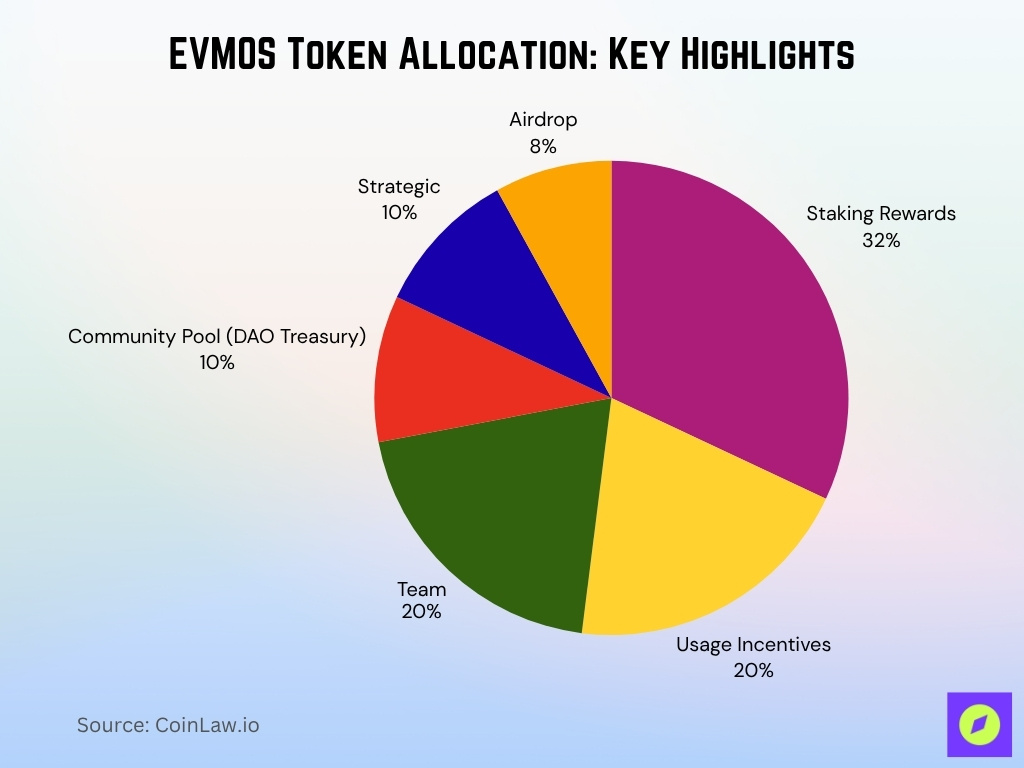
EVMOS Token Allocation: Key Highlights
- 32.0% of the total EVMOS supply is dedicated to Staking Rewards, encouraging long-term network participation and validator engagement.
- 20.0% goes to Usage Incentives, promoting ecosystem activity, dApp usage, and user onboarding through reward-based mechanisms.
- The Team receives 20.0%, reflecting their role in development, operations, and long-term alignment with the protocol.
- 10.0% is allocated to the Community Pool (DAO Treasury), enabling governance-driven funding for future proposals and ecosystem growth.
- Another 10.0% is set aside for Strategic partnerships, likely aimed at institutional support, exchange listings, and advisory relationships.
- Only 8.0% is reserved for the Airdrop, highlighting a relatively small initial distribution to early users or participants.
Global Liquid Staking Adoption Overview
- In Q2 2025, DeFi TVL was ~$124 billion, with liquid staking making up ~27% of this total.
- By Q3 2025, on Ethereum‑equivalent environments, staking plus restaking exceeded 45% share of TVL.
- The adoption of liquid staking extends beyond Ethereum; Solana, Cosmos, and other chains have growing LST use.
- Emerging markets are participating, including Latin America, which saw ~150% growth in DeFi activity in one year.
Key Growth Trends in Liquid Staking
- Platform TVLs are climbing: for example, Lido’s TVL surged ~95% in July 2025 alone, moving from ~$21 billion to ~$41 billion.
- The Ethereum staking rate exceeded 27% in early 2025, with some projections suggesting growth toward 30–35% by late 2025, depending on circulating supply assumptions.
- Ethereum staking yields averaged ~4.6% in 2025, making them appealing relative to U.S. bank rate averages.
- The velocity of LSTs is high, concentrated among large addresses, indicating deep DeFi reuse.
- Institutional investor surveys show 67% of professional players intend to increase crypto holdings in 2025.
- Regulatory signals are reducing uncertainty, one reason the sector in the U.S. reached $45 billion in TVL.
- Cross‑chain expansion is accelerating as other chains develop LST issuance.
- Methodology transparency varies across protocols, with only ~46% offering verifiable TVL data.
- LSTs are integrating more deeply into DeFi, including lending markets and liquidity pools.
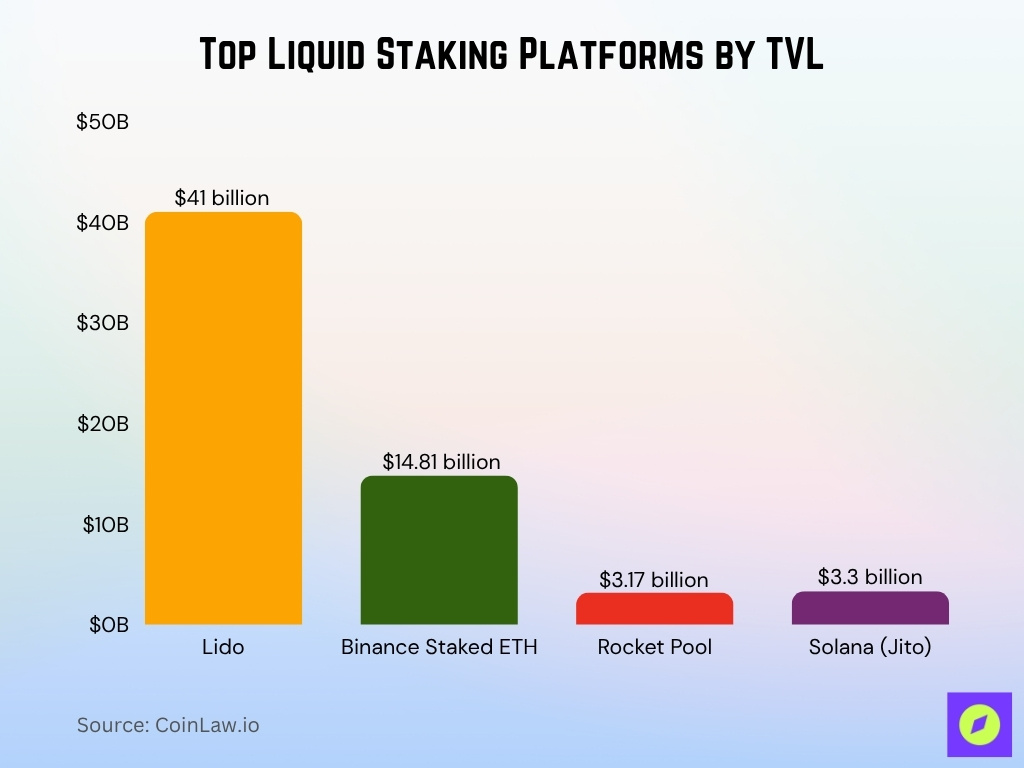
Leading Liquid Staking Platforms by TVL
- Lido‘s TVL was reported at ~$41 billion in August 2025, making it the leading liquid staking platform.
- Other major platforms include Binance Staked ETH (~$14.81 billion) and Rocket Pool (~$3.17 billion).
- Solana platforms like Jito report TVL of around $3.3 billion.
- On Ethereum‑equivalent networks in Q3 2025, liquid staking plus restaking represented more than 45% of TVL.
- Institutional‑oriented liquid staking platforms with compliance and custody features are gaining traction.
- Liquidity exit mechanics and unstaking queue lengths are key differentiators.
- Governance structure, exit queues, and depeg risk increasingly influence platform selection.
Market Share of Liquid Staking vs. Native Staking
- As of 2025, 33.84 million ETH (~27.57%) is natively staked on Ethereum’s PoS system.
- In Q2 2025, liquid staking captured ~27% of all DeFi TVL.
- In Q3 2025, staking plus restaking represented over 45% of Ethereum‑equivalent chain TVL.
- Native staking yields tend to be lower and less risky than liquid staking yields.
- A growing percentage of stakers prefer LSTs over purely native staking.
- Comparisons remain imperfect due to transparency gaps in methodology.
Institutional Adoption of Liquid Staking
- A 2025 survey found that 86% of institutional investors have exposure to digital assets or plan to allocate during 2025.
- 59% intend to allocate more than 5% of their AUM to crypto.
- Institutional crypto inflows were estimated at over $21 billion in Q1 2025, driven by increased participation in ETFs and staking strategies, per industry analysts.
- Digital asset AUM exceeded $235 billion by mid‑2025.
- 87% of institutions believe crypto is critical to future investment strategy.
- Institutions are using LSTs and restaking protocols to generate yield while maintaining liquidity.
- Regulatory clarity in 2025 accelerated institutional adoption significantly.
- Institutions increasingly stake, liquid‑stake, and restake instead of simply holding crypto.
- Corporate treasuries are integrating LSTs to mix yield generation with liquidity.
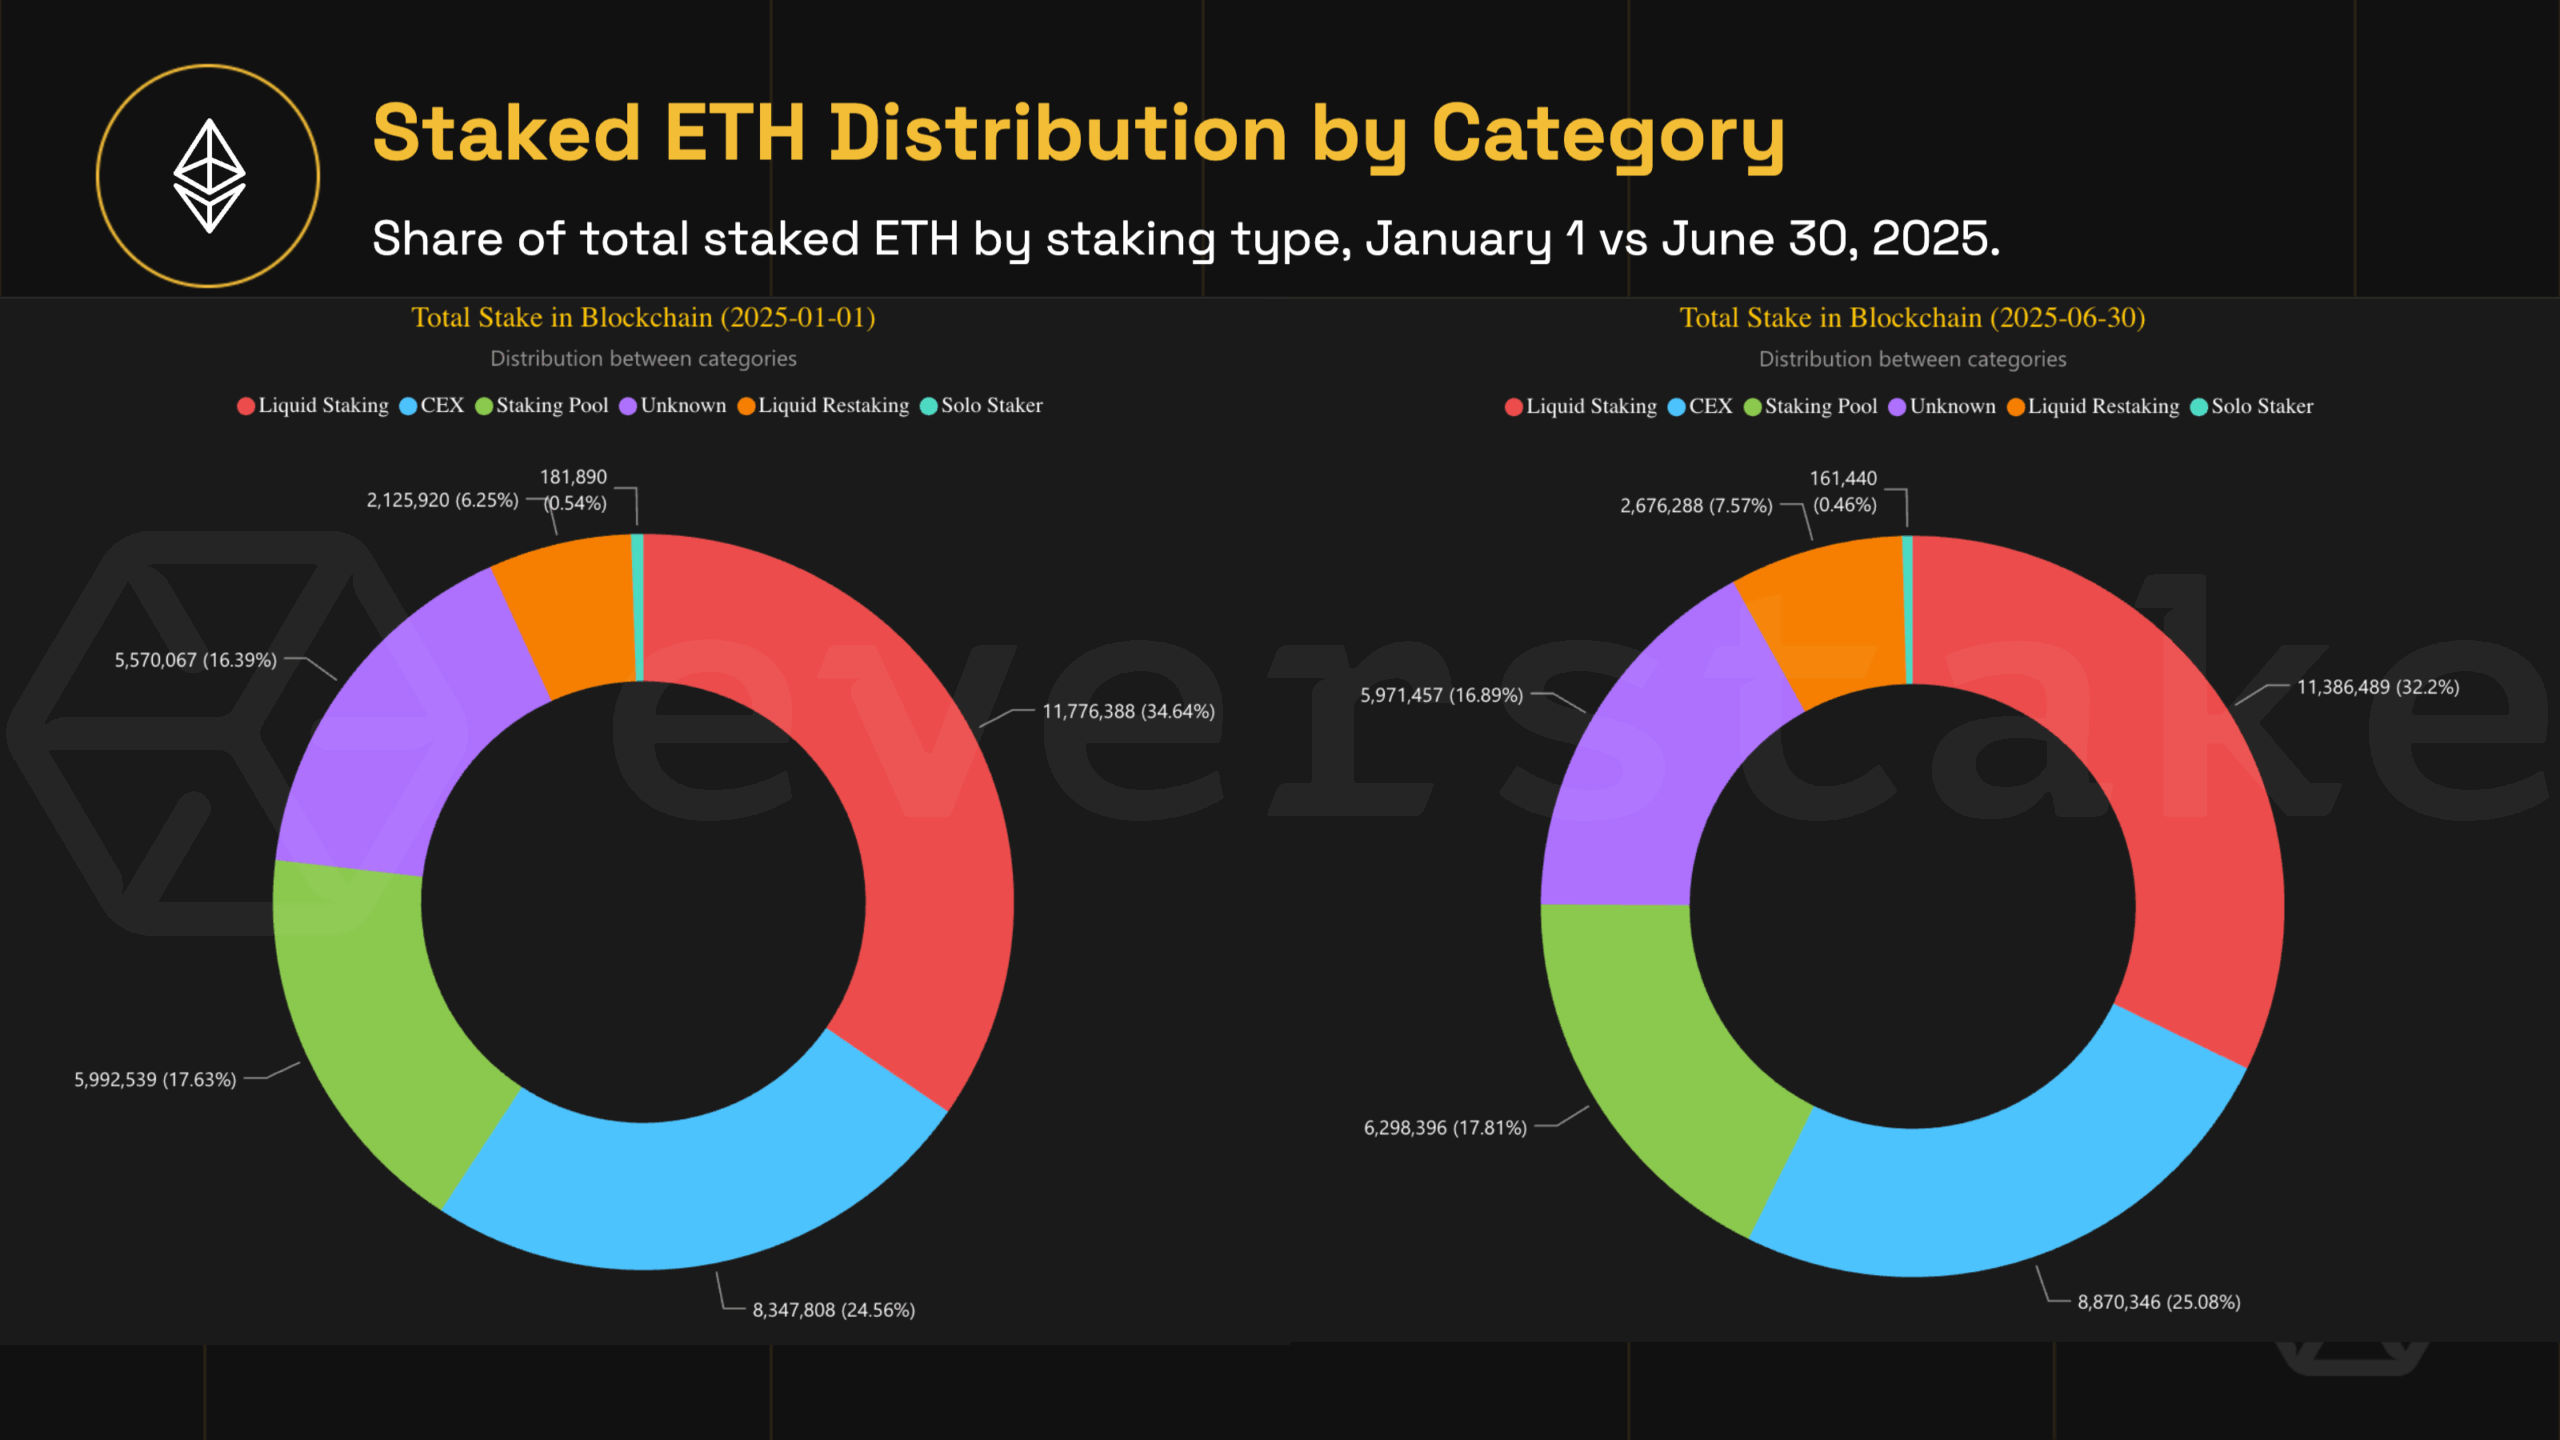
Staked ETH Distribution
- As of January 1, 2025, Liquid Staking led with 34.64% of all staked ETH, totaling 11.78 million ETH. By June 30, this slightly declined to 32.2% or 11.39 million ETH.
- CEX staking increased from 24.56% (8.35 million ETH) to 25.08% (8.87 million ETH), showing a steady presence in custodial staking.
- Staking Pool participation rose from 17.63% to 17.81%, reaching 6.30 million ETH in June from 5.99 million ETH in January.
- The Unknown category accounted for 16.39% in January (5.57 million ETH) and rose slightly to 16.89% (5.97 million ETH) by June.
- Liquid Restaking saw the largest relative growth, jumping from 6.25% (2.13 million ETH) to 7.57% (2.68 million ETH), highlighting increased reuse of staked assets.
- Solo Staking decreased marginally, from 0.54% (181,890 ETH) to 0.46% (161,440 ETH), suggesting a continued shift toward pooled or custodial staking solutions.
Liquid Staking Token, LST, Distribution Statistics
- Liquid staking accounted for 31.1% of all staked ETH in early 2025 (≈ 10.53 million ETH).
- Centralized exchanges held ~24% of staked ETH (~8.13 million ETH).
- Liquid restaking represented 6.6% of staked ETH (~2.24 million ETH).
- On Solana, liquid staking TVL was ~$10.5 billion in mid‑2025, accounting for about 13% of the SOL supply.
- LST velocity is high among large addresses.
- Liquidity and redemption complexity remain risk factors.
- Non‑rebasing LSTs are replacing rebasing versions for better DeFi compatibility.
Restaking Adoption Growth Rates
- EigenLayer reached over $18 billion in restaking TVL in 2025.
- Bitcoin restaking platforms, such as Babylon and BounceBit, grew from under $100 million to more than $3 billion in TVL by mid-2025.
- Ethereum liquid staking exceeded $24 billion in TVL by August 2025.
- Restaked ETH increased from ~6.3% to ~7.6% of all staked ETH in early 2025.
- Capital efficiency is a major driver of restaking growth.
- Risk premia for restaking are being priced into yields.
- Institutions are experimenting with layered yield strategies through restaking.
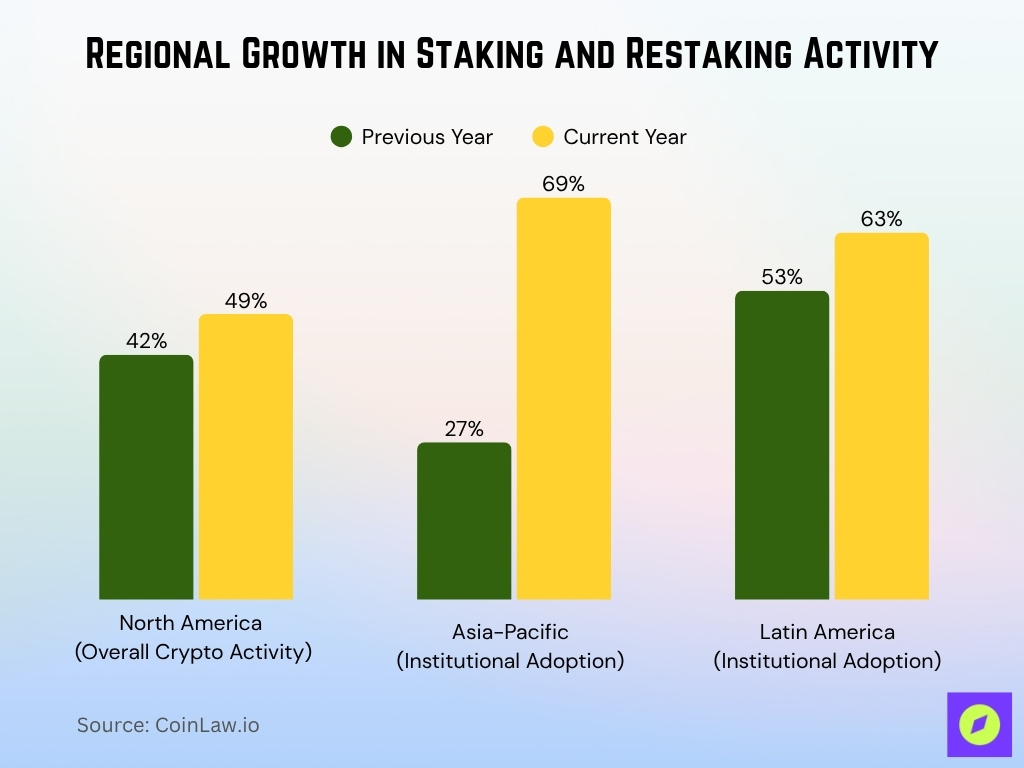
Regional Trends in Staking and Restaking
- North American crypto activity grew from 42% to 49% year‑over‑year.
- Asia‑Pacific institutional adoption rose from 27% to 69%.
- Latin America grew from 53% to 63% in institutional adoption.
- Emerging markets show rising participation in staking and liquid staking.
- Europe remains a hub due to regulatory clarity.
- Restaking is globally distributed rather than region‑specific.
Leading Restaking Protocols and TVL Comparative Data
- EigenLayer had TVL above $18 billion in 2025.
- Bitcoin restaking ecosystems reached $3.1 billion.
- Combined LST market cap was ~$86.4 billion in 2025.
- Restaking remains smaller but is gaining market share rapidly.
- Some platforms combine liquid staking and liquid restaking into unified systems.
- Lido remains the largest liquid staking protocol at ~$41 billion TVL.
- Restaking carries stacked risk relative to native staking.
- Cross‑chain and chain‑specific restaking ecosystems are emerging.
Yield Performance: Liquid Staking vs. Restaking
- The average ETH staking yield in 2025 was about 4.6% across major platforms.
- Effective LST yields in DeFi can exceed 8.5% through layered yield strategies.
- Restaking protocols report yield growth rates exceeding 4,000% in some ecosystems.
- Yield from restaking can multiply base staking rewards by as much as 3x through composability.
- Institutions pursuing layered yield strategies allocate over 60% of their stake to restaking systems.
- Restaking yields an average of 3%-5% additional returns beyond base staking yields.
- Liquid staking yields remain stable at around 4-6% APY, while restaking yields are more volatile.
- Yield optimization protocols enable some users to achieve effective returns near 12% APY.
- Higher yields from restaking come with increased slashing and smart contract risks, estimated to impact up to 10% of staked capital in volatile phases.
Risk Metrics and Security Incidents
- In early 2025, crypto thefts hit $2.17 billion, surpassing 2024 totals.
- Ethereum recorded 21 slashing events in Q2 2025.
- Fewer than 500 validators have been slashed on Ethereum out of ~1.2 million active validators.
- A September 2025 incident saw an attacker compromise a staking provider and withdraw client funds.
- Slashing commonly results from validator misconfiguration or downtime.
- Only ~46% of staking, liquid staking, and restaking protocols disclose verifiable risk metrics.
- Smart contract and operator errors caused over $1 billion in losses from 2022 to 2025.
- Research warns of inflation‑related instability in staking systems.
Staking Rewards and Compounding Effects
- The average ETH reward rate over the 180 days ending September 28, 2025, was 2.98% APY.
- Staking rewards boosted indexed returns from 60% to 72% in a one‑year sample.
- Networks such as Solana and Cardano offered 6%–7% APY ranges in 2025.
- Real reward rates were roughly ETH 4.11% and Cosmos 6.95%.
- Compounding rewards through LSTs increases earned yield.
- LSTs can be used in DeFi to layer additional yield.
- Higher reward environments carry higher risk layers.
- Networks adjust inflation and reward rates to stabilize staking ecosystems.
Adoption by Blockchain Network, ETH, Solana, Cosmos, etc.
- ETH had 37 million ETH staked in 2025, around 30% of supply.
- ADA had ~71% of supply staked, around $11.2 billion.
- Solana reported ~$7.4 billion staked, ~69% of supply.
- Cosmos had ~60% of its supply staked, around $3.4 billion.
- Avalanche showed ~53% supply staked, about $2.5 billion.
- Tokenomics and network design influence staking ratios.
- LSTs boost adoption on these networks via liquidity and DeFi functionality.
- Smaller chains with higher yields also carry higher risk exposure.
LSDfi and Liquid Restaking Use Cases Statistics
- The Liquid Restaking Market was valued at $2.35 billion in 2024 and is projected to reach $25 billion by 2035 with a CAGR of 24.0%.
- stETH and wstETH show high on-chain velocity with micro-velocity analysis supporting active usage and transfer dynamics.
- LSTs account for more than 51% of total DeFi TVL, reflecting widespread use as collateral and yield instruments.
- Some LSDfi protocols have yields around 11.8% APY on instant-unstaking LST offerings.
- Top LSDfi protocols hold over 74% of the total LSDfi market share by TVL, with leading platforms showing over $317 million TVL individually.
- Restaking allows staked assets to earn multiple reward streams, boosting DeFi composability and liquidity.
- On-chain collateralized lending in crypto reached $26.5 billion in Q2 2025, an increase of 42% year-over-year, where LSTs play a significant role.
- Over-collateralization ratios in DeFi lending dropped from 163% to 151% in 2025, indicating more capital efficiency, partly driven by LST collateral use.
Slashing Events & Loss Statistics in Restaking
- Ethereum recorded 21 slashing events in Q2 2025, impacting validator rewards.
- A mass slashing event in Sept 2025 penalized 39 validators simultaneously due to operator errors.
- Solana had fewer than 484 validators slashed across approximately 131 incidents by mid-2025.
- Smart contract exploits caused over $1 billion in cumulative losses from 2022 to 2025 across DeFi.
- Restaking increases slashing risk by layering multiple service responsibilities on staked assets.
- Most slashing events result from configuration errors, not intentional malicious actions.
- Stakers bear the financial losses from slashing in many protocol architectures.
- Ethereum validators have faced around 474 total slashing incidents since staking inception.
- Lost ETH per slashed validator in mass events averages about 0.3 ETH (~$1,300) plus inactivity penalties.
Withdrawal/Liquidity Patterns for LSTs and LRTs
- Over 61% of stETH and wstETH liquidity is retained while earning staking rewards across major DeFi platforms.
- Large addresses contribute to roughly 73% of total LST turnover on chains like Ethereum.
- On Solana, select platforms offer near-instant unstaking with yields around 11.8% APY.
- Native unstaking delays average 21 days, while LSTs enable economic exit without such waits.
- The liquidity depth of LST markets has grown by 42% year-over-year, but remains concentrated in the top 10% holders.
- Approximately 1.5 million wstETH tokens are held in liquidity pools, representing major liquidity sources.
- Liquid restaking tokens (LRTs) reached a TVL of about $15 billion in 2025, creating new liquidity loops.
- Restaking protocols have boosted capital efficiency, increasing the utilization rate of staked assets by 35%.
- Turnover rate of LST holdings among large institutional wallets is around 18%, indicating active trading.
- LRT adoption is projected to grow at a CAGR of 27% from 2025 to 2030, reflecting growing market acceptance.
Frequently Asked Questions (FAQs)
About 30% of DeFi TVL.
Approximately 14.2 million wallets.
About $86.4 billion.
Approximately $66.86 billion.
Conclusion
The data show that liquid staking and restaking are no longer fringe experiments; they are evolving into core infrastructure in the crypto‑ecosystem. Key networks, ETH, Solana, and Cosmos, demonstrate high staking participation. Reward rates remain modest but meaningful, while liquidity innovations via LSTs and LRTs are enabling new yield strategies. At the same time, the risk landscape, slashing, protocol losses, and operator issues remain real and should shape any investor’s calculus. As regulatory clarity improves and institutional flows grow, this sector looks ready for further growth, but participants must stay vigilant.


