The workforce size of Payoneer Global Inc. (NASDAQ: PAYO) is under the spotlight as the company scales across borders and technologies. This matters because its headcount reveals how Payoneer is investing in growth, global operations, and emerging markets. For example, the hiring surge in engineering underpins its real-time payments infrastructure, while expanding regional hubs supports its push into Asia-Pacific SMBs. Read on to see detailed statistics that map Payoneer’s evolving employee landscape and what it means for the broader fintech sector.
How Many People Work At Payoneer?
- 2,407 total employees as of December 31, 2024 (≈ +11.1% year-over-year).
- Revenue per employee was approximately $422,619 in 2024.
- Payoneer’s headcount growth is projected at approximately 3.0% for 2025, based on internal forecasts and publicly guided hiring trends.
- The new hire-to-total workforce ratio has been about 5% in recent trends.
- Regional revenue mix: Greater China ~$340.8 million, EMEA ~$253.1 million in 2024.
Recent Developments
- Payoneer reported Q2 2025 revenue excluding interest income up 16% YoY.
- Company issued guidance for full-year 2025 revenue of $1.04 billion–$1.06 billion, showing its workforce supports ongoing growth.
- A $300 million share repurchase authorization was announced in August 2025, indicating profitable scale and a stable head-office workforce.
- The employee count as of December 2024 stood at 2,407, which is an 11.1% increase from 2023’s 2,167.
- Payoneer noted over $7.0 billion in customer funds under management as of year-end 2024, implying growth in support and operations staffing.
- Despite global economic headwinds, the company maintained hiring momentum, especially in tech and operations.
- The firm expanded regional hubs and regulatory licenses in key markets such as China and Singapore.
Payoneer’s Roadmap to Profitable Growth
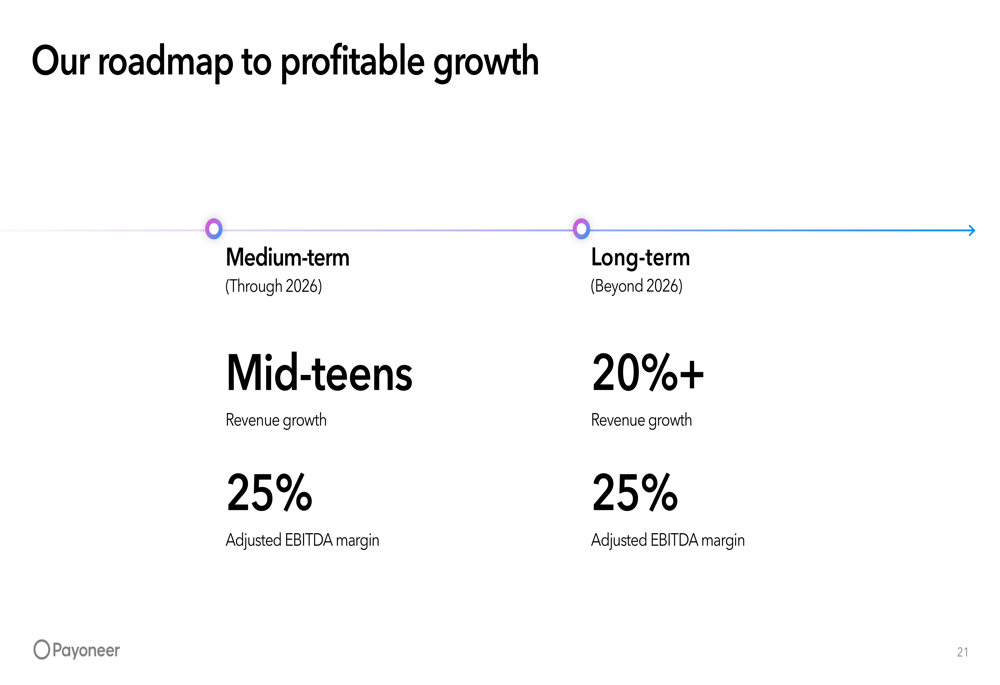
- Medium-term (Through 2026): Payoneer targets mid-teens revenue growth, signaling steady expansion through its global payments network.
- Adjusted EBITDA Margin: Expected to reach 25%, reflecting strong operational efficiency and profitability discipline.
- Long-term (Beyond 2026): The company projects 20%+ revenue growth, driven by scaling digital payments, B2B services, and cross-border platforms.
- Sustained Profitability Goal: Maintains a 25% adjusted EBITDA margin even in the long term, emphasizing consistent profit generation alongside growth.
- Strategic Implication: Payoneer aims to transition from scaling mode to a sustained high-margin growth phase, balancing innovation with cost efficiency.

Payoneer’s Current Team (Key People)
- John Caplan – Chief Executive Officer and Director. Appointed CEO in March 2023, he is responsible for setting the company’s global strategic vision and driving operational execution.
- Bea Ordonez – Chief Financial Officer. Leads financial planning, risk management, and reporting, supporting Payoneer’s growth and efficiency objectives.
- Arnon Kraft – Chief Operating Officer. Oversees global operations, process optimisation, and service delivery across Payoneer’s international network.
- Assaf Ronen – Chief Platform Officer. Focuses on the scalability, security, and innovation of Payoneer’s platform infrastructure and user experience.
- Tsafi Goldman – Chief Legal & Regulatory Officer. Manages legal strategy, regulatory compliance, and corporate governance in a complex global environment.
- Adam Cohen – Chief Growth Officer. Responsible for driving market expansion, partnerships, and revenue growth across Payoneer’s global footprint.
- Micheal Sheehy – Chief Compliance Officer. Ensures adherence to AML/KYC standards and risk-mitigation protocols across Payoneer’s business operations.
- Elana Brickner – Chief People Officer. Heads talent strategy, organisational culture, and employee engagement to support Payoneer’s global teams.
- John Davis – Chief Transformation Officer. Leads change-management, strategic initiatives, and alignment of business operations with long-term goals.
- Rich Williams – Chairman of the Board (from 2025). Guides oversight, board strategy, and governance matters for Payoneer’s leadership team and shareholders.
Headcount by Department
- Approx 19% of the workforce in Marketing & Product (~232 employees).
- Engineering portion ~225 employees.
- Sales & Support ~202 employees.
- Business Management ~162 employees.
- Finance & Administration ~110 employees.
- Operations ~78 employees.
- HR ~48 employees.
- Risk, Safety & Compliance ~46 employees.
- IT ~39 employees, “Other” category ~63 employees.
Key Hubs and Regional Offices
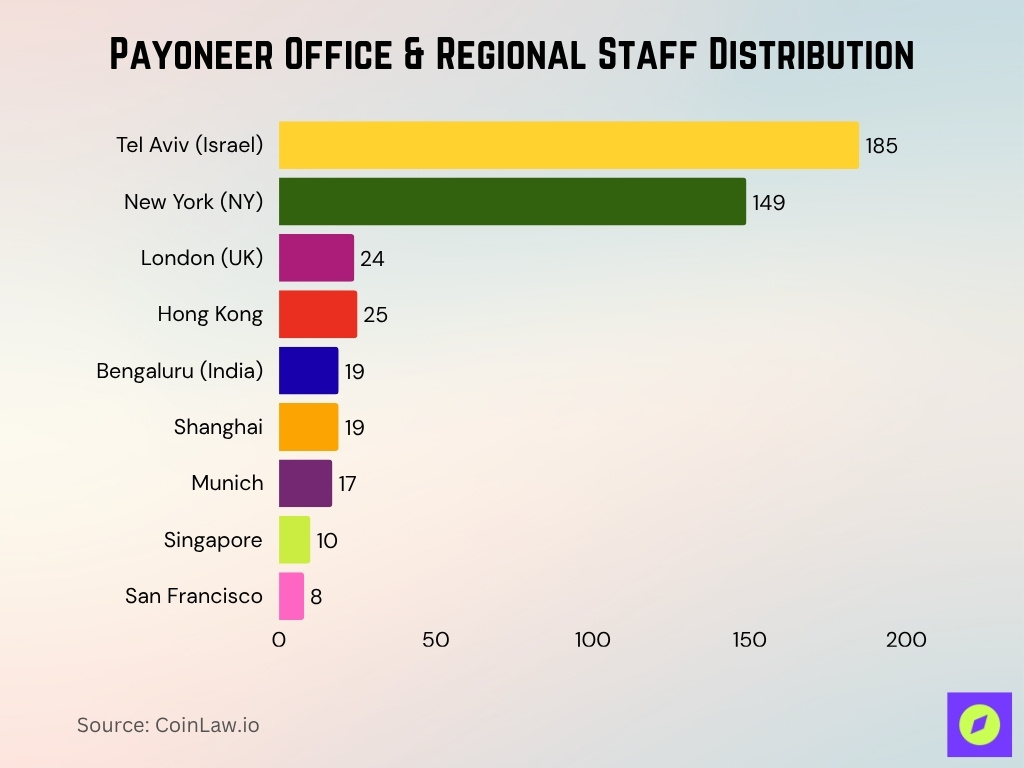
- The New York, NY office appears consistently as one of the largest hubs, with ~149 employees.
- Tel Aviv (Israel) is identified as the largest named hub with ~185 employees, underscoring the company’s strong presence in the Israeli tech ecosystem.
- Other regional offices include Bengaluru (India ~19 employees), London (UK ~24), Hong Kong (~25), Shanghai (~19), Munich (~17), Singapore (~10), and San Francisco (~8).
- The company operates in 25+ global offices and supports 17 languages.
- Payoneer states that it has teams in “30+ countries, speaking over 20 languages.”
- The regional spread supports the cross-border payments business model, aligning hubs with key markets in EMEA, APAC, and the Americas.
- Future growth will emphasise non-U.S. regions to capture global SMB flows.

New Hires and Turnover Statistics
- In August 2025, Payoneer reported 156 new hires versus 130 departures, a net gain of 26 employees (≈ 2.2% growth).
- In 2022, Payoneer planned to cut ~9% of employees (≈210 staff) in Q3 to realise cost savings.
- The company disclosed an 11.1% YoY headcount increase from Dec 2023 to Dec 2024 (2,167 to 2,407 employees).
- While exact turnover rates are not broadly published, the new hire/departure numbers imply a turnover (attrition + departures) of at least ~10.8%.
- The compliance training case-study indicated successful engagement of large frontline teams, which can help reduce early-tenure exits.
- Given the fintech industry benchmark for annual turnover in technology roles is approximately 13-20%, Payoneer’s implied rate appears modest in comparison.
- The variation in reported total employee counts (1,205 vs 2,407) indicates data sources differ by scope, which complicates precise turnover tracking.
Diversity and Gender Representation
- Payoneer claims “50/50 gender representation across Payoneer.”
- Women hold only ~4-5% of CEO roles in the cross-border payments industry.
- Female leadership representation increased to 46% in 2025.
- The company hosts teams across “30+ countries, speaking over 20 languages,” supporting a broad-based diversity focus.
- Employee rating data cite Diversity, Equity & Inclusion as 4.0/5 in reviews.
- Payoneer’s freelancer survey shows women charge ~$22/hour vs $24/hour for men (~92 ¢ for every $1).
- Payoneer’s foundation invests in opportunities “for women and girls in tech and entrepreneurism/business.”
Payoneer Revenue Breakdown
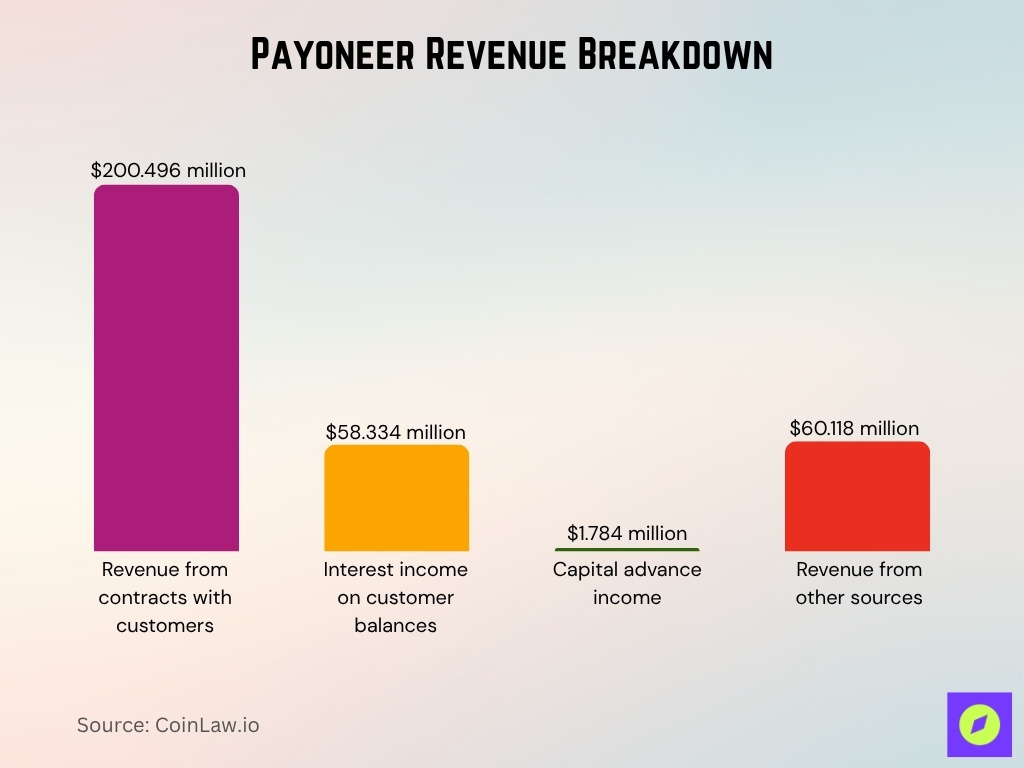
- $200.496 million came from revenue from contracts with customers, representing the core business driver tied to transaction and service fees.
- Interest income on customer balances contributed $58.334 million, highlighting the company’s growing returns from customer-held funds.
- Revenue from other sources added $60.118 million, showing diversification beyond traditional payment operations.
- Capital advance income accounted for a smaller $1.784 million, but remains part of Payoneer’s broader lending initiatives.
- The data underscores a balanced mix between transactional revenue and financial income, strengthening Payoneer’s profitability outlook.

Employee Satisfaction Rates
- 75% of employees surveyed would recommend Payoneer to a friend.
- 61% of employees report a positive business outlook for the organisation.
- Ratings by category: Work-Life Balance 4.0/5, Culture & Values 3.8/5, Compensation & Benefits 3.4/5.
- The company emphasises “career development and continuous learning opportunities” as part of its people strategy.
- Some reviews highlight concerns around manager communication, promotion opportunities, and consistent experience across geographies.
Training and Professional Development
- On average, each employee completed ~29 hours of training in 2025.
- The company “invests in our employees’ growth, providing career development and continuous learning opportunities.”
- In the compliance training programme, time to author new learning content was cut by more than 50%.
- Employees in the training cohort achieved average assessment scores of around 90%.
- 52% of workers globally feel they need to learn new skills within the next year to continue their careers.
- Training and development are part of Payoneer’s “people strategy” for global growth and capability building.
- The expansion into new products and geographies suggests that training focus has been sharpened to support “tech evolution” and cross-border operations.
- The mix likely covers compliance, technical skills, language/localisation, and leadership development, given the global footprint.
- The emphasis on continuous learning aligns with Payoneer’s goal of maintaining a scalable, profitable business model supported by skilled talent.
Remote and Distributed Workforce Trends
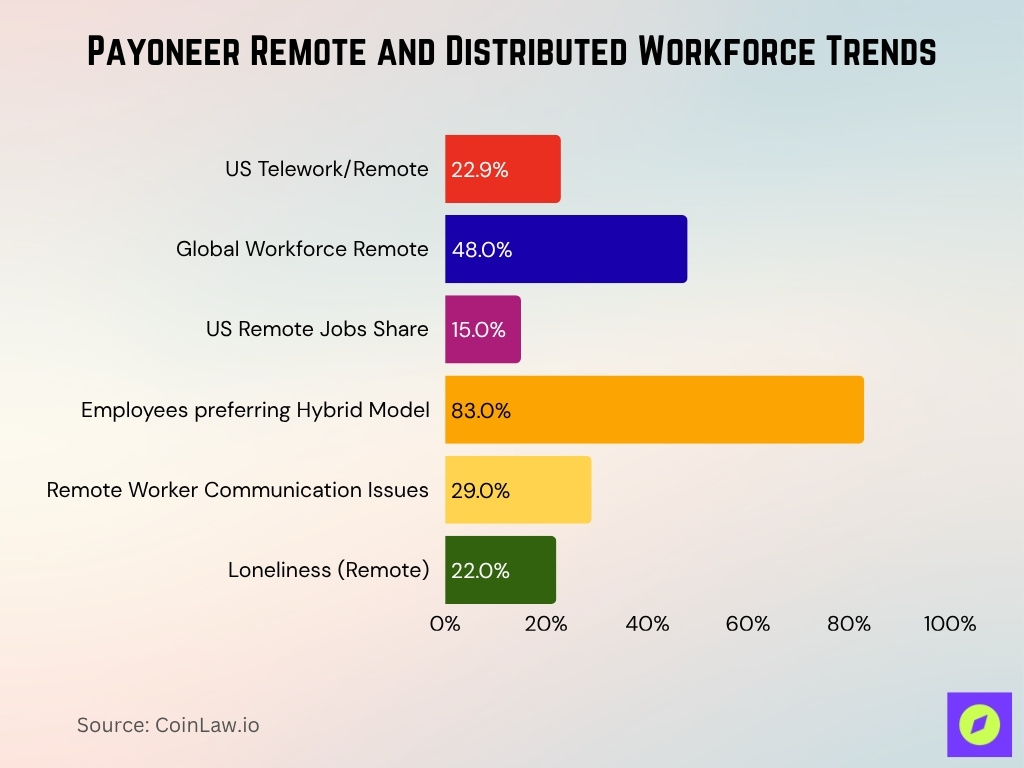
- In the U.S., about 22.9% of people employed and at work in Q1 2024 teleworked or worked at home for pay, up from 19.6% a year earlier.
- Globally, remote-work arrangements are rising, with 48% of the global workforce working remotely in 2025.
- Remote jobs in the U.S. now make up more than 15% of total job opportunities, roughly triple pre-2020 levels.
- Approximately 83% of employees globally view hybrid models as ideal.
- 29% of remote workers report communication issues, 22% report loneliness.

- Payoneer operates across “30+ countries” and supports a distributed workforce model across regional offices and global teams.
- For Payoneer, the distributed model supports its cross-border payments business, enabling flexibility in locale, timezone, and cost-structure matching.
- Remote trends enable Payoneer to tap talent globally while aligning with its global customer base and regulatory needs.
Use of Freelancers and Contractors
- 46% of freelancers saw an increase in demand for their work.
- 38% of freelancers reported an increase in hourly rates over the prior year.
- The average hourly rate for female freelancers was $22/hr, compared to $24/hr for men (≈ 92 ¢ to each dollar earned by men).
- Payoneer provides a “guide” for hiring international contractors in the top 15+ countries.
- Specific internal contractor counts are not publicly disclosed, but the global scope implies meaningful utilisation of freelancers.
- Freelancers allow Payoneer to access specialised skills on flexible terms across geographies.
- The global freelancer market exceeded 1.57 billion people (≈ 46.7% of the global workforce) in 2024.
- Payoneer’s own business focuses on freelancers and independent professionals, making contractor utilisation both a business model and internal workforce strategy.
- Contractors and freelancers help scale staffing quickly without full-time headcount commitments, aligning with Payoneer’s global growth.
Payoneer Workforce in the Context of Industry Peers
- Payoneer’s full-year revenue in 2024 was $977.7 million, up ~18% YoY.
- The number of employees as of Dec 31, 2024, was 2,407, up ~11.1% from 2023.
- Revenue per employee was $422,619, while profit per employee was about $41,471 in 2024.
- Revolut for Business reported revenue of ~$592 million in 2024, below Payoneer.
- Airwallex had annualised revenue of ~$720 million around March 2025, still under Payoneer’s scale.
- The employee growth rate at Payoneer (~11% in 2024) suggests a measured scaling compared to peers.
- Payoneer’s focus on B2B SMB payments, which grew ~42% in volume in 2024, gives it a differentiated angle versus consumer-focused peers.
- The employee-per-revenue metric (~1 per ~$422 k) is strong in fintech terms.
Revenue and Profit per Employee
- Payoneer generated roughly $422,619 in revenue per employee in 2024.
- Approximately $41,471 in profit per employee was achieved for 2024.
- With 2,407 employees, the revenue figure aligns with ~$977.7 million total revenue.
- Net income for 2024 was ~$121.2 million.
- Profit per employee reflects how effectively Payoneer converts revenue into earnings.
- Compared to peers averaging ~$300k revenue per employee, Payoneer’s ~$422k shows higher productivity.
- As Payoneer automates more processes, revenue per employee should rise further.
- Expansion and licensing efforts may weigh on short-term profit per employee until scale benefits are realised.
- These metrics highlight headcount management’s role in overall profitability.
Management Effectiveness and Productivity
- Internal reporting indicates that team productivity improved by 24% in 2025, following performance review optimizations and better alignment across departments.
- Net margin as of June 30, 2025, was ~9.81%.
- Growing revenue with moderate headcount growth underscores management effectiveness.
- Learning-content development time reduction drives productivity.
- Headcount grew by ~11% while revenue grew by ~18%, showing improved output per staff increment.
- Management emphasises global expansion, regulatory licensing, and scaling of high-value products.
- Productivity gains are supported by higher-value customer segments with B2B volume growth of 42% in 2024.
- Maintaining or improving productivity will be key to sustaining profit-per-employee and margin improvements.
Frequently Asked Questions (FAQs)
Estimated at roughly 2,407 employees (≈ +3.04% year-on-year).
25+ global offices in over 30 countries, with varying estimates (e.g., 37 to 44 locations).
~2,407 employees.
Conclusion
In summary, Payoneer’s workforce strategy illustrates a carefully managed growth story. The company’s adoption of remote/distributed models and use of freelancers and contractors further extends its flexibility and reach. When compared to industry peers, Payoneer stands out for combining global expansion, high-value B2B volumes, and productivity gains. For organisations and investors alike, the headcount statistics offer insight into how Payoneer balances scale, cost, and performance across a complex, cross-border business.


