When Ethereum launched in 2015, it revolutionized blockchain by bringing smart contracts into the spotlight. A few years later, Cardano entered the scene with a different approach, peer-reviewed research, and a layered architecture designed for long-term scalability and governance. Today, these two platforms are often compared, not just in terms of technology, but in usage, adoption, and growth.
In 2025, as decentralized finance (DeFi), NFTs, and blockchain interoperability mature, both Ethereum and Cardano are fighting to define their unique space in the Web3 era. This statistical breakdown offers a lens into how these titans stack up across metrics that truly matter.
Key Takeaways
- 1Ethereum’s market cap reached $423 billion in 2025, maintaining its second-place spot behind Bitcoin.
- 2Cardano’s market capitalization sits at $31 billion in 2025, reflecting a moderate recovery after a volatile 2024.
- 3Ethereum processed 2.1 million daily transactions on average in Q2 2025, compared to Cardano’s 92,000.
- 4Cardano’s transaction fees remain low at $0.04 per transaction, emphasizing its efficiency-first model.
CME CF Single Asset Series: YTD vs. Weekly Crypto Returns
- Solana (SOL) leads the chart with a YTD Return of 42% and an impressive Weekly Return of 55%, highlighting strong short-term momentum.
- Chainlink (LINK) shows solid growth with a YTD Return of 28% and a notable Weekly Return of 38%, signaling recent bullish sentiment.
- XRP (XRP) stands out with a YTD Return of 40%, although its Weekly Return is 30%, indicating consistent performance over time.
- Cardano (ADA) posted a YTD Return of 24%, but its Weekly Return of 16% suggests moderate recent movement.
- Bitcoin (BTC) maintains stability with a YTD Return of 12% and a slightly higher Weekly Return of 14%, reflecting gradual accumulation.
- Avalanche (AVAX) shows limited year-long gains at 6% YTD, but a stronger Weekly Return of 13% implies recent upward action.
- Ether (ETH) had the lowest annual return at just 2% YTD, though its Weekly Return of 12% shows renewed short-term interest.

Smart Contract Deployment Metrics
- In 2025, Ethereum sees over 85,000 smart contracts deployed monthly, reflecting strong dApp innovation.
- Cardano’s Plutus-based contracts average 5,800 deployments per month, a significant uptick from 2024.
- Ethereum developers use Solidity for about 94% of deployed contracts, while Cardano’s Haskell/Plutus adoption is close to 87%.
- Ethereum’s total contracts deployed has surpassed 7 million since inception, whereas Cardano’s cumulative total stands at 220,000+.
- Ethereum’s EVM compatibility supports integration with Polygon, Arbitrum, and Optimism, while Cardano uses Marlowe for financial contracts.
- On-chain contract failures on Ethereum have dropped to 1.9%, while Cardano reports a failure rate of just 0.7%, indicating higher reliability.
- In 2025, Ethereum smart contracts see an average of 1.4 million daily executions, while Cardano processes about 52,000.
- Cardano introduced Aiken, a new developer-friendly language, in early 2025, which is gaining adoption.
- Ethereum’s zkEVM-based dApps are now over 1,000, enhancing scalability in contract execution.
- Both chains saw increased enterprise usage, with Ethereum used in 60+ pilot programs and Cardano in 22 active enterprise PoCs.
Energy Consumption and Sustainability
- Ethereum’s energy consumption dropped by over 99.95% after the Merge, consuming just 0.0026 TWh/year in 2025.
- Cardano’s annual energy usage remains low, estimated at 0.0031 TWh/year, similar to that of a small town.
- The average energy used per Ethereum transaction is now just 0.03 kWh, down from 178 kWh in 2021.
- Cardano transactions use approximately 0.004 kWh per operation, maintaining a high energy efficiency profile.
- Ethereum operates via Proof-of-Stake, with over 97% of validators running on renewable energy-sourced data centers.
- Cardano’s sustainability framework includes climate offsetting partnerships; by 2025, it has neutralized 100% of its annual carbon output.
- Ethereum is supported by The Crypto Climate Accord, targeting net-zero emissions across all chains by 2030.
- Cardano launched the “Sustainable ADA” campaign in March 2025, promoting eco-friendly staking pools with over 45% network participation.
- Ethereum validators now number over 910,000, while Cardano has around 3,700 stake pools, with 80% in low-carbon zones.
- Both blockchains outperform Bitcoin in sustainability, with Bitcoin’s annual energy usage still over 80 TWh/year in 2025.
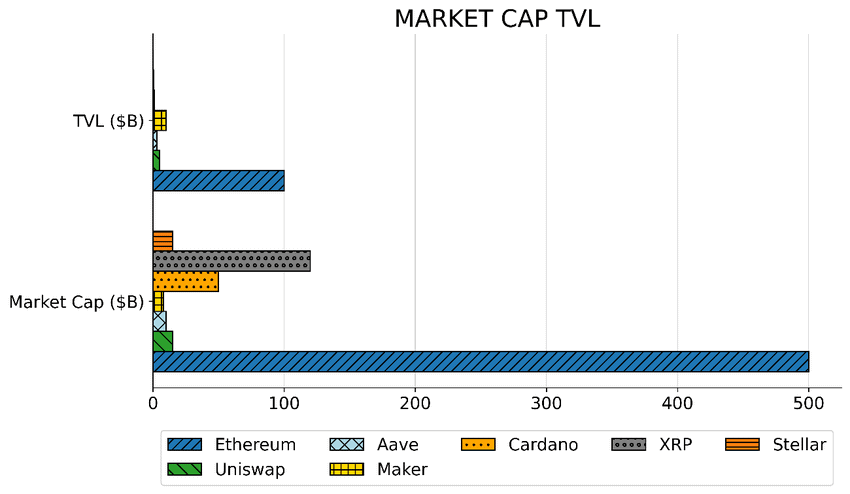
Market Cap vs. TVL: A Quick DeFi & Crypto Snapshot
- Ethereum dominates both categories with a Market Cap of nearly $500B and TVL of around $100B, showing its strong foundation in DeFi.
- XRP has a Market Cap close to $150B, but almost no TVL, emphasizing its use outside the DeFi ecosystem.
- Cardano holds a Market Cap of about $40B, with a TVL near zero, signaling limited DeFi integration.
- Uniswap, primarily a DeFi protocol, has a TVL just under $10B and a Market Cap around $15B, showing a balanced DeFi presence.
- Aave displays a TVL of around $10B and a Market Cap slightly lower, highlighting its TVL-focused utility.
- Maker has one of the highest TVLs at around $15B, but a smaller Market Cap, underlining its functional role in stablecoin infrastructure.
- Stellar shows a Market Cap around $10B with negligible TVL, reflecting its cross-border payments niche over DeFi usage.
Developer Activity and GitHub Contributions
- Ethereum leads in GitHub commits, with over 170,000 commits in the past 12 months (as of June 2025).
- Cardano developers have contributed 61,000+ commits, marking a 7% YoY growth.
- Ethereum has 3,200+ monthly active developers, compared to Cardano’s 720, as of Q2 2025.
- Cardano’s main GitHub repo ranks in the top 5 most active crypto repos, based on commit frequency.
- Ethereum’s dev community spans across tools like Foundry, Hardhat, and Remix, while Cardano developers use Marlowe, Aiken, and Plutus.
- In 2025, the Ethereum Foundation funded $45 million in grants, compared to $14 million by IOG for Cardano.
- Hackathons on Ethereum totaled over 60 global events, while Cardano ran 18, with rising university involvement.
- Cardano added 40+ developer tutorials in the first half of 2025, focusing on onboarding Haskell-native teams.
- Ethereum EIPs (Ethereum Improvement Proposals) submitted reached 660+, while Cardano’s CIPs (Cardano Improvement Proposals) hit 80.
- The Ethereum Devcon 2025 drew 8,500+ attendees, while the Cardano Summit 2025 welcomed 3,000 developers from over 40 countries.
Staking and Yields
- Ethereum’s total staked ETH exceeds 32 million ETH in 2025, which accounts for ~27% of its supply.
- Cardano has 24.6 billion ADA staked, representing over 70% of its circulating supply.
- Ethereum staking yields now average 3.7%, while Cardano offers 4.2%, maintaining competitive attractiveness.
- Ethereum’s liquid staking protocols (like Lido, Rocket Pool) control 46% of staked ETH, with over $75 billion TVL.
- Cardano supports native staking, with no lockup periods or slashing risks, used by 1.5 million wallets.
- Solo staking on Ethereum now requires 32 ETH ($110,000), while Cardano allows delegation from 1 ADA ($0.89).
- Rocket Pool’s validator count hit 22,000 in 2025, reflecting decentralized growth in Ethereum staking.
- Cardano’s top 10 stake pools account for less than 12% of the total stake, ensuring decentralization.
- Ethereum’s validator exit queue averages 1.8 days, while Cardano does not impose exit limits or penalties.
- Restaking on Ethereum, enabled through EigenLayer, has grown to $11 billion, but not yet mirrored on Cardano.
Ethereum Asset Distribution by Category
- The Beacon Chain holds the largest share of Ethereum assets at 55.6%, reflecting its central role in Ethereum’s proof-of-stake system.
- Other unspecified entities collectively account for 17.7%, suggesting a broad and diverse ownership.
- Centralized Exchanges (CEX) represent 15.3%, showing substantial institutional and custodial involvement.
- WETH (Wrapped Ethereum) makes up 5.2%, commonly used in DeFi protocols and cross-chain applications.
- Bridges account for 4.3%, highlighting their role in connecting Ethereum with other blockchains.
- The Ethereum Foundation and DeFi categories are listed but not quantified in the chart, indicating minor or unreported shares.

User Adoption and Wallet Growth
- Ethereum has over 255 million unique wallet addresses as of Q2 2025, with 1.6 million daily active users.
- Cardano reached 6.1 million wallet addresses, up 11% YoY, with daily active users around 88,000.
- MetaMask remains Ethereum’s leading wallet, installed on 30 million+ devices globally.
- Yoroi and Lace are top wallets on Cardano, with Lace seeing a 38% increase in monthly active users in 2025.
- Ethereum’s Layer 2 users now represent 35% of daily activity, driven by wallets on Optimism and zkSync.
- Cardano launched new wallet features in April 2025, including native token bundling and hardware wallet integrations.
- The average wallet size on Ethereum holds 0.47 ETH, while Cardano users average 1,900 ADA.
- Ethereum onboarding via Coinbase Wallet increased by 22% YoY, while Cardano’s ADA Pay system gained 500+ new SME integrations.
- Smartphone wallet access makes up 61% of Cardano activity, while Ethereum’s is split at 54% mobile, 46% desktop.
- Ethereum’s address growth rate stands at +4.1% QoQ, while Cardano records a +2.6% QoQ rise.
Interoperability and Cross-Chain Integration
- Ethereum dominates cross-chain activity, integrating with over 180 blockchains via bridges in 2025.
- Cardano’s cross-chain protocol, Midnight, launched full mainnet support in May 2025, enabling private smart contracts.
- Ethereum Layer 2 rollups like zkSync and Starknet now support cross-chain bridging to 40+ ecosystems.
- Cardano supports native ERC-20 conversion, with $75 million worth of tokens bridged from Ethereum by mid-2025.
- Ethereum’s Wormhole Bridge processes over $2.2 billion monthly in cross-chain volume.
- Cardano’s IBC (Inter-Blockchain Communication) protocol is under pilot testing with Cosmos chains, expected full rollout by Q4 2025.
- Ethereum-based multichain wallets like Rabby and MetaMask support 25+ EVM-compatible chains, while Cardano wallets support integration with Milkomeda and EVM sidechains.
- Cardano’s EVM sidechain launched in Q1 2025, seeing 15,000+ smart contracts deployed in the first 5 months.
- Cross-chain NFTs between Ethereum and Cardano exceeded 210,000 transfers in 2025, powered by bridges like Wanchain.
- Ethereum’s account abstraction models enhance interoperability via smart wallet standards like ERC-4337, not yet adopted by Cardano.
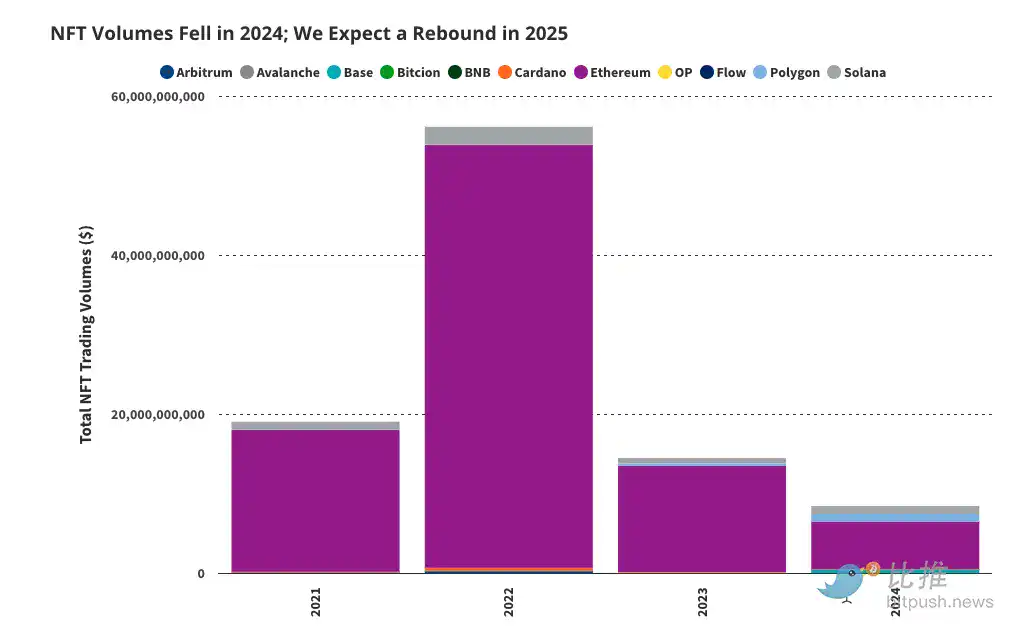
NFT Trading Volumes: 2025 Outlook
- 2022 was the peak year with nearly $60 billion in total NFT trading volume, driven largely by Ethereum.
- 2021 saw over $18 billion, marking the early boom of the NFT market.
- 2023 experienced a sharp decline, with volumes dropping to around $16 billion.
- 2024 hit a low point, with trading volume falling below $10 billion, showing a steep pullback in market activity.
- Ethereum consistently dominates the NFT space across all years, with other blockchains like Solana, Polygon, and Flow contributing modestly.
- Despite the downturn, the chart signals a projected rebound in 2025, hinting at renewed interest and possible recovery.
Governance Models and Voting Participation
- Ethereum governance is primarily off-chain, with EIPs managed by core developers and community discussions.
- Cardano utilizes on-chain governance, with CIP-1694 implemented in 2025, enabling full community voting.
- Cardano’s Project Catalyst has funded 1,850+ projects, with over 4.2 million ADA holders eligible to vote.
- Voter participation on Cardano reached 16.5% in its latest funding round (Fund 12), a record high in 2025.
- Ethereum’s EIP-4844 upgrade was approved after community feedback from over 40,000 GitHub discussions.
- Cardano voters submitted 12,600+ proposals in 2025, a 21% increase YoY.
- Ethereum lacks formal voting mechanisms, but 2025 saw an uptick in DAO participation, with over 8.3 million active DAO wallets.
- Cardano’s governance token model allows ADA holders to delegate votes, with $1.1 billion ADA staked toward governance use cases.
- Cardano introduced Constitutional Committee elections in April 2025, with the first elected members announced in June.
- Ethereum DAOs collectively hold $25.7 billion in treasuries, while Cardano’s treasury is valued at $1.8 billion as of Q2 2025.
Security Incidents and Network Reliability
- Ethereum recorded zero successful chain-level attacks in 2025, maintaining high protocol integrity.
- Cardano has also reported zero critical network vulnerabilities as of mid-2025.
- Ethereum smart contract exploits caused $740 million in losses YTD, largely through DeFi protocols built on-chain.
- Cardano’s total reported exploit losses remain below $2 million, highlighting its secure-by-design model.
- Ethereum’s average block finality time is 13 seconds, while Cardano averages 20 seconds, offering comparable performance.
- Slashing penalties on Ethereum have affected less than 0.04% of validators, often due to downtime or double-signing.
- Cardano does not implement slashing, relying on economic incentives to maintain uptime and honest participation.
- Ethereum audit frequency increased in 2025, with 400+ smart contracts undergoing formal verification.
- Cardano maintains deterministic scripting, reducing potential attack vectors by avoiding arbitrary execution.
- Bug bounty rewards on Ethereum reached $7.6 million in payouts, while Cardano paid out $850,000 in bounties in 2025.
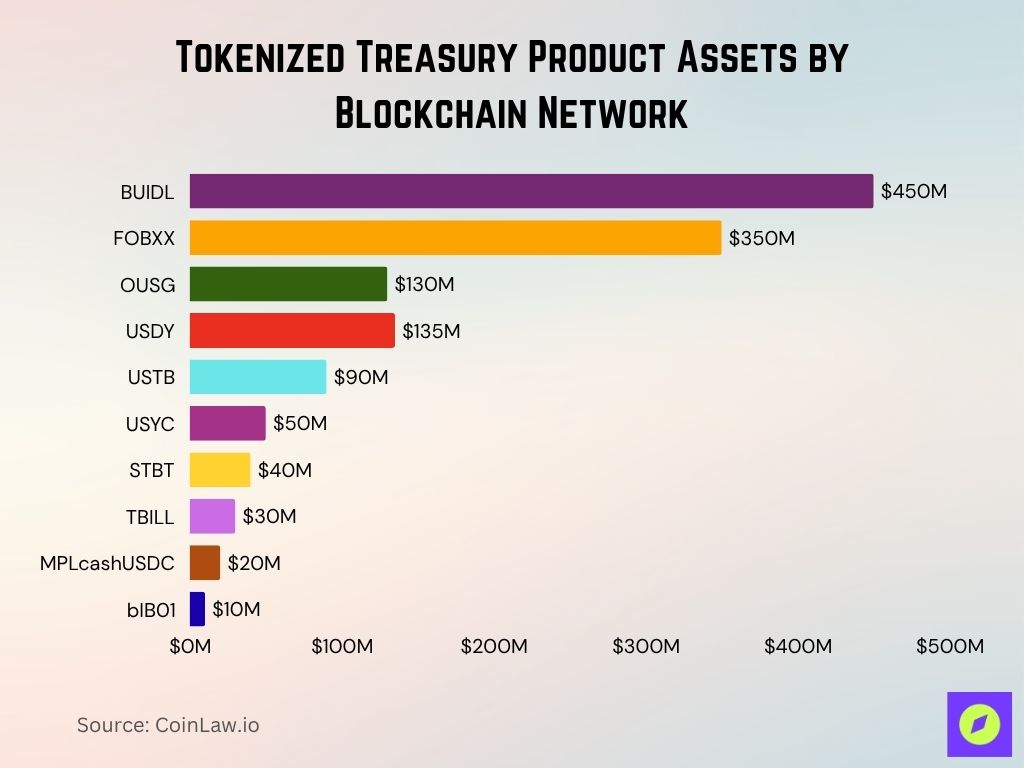
Tokenized Treasury Product Assets by Blockchain Network
- BUIDL tops the list with $450 million in assets, all hosted on Ethereum, reflecting strong institutional trust.
- FOBXX follows with around $350 million and is exclusively built on Stellar, showing its traction in stable asset tokenization.
- OUSG manages approximately $130 million, primarily on Ethereum with a small share on Polygon.
- USDY holds about $135 million, split between Ethereum and Solana, signaling cross-chain adoption.
- USTB maintains around $90 million in assets, entirely based on Ethereum.
- USYC and STBT carry $50 million and $40 million, respectively, both are also tied to Ethereum.
- TBILL, MPLcashUSDC, and bIB01 round out the list with smaller holdings of $30 million, $20 million, and $10 million, all on Ethereum.
Geographic Distribution of Nodes
- Ethereum nodes are distributed across 63 countries, with top locations being the US (37%), Germany (16%), and Singapore (6%).
- Cardano nodes span 47 countries, with leading representation in Germany (22%), the US (18%), and Japan (11%).
- Ethereum’s total active node number is 6,900+, while Cardano maintains 3,200+ block-producing nodes.
- Cardano’s peer-to-peer (P2P) network update in 2025 improved decentralization by 25%, according to system telemetry.
- Ethereum archive nodes, essential for dApp analytics, are estimated at 400, mostly operated by large service providers.
- Cardano promotes home-staking nodes, with over 61% of pools operated by individuals rather than institutions.
- Ethereum’s light clients adoption has increased by 42% YoY, mostly used on mobile and IoT interfaces.
- Cardano supports pruning for low-storage nodes, reducing infrastructure costs for community validators.
- In 2025, Ethereum’s average node bandwidth requirement is >5 Mbps, while Cardano’s is approximately 1.5 Mbps.
- Ethereum’s MEV relay services operate globally, while Cardano avoids MEV by design.
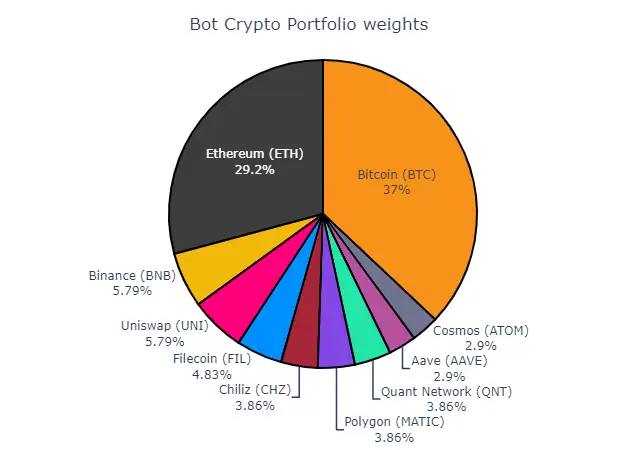
Bot Crypto Portfolio Allocation Breakdown
- Bitcoin (BTC) holds the largest share with 37% of the portfolio, emphasizing its dominance in digital asset strategies.
- Ethereum (ETH) follows with a significant 29.2%, reinforcing its role in DeFi and smart contracts.
- Binance (BNB) and Uniswap (UNI) are equally weighted at 5.79%, showing support for major exchange and DEX tokens.
- Filecoin (FIL) represents 4.83%, signaling interest in decentralized storage.
- Chiliz (CHZ), Polygon (MATIC), and Quant Network (QNT) each make up 3.86%, highlighting smaller but targeted investments.
- Cosmos (ATOM) and Aave (AAVE) both have a modest 2.9% allocation, reflecting diversification across interoperable and lending platforms.
Recent Developments in Ethereum and Cardano
- Ethereum launched EIP-4844 (“Proto-Danksharding”) in March 2025, reducing rollup fees by up to 90%.
- Cardano finalized CIP-1694, laying the foundation for full on-chain governance and a constitutional framework.
- Ethereum’s Layer 3 experimentation gained traction, with platforms like Zeth and Taiko launching beta networks.
- Cardano’s Hydra heads now support real-world microtransaction use cases, including in-game economy pilots.
- EigenLayer’s restaking on Ethereum surpassed $11 billion TVL, with participation from over 30 major protocols.
- Cardano’s sidechain toolkit reached v2.0 in May 2025, enabling plug-and-play for EVM compatibility.
- Visa and Mastercard began Ethereum on-chain settlement pilots, a major step for mainstream finance adoption.
- Cardano’s Lace Wallet v3 was released in Q2 2025, featuring multi-chain support and staking automation.
- Ethereum developers introduced programmable privacy using zk-SNARKs, already implemented in two leading DeFi apps.
- Cardano’s partnership with Ethiopia expanded into a national credential system, onboarding 5 million new users.
Conclusion
As we reach the midpoint of 2025, the competition between Ethereum and Cardano continues to push the blockchain space forward. Ethereum excels in developer activity, smart contract diversity, and DeFi depth. Meanwhile, Cardano shines in energy efficiency, governance innovation, and sustainable staking.
Both chains reflect distinct philosophies: Ethereum leads through rapid iteration and expansive tooling, while Cardano builds with a methodical, research-first approach. Whether measured by transaction fees, user growth, staking returns, or institutional adoption, each network offers unique strengths, and understanding those differences has never been more crucial for investors, developers, and users alike.


