Ethereum staking now commands near 30% of the total ETH supply, a milestone reflecting vibrant growth in on-chain participation. This shift isn’t just technical; it touches institutional portfolios and DeFi platforms, driving both security and utility into synergy. Now, let’s unpack the numbers to see what’s fueling this shift.
Editor’s Choice
- 35–37 million ETH staked, roughly 29%–31% of the circulating supply.
- 33.84 million ETH staked, about 27.6% of total supply.
- 35.3 million ETH staked by mid‑2025, marking a record 29% staking ratio.
- 3%–4.8% APY staking yields across platforms.
- 1,057,532 active validators, securing the network.
- 0 slashing events for Figment validators in Q1 with a 99.9% participation rate.
- 826,876 ETH are currently queued for staking as of September 2025, surpassing exit queue volumes.
Recent Developments
- The Pectra upgrade (mid‑2025) raised the validator stake cap from 32 to 2,048 ETH, enabling more efficient large‑scale participation.
- As of September 2025, staking now represents 30% of the ETH supply, up from lower levels earlier in the year.
- A surge in institutional capital, partly via Ethereum ETFs, has powered staking growth.
- Staking queue reached 826,876 ETH, signaling strong demand and confidence.
- Deployment of EIP‑7251 allowed “0x02” validators to pool significant ETH, over 750,000 ETH.
- Liquid restaking share rose from 6.3% to 7.6%, adding over 550,000 ETH in mid‑2025.
- The Pectra upgrade also streamlined wallet usability and fee reductions, boosting broader appeal.
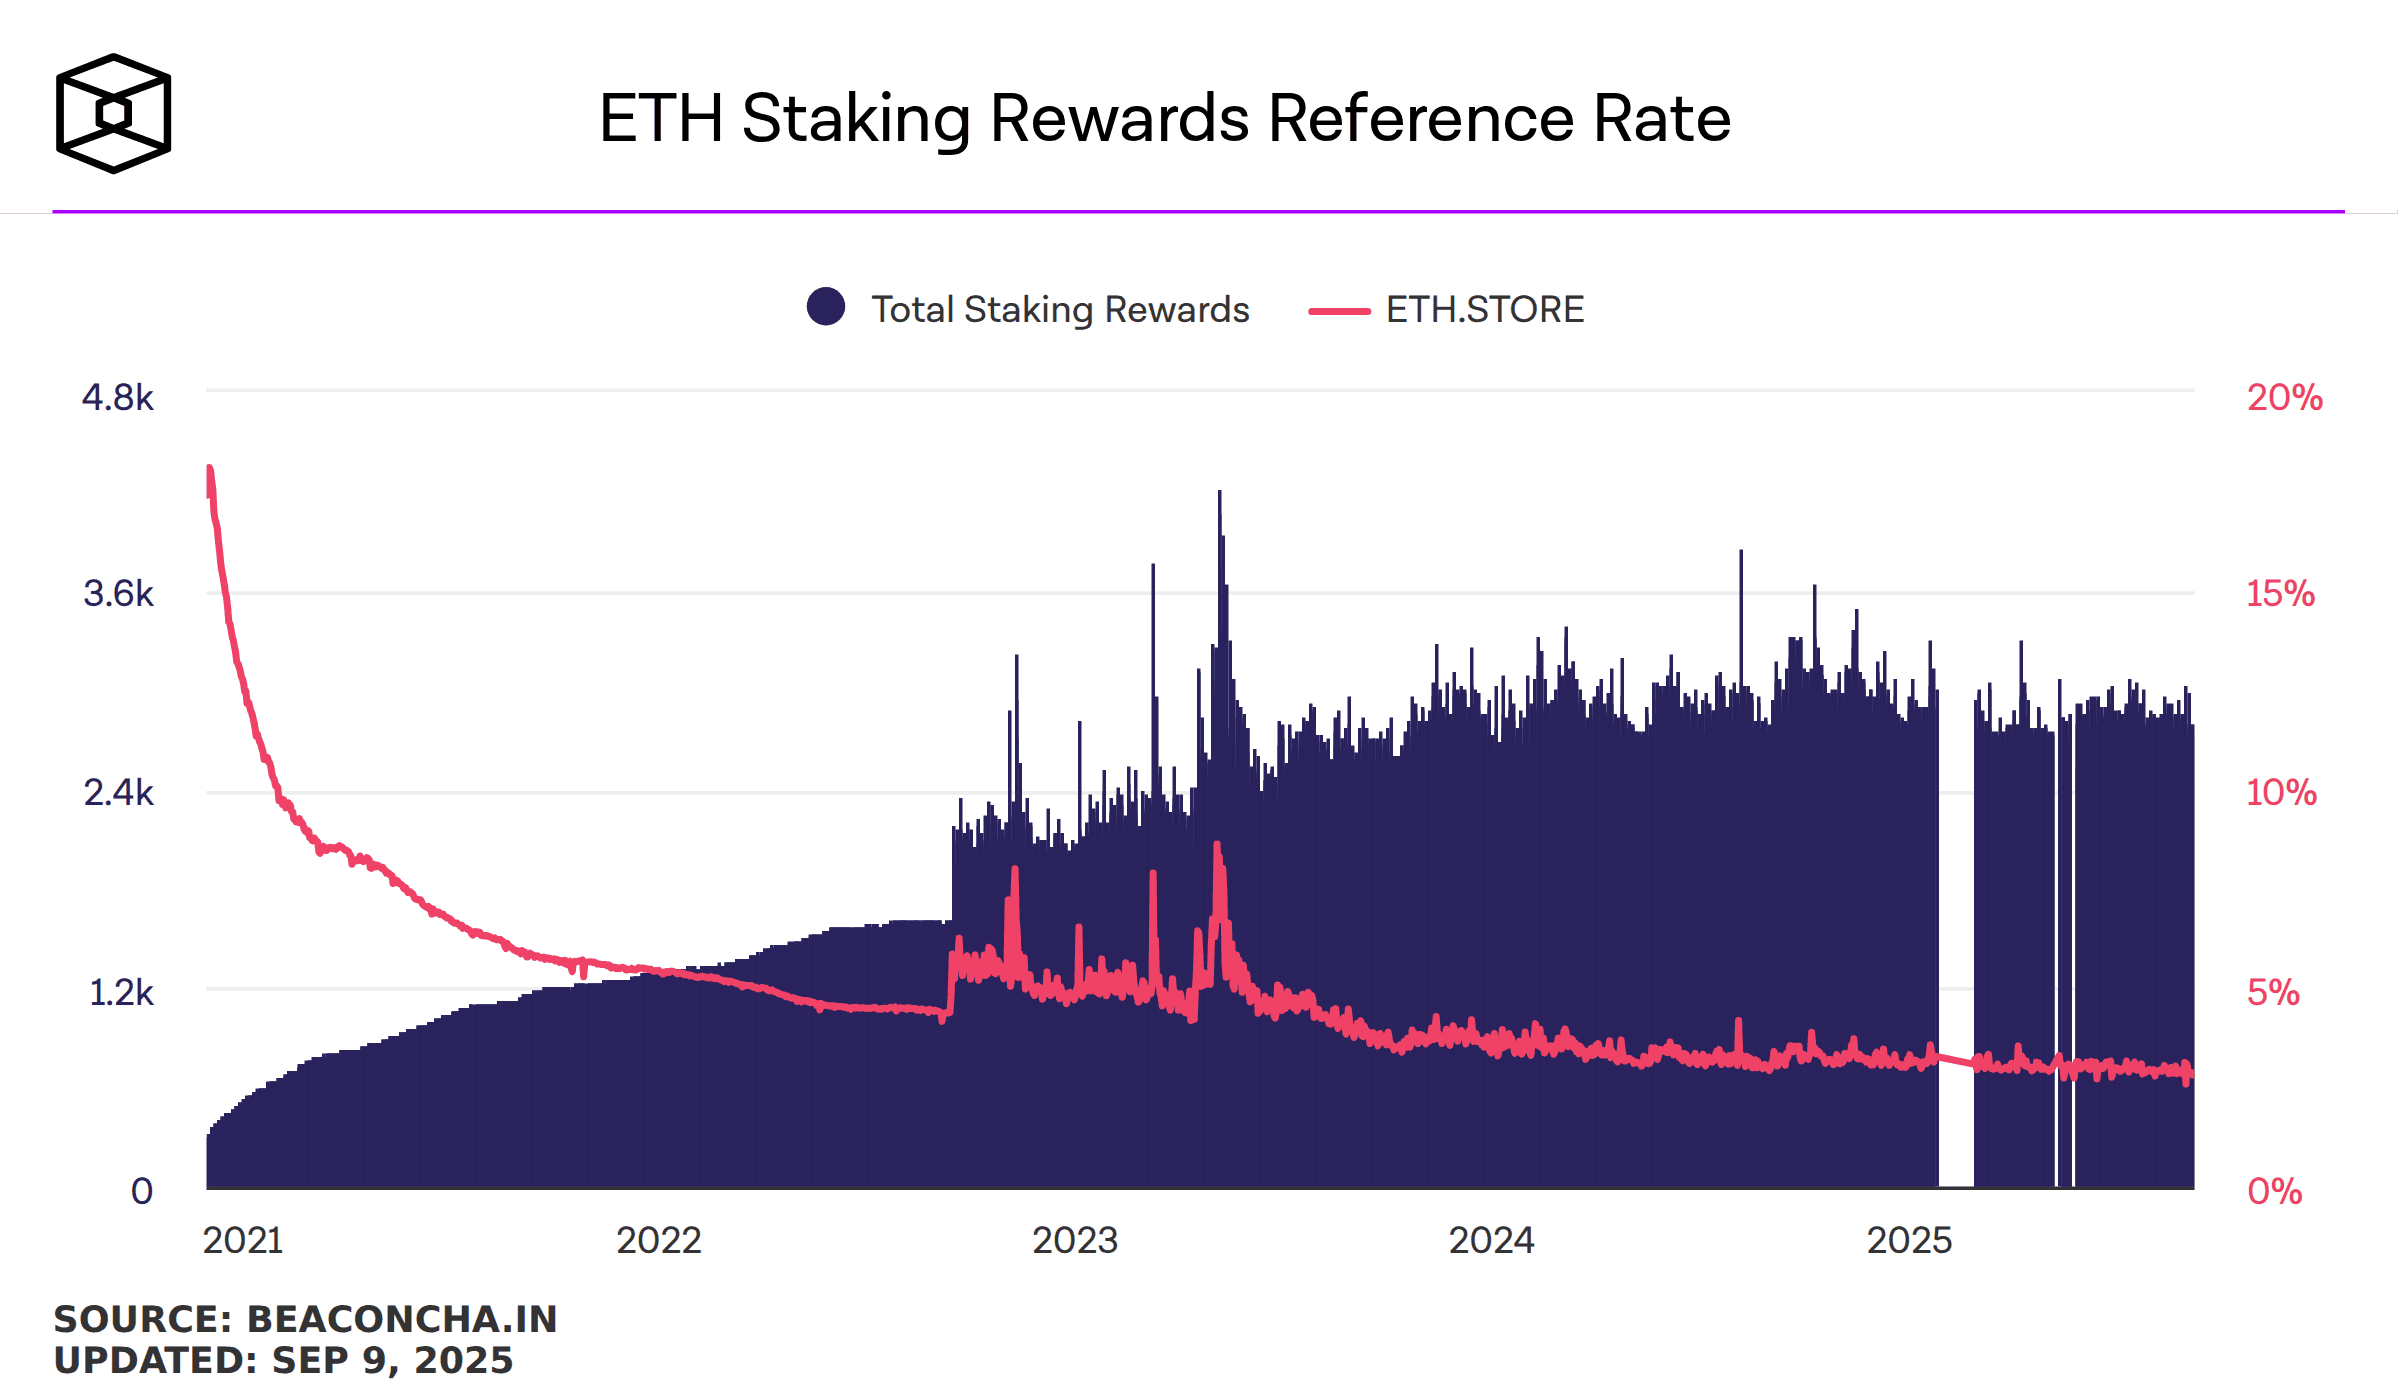
ETH Staking Rewards Reference Rate
- The ETH.STORE staking reward rate dropped from around 20% in early 2021 to just 3.5% in 2025, reflecting a more mature and saturated staking environment.
- Total ETH staking rewards climbed from under 1,200 ETH in 2021 to peaks exceeding 4,800 ETH by 2025, driven by increased validator participation.
- The reward rate showed sharp declines in the early years and then stabilized between 3.5% and 4.0% from late 2023 through 2025.
- High reward volatility was observed during 2022 and early 2023, suggesting transitional network upgrades or validator rebalancing periods.

Ethereum Staking Overview
- Over 34 million ETH is locked in PoS to secure the network, valued at over $100 billion.
- Validators now exceed 1 million, reflecting widespread participation.
- 1,057,532 active validators provide decentralized network protection.
- Approximately 940 distinct staking entities, including exchanges, liquid staking protocols, and independent operators.
- Average validator uptime is 99.2% in Q2 2025.
- No double-sign slash events recorded in Q1 for Figment validators.
- Figment’s average risk-adjusted reward (SRR) was 3.34% in Q1.
- The Thrive of liquid restaking, the percentage is increasing significantly.
Total ETH Staked
- 33.84 million ETH staked (27.57% of supply).
- Between January and June 2025, staking rose from 34 million to 35.3 million ETH, reaching 29% of supply.
- September 2025 sees 35–37 million ETH staked, about 29–31%.
- Coinbase data reports 35.8 million ETH staked, translating to a staking “market cap” of $259.7 billion and a 29.64% staking ratio.
- Institutional inflows and ETF exposure contributed heavily to these gains.
ETH Staking Participation Rate
- Key ranges now span 27.6% to 31% of total ETH.
- Coinbase reports a 29.64% staking ratio, in line with other metrics.
- Estimates suggest over 30% of the ETH supply is staked, highlighting confidence growth.
- Consistent figures show a 29% staking share by mid‑2025.
- Historical context: In March 2023, 18 million ETH was staked (11%), and staking has nearly tripled since.
Bit Digital Ethereum Staking Yields vs Benchmarks
- Bit Digital’s staking yield started at just 1.0% in April 2025, gradually climbing each month.
- By August 2025, the yield peaked at 18.7%, exactly matching the institutional high range for that month.
- In August, Bit Digital also outperformed the industry average of 10.5%, highlighting its strong positioning.
- Staking yields stayed elevated through September (18.5%), October (17.6%), and November (15.5%), remaining within the top institutional range.
- A dip followed in December, with yields falling to 3.5%, before a sharp and possibly anomalous spike to 65% in January 2026.

Staking Methods Breakdown
- Liquid staking is the most dominant, accounting for 31.1% of all staked ETH (10.53 million ETH).
- Centralized exchanges (CEXs) hold about 24.0% (8.13 million ETH) of staked assets.
- Staking pools contribute roughly 17.7% (5.98 million ETH).
- Unidentified or unstated sources make up 20.1% (6.79 million ETH).
- Liquid restaking represents 6.6% (2.24 million ETH) of total staked ETH.
- Solo stakers account for just 0.5% (0.18 million ETH).
- Over the first half of 2025, liquid staking’s share dipped slightly from 34.6% to 32.2%, reducing by 390,000 ETH.
- Centralized exchanges increased their share by 0.5%, absorbing around 520,000 ETH.
- Liquid restaking expanded from 6.3% to 7.6%, adding over 550,000 ETH to that category.
Centralized Exchange Staking Statistics
- Major participants include Coinbase (8.4%) and Binance (6.4%), while newer entrants like ether.fi (5.3%) and Kiln (3.9%) are gaining ground.
- Centralized exchanges control 24.0% of staked ETH, translating to 8.13 million ETH.
- Their share increased by 0.5% (520,000 ETH) in early 2025.
- Despite accuracy in liquidity, this centralization raises concerns for network integrity.
- Centralized stakes contribute substantially to continued convenience and yield access.
- Institutional inflows via ETFs favor staking through CEXs, boosting their dominance.
- Yield offerings from CEXs range between 4–6% APY.
Decentralized Staking Pools Data
- Staking pools account for 17.7% (5.98 million ETH) of the staking market.
- Their share grew from 17.6% to 17.8% over H1 2025.
- Pools serve institutional users who prefer aggregated and managed validator services.
- They don’t issue derivative tokens, thus limiting liquidity avenues.
- Pools skirt centralization concerns while offering professional-level reliability.
- Expansion aligns with institutional engagement via staking ETFs.
- Institutional custody-plus-service offerings continue to grow in popularity.
ETH Staking Breakdown by Category
- Liquid staking leads the ecosystem, accounting for 31.1% of all staked ETH, driven by platforms like Lido, Rocket Pool, and Frax Ether.
- Centralized exchanges (CEXs) contribute 24.0%, highlighting their continued importance in onboarding retail users into staking.
- A significant 20.1% of ETH is labeled as unidentified, likely from unlabeled validators, custom infrastructure, or private staking setups.
- Staking pools represent 17.7%, balancing accessibility with decentralization for mid-sized users and DAO-based participants.
- Liquid restaking, a rising trend powered by platforms like EigenLayer, makes up 6.6% of staked ETH.
- Solo stakers account for less than 1%, reflecting the high technical and capital requirements of running independent validators.

Liquid Staking Adoption
- Liquid staking holds 31.1% (10.53 million ETH) of staked assets.
- The total value locked (TVL) in liquid staking exceeded $44 billion by March 2024.
- This figure rose further in 2025, surpassing $50 billion in LST-managed assets.
- Lido holds a 27.7% market share (9.41 million ETH), despite a 4% drop in six months.
- SEC clarified that stETH is not a security (August 6, 2025), boosting institutional confidence.
- Lido tokens like stETH enjoy integration across Layer‑2s like Linea.
- Centralization risk lingers as Lido controls around 27% of total staked ETH.
Restaking Trends
- Liquid restaking grew from 6.3% to 7.6%, adding 550,000+ ETH in early 2025.
- EigenLayer commands 89.1% of all restaked ETH TVL (4.4 million ETH), valued at $12.03 billion.
- Restaking enables “double yield,” where ETH invested once generates multiple returns.
- Institutional appetite for restaking reflects demand for higher yields.
- Integration into DeFi accelerates restaking growth.
- Risk frameworks are maturing, making restaking viable.
- Users increasingly favor capital efficiency over simple lockups.
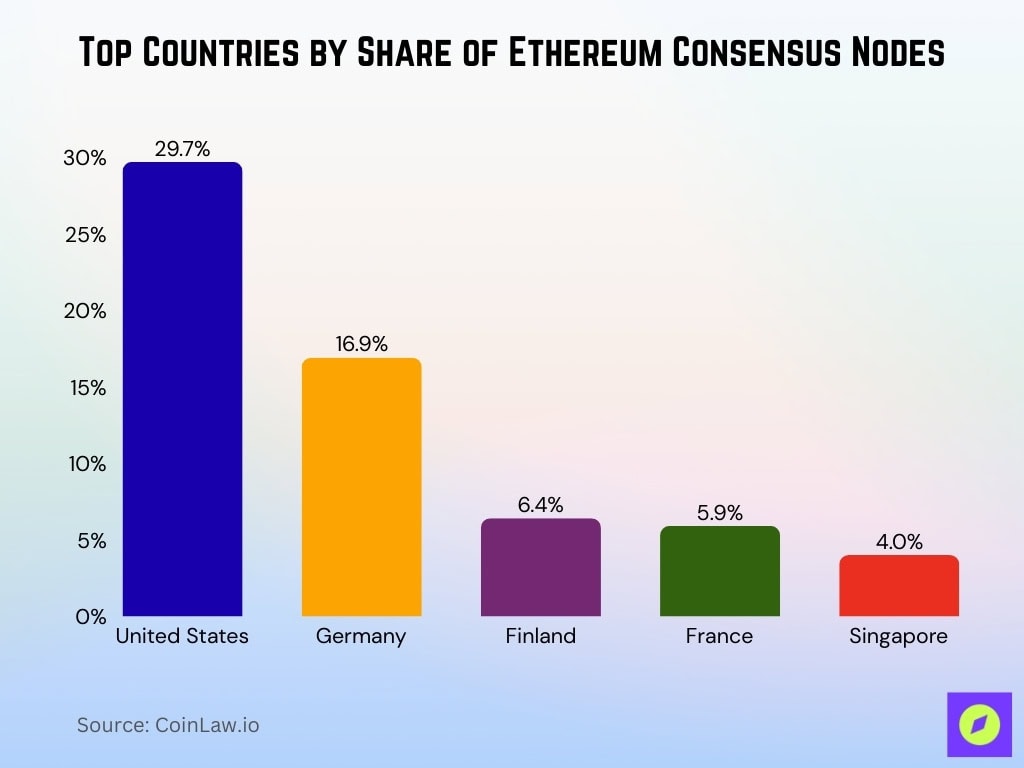
Geographic Distribution of ETH Stakers
- The United States hosts 29.7% of consensus-layer nodes.
- Germany follows with 16.9%, then Finland (6.4%), France (5.9%), and Singapore (4.0%).

- Node share by country: US 33.2%, Germany 13.1%, Singapore 6.5%.
- Node distribution outside North America and Europe has grown to 27%.
- Asia-Pacific accounts for 15.8%, up from 11.6%.
- 66% of staking participants are from North America and Western Europe.
- Global node diversity is rising steadily.
Average Staking Yields
- Current staking yields average around 1.87% APY.
- Validators with MEV‑Boost reach about 5.69% APY.
- Market yields generally range between 4–6%.
- The national average yield is around 3.8%, outperforming bank accounts.
- Yields have declined from post‑Merge highs of 5.3% to below 3%.
- Bit Digital’s strategy delivered a 2.94% yield in August 2025.
- Yields vary by platform, validator setup, and market conditions.
Slashing and Risk Events
- In Q2 2025, 21 slashing events were recorded, but Figment had none.
- Since staking inception, Ethereum validators have been slashed 474 times.
- Blockdaemon achieved zero slashing events and 99.9% uptime.
- Attacks like StakeBleed and KnockBlock target validator routing vulnerabilities.
- Validators must avoid downtime, double-signing, or misconfiguration.
- Best practices help reduce slashing risk.
- Slashing is rare but impactful, reinforcing the need for diligence.
Major Staking Platform Market Shares
- Lido leads with a 24.4% market share, down from over 32%.
- No entity controls more than one-third of staked ETH.
- Independent operators control around 6.8 million ETH.
- Staking pools and decentralized options are gaining traction.
- Exchanges like Coinbase and Binance still rank highly.
- Market competition promotes trust and diversity.
- Shifting dynamics reflect a maturing ecosystem.
Regulatory and Policy Developments
- On May 29, 2025, the SEC addressed protocol staking activities.
- On August 5, 2025, the SEC clarified that liquid staking receipts are not securities in some contexts.
- US regulatory clarity continues to improve.
- MiCA-compliant staking platforms paid out $4.5 billion in Q1 2025, a 12% YoY increase.
- MiCA-approved Ethereum deposits hit $100 billion.
- Legal clarity has fueled institutional participation.
- Further international rules will shape the next phase of staking.
Network Security Impact
- Ethereum hosts 1.06 million validators, staking 34 million ETH, about 28% of the supply.
- Active stake reached 35.7 million ETH with 1,060,332 validators by September 2025.
- Network effectiveness is 98.09%, and the participation rate is 99.78%.
- High participation ensures a consistent consensus.
- Financial commitment through staking increases economic security.
- A broad validator set reduces centralization risk.
- Network resilience is strengthened by staking growth.
Future Outlook for ETH Staking
- Institutional demand will likely drive further staking growth.
- Liquid staking platforms exceed $45 billion in TVL.
- Staking share of ETH supply could exceed 31%.
- Regulatory clarity and global node expansion foster resilience.
- Centralization and slashing remain top risks.
- The trend is upward, with cautious optimism prevailing.
Conclusion
Ethereum staking today reflects a maturing ecosystem, balancing yield, access, and security. With 3–6% APY available across platforms, staking now outpaces many traditional savings vehicles. Centralization concerns eased as competition grew, especially among liquid staking and institutional-grade providers. Node and validator diversity support strong network health, marked by near-perfect participation and uptime.
Regulatory clarity, particularly via the SEC and MiCA, has unlocked new capital flows and institutional trust. Global participation continues to diversify beyond traditional strongholds, suggesting broader resilience. Underpinned by these trends, staking is poised for further expansion, though vigilance remains essential. Readers curious for a deeper dive into earlier sections, like staking methods, queue dynamics, or liquid restaking, are invited to explore the full article.


