Dividend investing continues to gain traction as a foundational strategy for building reliable income and long-term wealth. From retirees seeking consistent cash flow to institutional investors hedging market volatility, dividends play a pivotal role in shaping portfolio returns. In sectors like financials and utilities, dividend payouts often reflect business maturity and financial discipline, while in global markets, dividend growth remains a leading indicator of corporate confidence. With record-breaking payouts and increasing adoption of dividend ETFs, the landscape is evolving rapidly. This article explores the most important dividend investing statistics, offering data-backed insights for informed decision-making.
Editor’s Choice
- Global dividend payouts reached a record $1.75 trillion in 2024 and are projected to stay near $2.3 trillion in 2025, underscoring how dividends remain a major engine of equity returns worldwide.
- he S&P 500 dividend yield hovered near 1.5% in early 2025 but has since fallen to about 1.15%, its lowest level since the dot‑com bubble, as price gains outpaced payout growth.
- Financials account for 39% of the total global dividend growth in the first half of 2025.
- The U.S. is among the top three countries in absolute dividend payouts, with $154 billion distributed in H1 2025.
- Over 1,200 companies worldwide raised dividends in Q2 2025, a 5.3% increase YoY.
- Dividend Aristocrats have outperformed the S&P 500 by 1.2% annually over the past decade.
- Dividend‑focused ETFs attracted about $23.7 billion in net inflows in H1 2025, their highest haul in three years as income‑seeking investors leaned into payout strategies.
Recent Developments
- Global dividend payouts hit a record $568.1 billion in Q2 2025, reflecting a 4.9% increase from Q1.
- U.S. dividends rose 4.2% YoY in Q2 2025, totaling $154 billion, despite slower earnings in tech.
- Japan overtook China in dividend growth in H1 2025, with a 9.8% YoY increase.
- More than 88% of U.S.-listed dividend-paying firms maintained or raised their dividends in the first half of 2025.
- The financial sector contributed 39% of global dividend growth in H1 2025.
- S&P 500 dividend futures predict a 2.5% annual growth rate through 2027.
- Over 60 companies initiated dividends for the first time in 2025, signaling increased shareholder focus.
- Over $23 billion in global net inflows moved into dividend ETFs in Q1 and Q2 2025.
- Energy companies recorded the highest sector-wide dividend growth at 7.4% YoY in H1 2025.
Global Dividend Market Overview
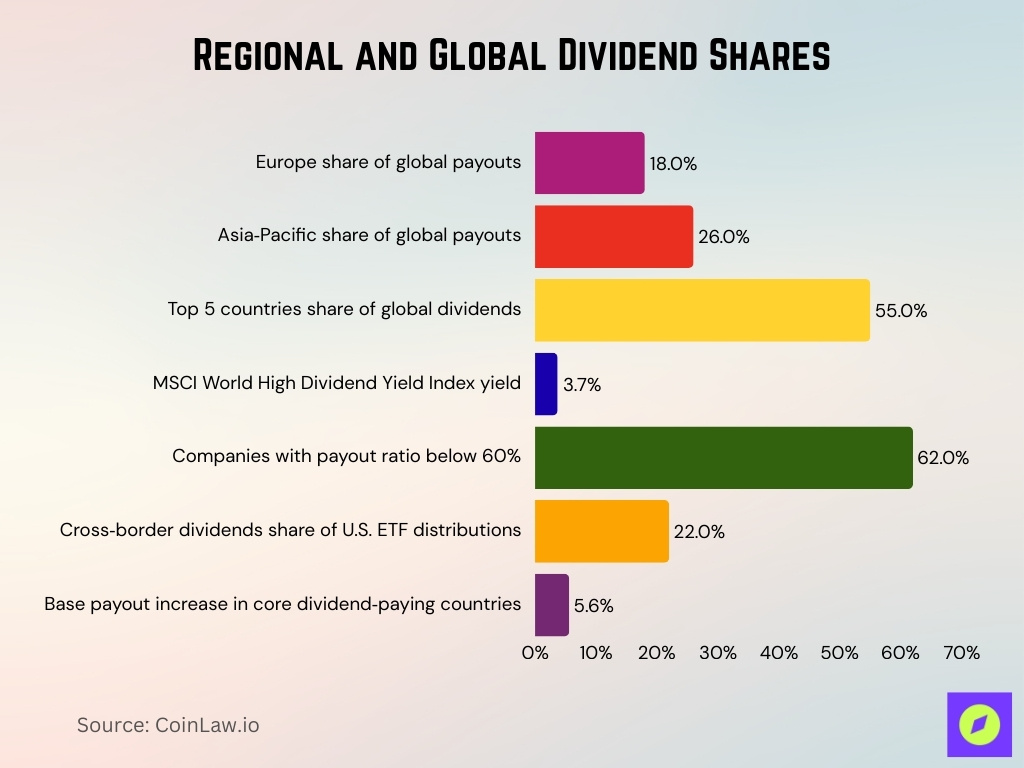
- European firms paid out over $300 billion in dividends in H1 2025, accounting for 18% of global payouts.
- Asia-Pacific’s dividend share has risen to 26% of the global total, led by Japan and Australia.
- The top five dividend-paying countries, the U.S., the U.K., Japan, France, and Switzerland, make up 55% of total global dividends.
- The MSCI World High Dividend Yield Index has delivered a 3.7% yield YTD in 2025.
- Dividend sustainability scores improved globally, with over 62% of companies maintaining payout ratios below 60%.
- Cross-border dividends (from ADRs and international stocks) accounted for 22% of dividend ETF distributions in the U.S. in 2025.
- Core dividend-paying countries have seen an average 5.6% increase in base payouts from 2024 to 2025.
Growth Rates Over Time
- Global dividend growth is projected at 5.2% YoY for 2025.
- Dividend growth among S&P 500 companies slowed slightly to 4.5% in 2024–2025 compared to 5.3% in the previous year.
- Japan’s corporate sector has raised dividends by 8.9% YoY, the fastest among G7 nations in 2025.
- Dividend Aristocrats have delivered average annual dividend growth of 7.2% over the past 10 years.
- Tech sector dividend growth leads all industries at 9.1%, although from a lower base.
- Mid-cap U.S. companies have increased their dividends by an average of 6.7% YoY in 2025.
- European dividend growth averaged 5.4%, led by luxury and consumer goods companies.
- Dividend increases outnumbered cuts by 6:1 globally in Q2 2025.
- Reinvestment of growing dividends compounds portfolio income at an effective rate of 6%–8% annually.
Payout Ratios and Trends
- Global core dividends increased 6.2% in the first half of 2025, signaling stronger payout capacity across sectors.
- Large banks reported an average payout ratio of 35.4%, reflecting healthier balance sheets compared with prior years.
- Financial sector dividends contributed nearly two-fifths of global core dividend growth in early 2025.
- A payout ratio in the 40%–60% range continues to be considered the most sustainable across mature industries.
- Firms with payout ratios well below 100% significantly reduce their risk of dividend cuts.
Average Dividend Yields by Region and Country
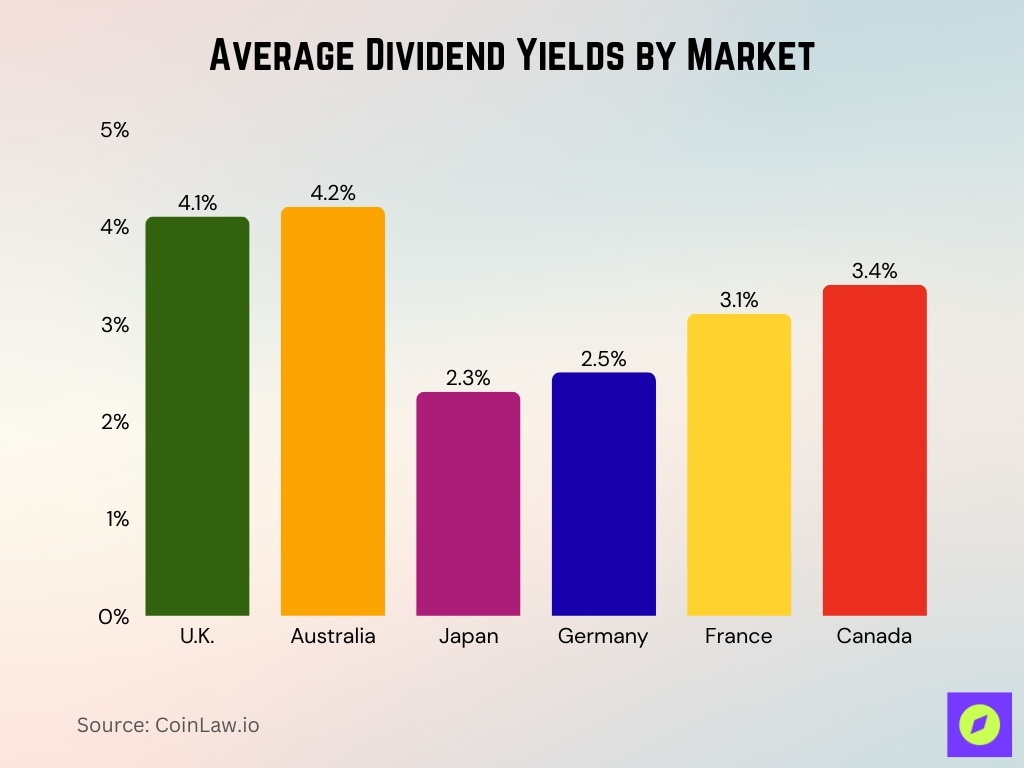
- U.K.-listed stocks maintain an average yield of 4.1%, making it the highest among G7 nations.
- Australian equities offer a consistent average dividend yield of 4.2% in 2025.
- Japanese dividend yields rose to 2.3% in 2025, reflecting ongoing corporate governance reforms.
- Germany and France offer average yields of 2.5% and 3.1% respectively.
- Canadian equities yield 3.4% on average in 2025, driven by the energy and banking sectors.
- Emerging market yields range from 3.2%–5.4%, with Brazil topping the list.
- REITs in the U.S. continue to offer elevated yields of 3.5%–6%, depending on sub-sector exposure.
- Utilities in the U.S. have an average dividend yield of 3.2% in early 2025.
- Dividend yields in China’s A-shares average 2.0%, higher than in previous years.
Dividend Aristocrats and Kings Performance
- The number of Dividend Kings reached 56 in 2025.
- Dividend Aristocrats yields averaged 2.5% vs. the S&P 500‘s 1.8% historically.
- Dividend Kings delivered 5-6% annual dividend growth over the last decade.
- Dividend Kings October 2025 total return: -2.1% vs. SPY‘s 2.4%.
- S&P 500 Dividend Aristocrats outperformed the S&P 500 in 66.67% of down months.
- Dividend Aristocrats showed a 0.8 beta and lower volatility long term.
- Dividend Kings include 16 mid-caps and 8 small-caps among 56 total.
- S&P High Yield Dividend Aristocrats returned -4.64% YTD 2025.
High-Yield vs Dividend-Growth Stock Performance
- Dividend growth stocks averaged a 2.9% yield vs. the market’s 1.8% over the long term.
- High-yield stocks with 4%+ yields are twice as likely to cut dividends.
- Dividend growers delivered 10.5% annualized returns vs. the S&P 500‘s 10.7% since 2008.
- High-yielders showed 16.7% volatility vs. growers‘ 14.0%.
- Dividend growth strategies outperformed high yield in 66% of long-term periods.
- Payout ratios below 1.5 coverage signal cuts in high-yield stocks.
- Growers like Visa achieved 22% CAGR dividend growth over 15 years.
- High-yield stocks averaged 8.4% returns with 20.2% volatility historically.
Dividend Yields by Sector
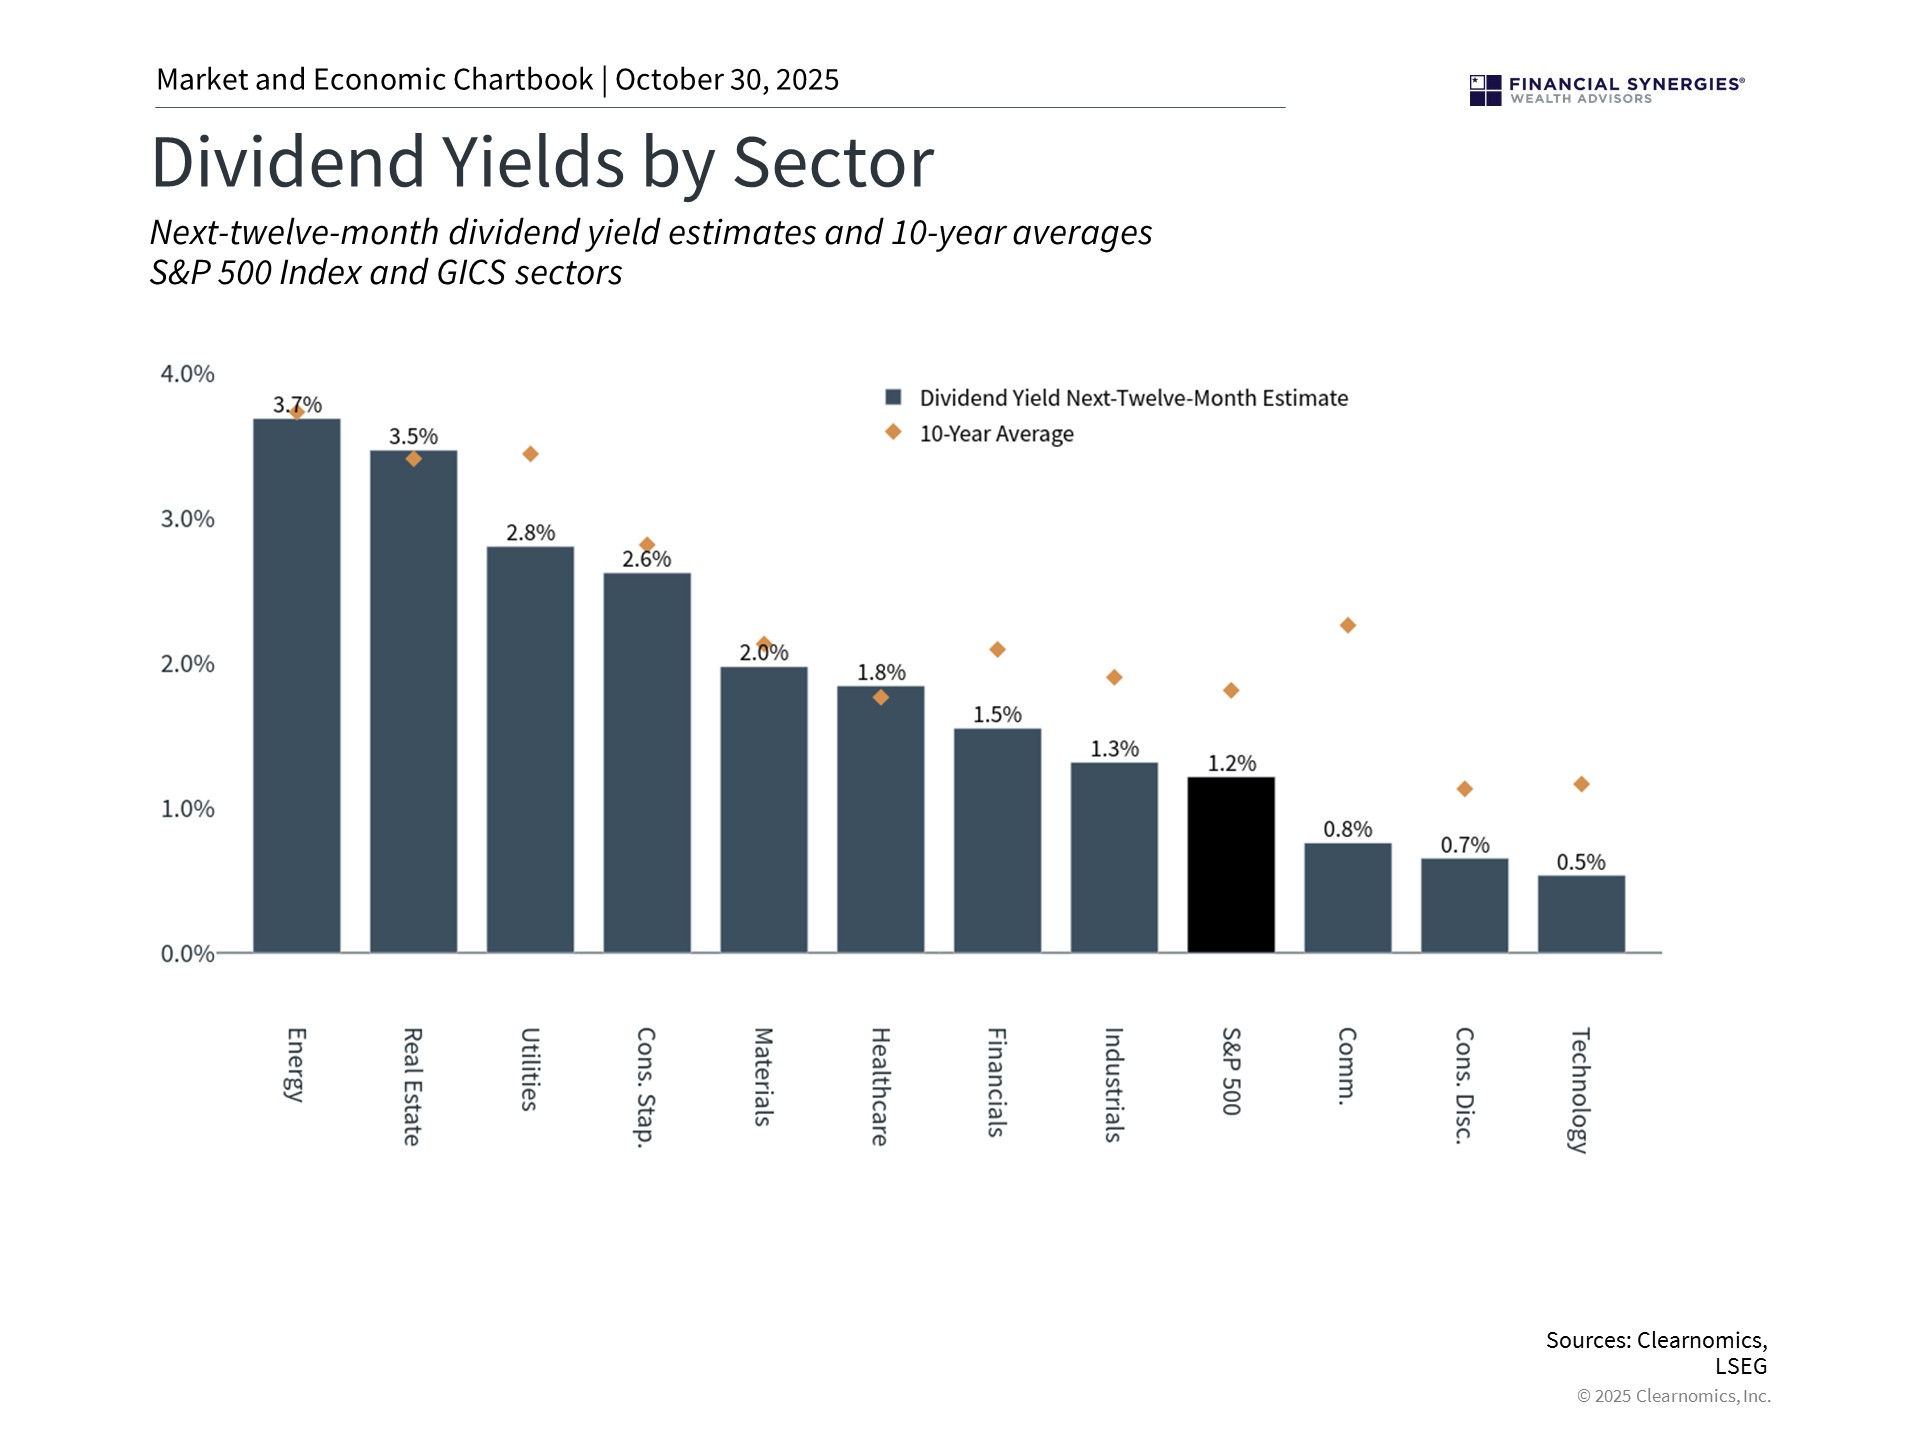
- Energy sector leads with a projected 3.7% yield, outperforming its 10-year average of 3.2%.
- Real Estate offers a strong 3.5% yield, up from its 10-year norm of 3.0%.
- Utilities deliver a stable 2.8% yield, modestly higher than the 2.6% average over the last decade.
- Consumer Staples match their historical trend with a consistent 2.6% yield.
- Materials maintain a balanced 2.0% yield, aligning with their 10-year average.
- Healthcare yields 1.8%, up slightly from its long-term average of 1.5%.
- Financials see a drop to 1.5% yield, well below their 10-year average of 2.6%.
- Industrials return a modest 1.3%, down from the historical 2.1% yield.
- The overall S&P 500 index posts a 1.2% yield, trailing its 10-year average of 1.9%.
- Communication services deliver just 0.8%, down from the 1.3% average.
- Consumer Discretionary yields fall to 0.7%, below the 1.3% 10-year norm.
- The technology sector has the lowest yield at 0.5%, half its 1.0% long-term average.
Dividend Reinvestment (DRIP) Compounding Statistics
- DRIP turns $10,000 into $32,469 over 10 years at 8% yield and 4% growth.
- 71.9% of global dividend changes were increases in 2025.
- Global dividends grew 7.7% year-over-year in H1 2025 to $1.14 trillion.
- 3% yield with 5% growth doubles income in ~14 years via DRIP compounding.
- Without DRIP, the S&P 500 annualized returns have dropped ~4% over the past 100 years.
- Dividend reinvestment accounted for 38% of historical S&P 500 returns.
Income Generation From Dividends in Retirement
- Dividend-paying stocks generated $427,984 income vs. bonds’ $39,976 from $1 million over 30+ years.
- Retirement portfolios target 4–6% yields with growth for 2025 income.
- Payout ratios of 40–60% signal sustainable dividends for retirement.
- $1 million portfolio needs $1.4–1.8M at 3.5–4.5% yield for $66K annual income.
- Dividends outpaced inflation 3x from 1980–2023 in the S&P 500.
- Dividend stocks accounted for nearly 50% of S&P 500 returns since 1900.
- Sustainable payout ratios under 80% support retirement dividend growth.
Optimal Dividend Strategy Allocation Insights
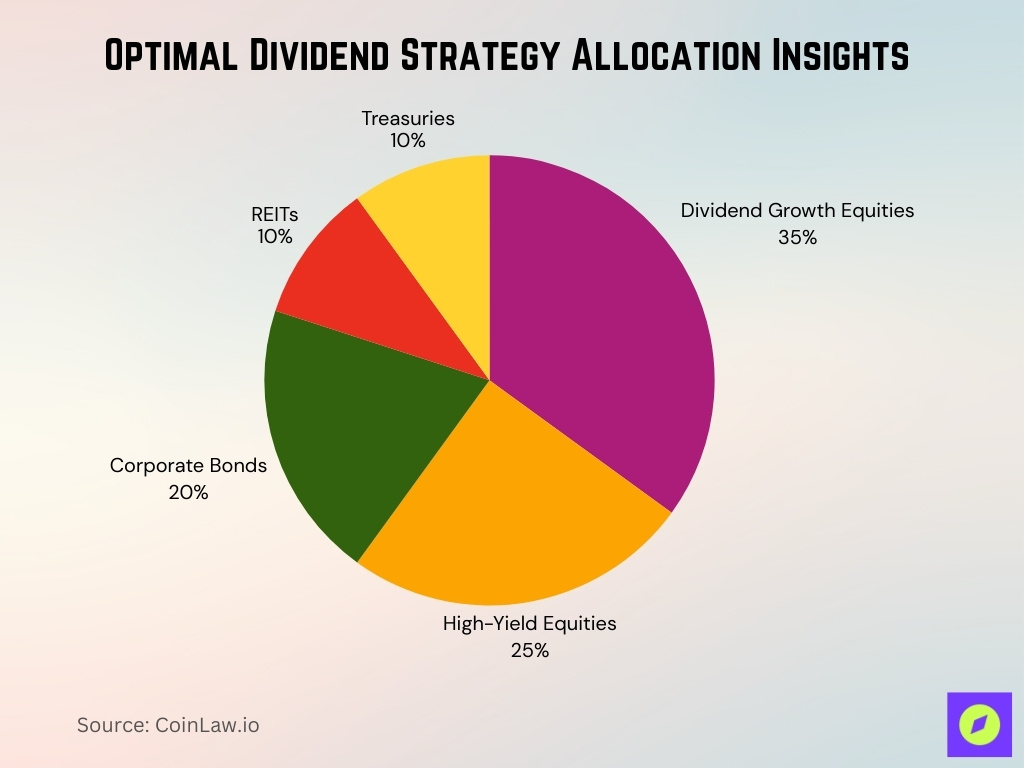
- Dividend Growth Equities make up the largest portion at 35%, emphasizing long-term income stability and compounding potential.
- High-Yield Equities account for 25%, targeting enhanced cash flow during low-growth or high-rate environments.
- Corporate Bonds represent 20%, offering predictable income with moderate credit risk exposure.
- REITs hold a 10% allocation, adding real estate-backed dividend streams and inflation protection.
- Treasuries round out the portfolio with 10%, providing safety and interest income during economic slowdowns.
Volatility and Drawdown Metrics for Dividend Portfolios
- Dividend payers showed lower volatility and max drawdowns than the broad market over 3 years to 2024.
- SDY average drawdown -8.6% vs. the market’s -9.4% in the worst 15 months since 2005.
- S&P 500 Dividend Aristocrats outperformed the S&P 500 in 66.67% of down months.
- Dividend stocks exhibited 16% less volatility with smaller max drawdowns vs. high volatility high yield.
- Low volatility high dividend index reduced volatility 10.4% vs. S&P 500 since inception.
- Dividend portfolios delivered higher Sharpe ratios due to lower risk-adjusted volatility.
- S&P 500 average yearly drawdown 14% since 1980 has been exceeded by dividend strategies.
- Dividend payers held up better during 10%+ S&P 500 drawdowns historically.
Dividend Cuts, Suspensions, and Recovery Rates
- Global dividends hit record $518.7 billion in Q3 2025, up 6.2% year-over-year.
- 88% of global companies increased or held dividends steady in Q3 2025.
- Q1 2025 saw 57 dividend decreases, down 11.8% from Q1 2024.
- US dividend decreases totaled $15.6 billion for 12 months to March 2025, down 38.3%.
- 138 issues cut dividends in 12 months to March 2025, 37% fewer than the prior year.
- Mining and energy sectors led Australia‘s 7.4% dividend decline in 2025.
- Financials were the single largest driver of global dividends in Q3 2025, helping push payouts to a record $518.7 billion, up 6.2% year‑on‑year on a headline basis.
- 97% of dividend cuts have been caught in advance by safety scores historically.
Correlation of Dividend Stocks With Broader Equity Indexes
- Dividend ETFs saw $3.3 billion average monthly inflows in H2 2025, up from $107 million.
- Dividend payers lower volatility and drawdowns vs. the broad market over 3 years to 2024.
- S&P 500 Dividend Aristocrats outperformed the S&P 500 in 66.67% down months.
- Dividend-paying stocks outpace non-payers by 1-2% monthly in declining markets.
- Over very long horizons, cash dividend payouts themselves have represented around 30–35% of the S&P 500’s total return, with the rest coming from price appreciation and the reinvestment of those dividends.
- Mid-yield dividend strategies historically beat low/high yield over long periods.
- S&P 500 dividend yield hit a 1.15% low in 2025, the lowest since the dotcom bubble.
- Overall ETF flows neared $900 billion–$1 trillion YTD by mid‑2025, and dividend ETFs captured a meaningful slice of that growth alongside other popular factor strategies.
Dividend Investing vs Growth Investing Returns
- Dividend growth strategies outperformed high-yield indexes long-term with less volatility.
- Dividend payers delivered higher Sharpe ratios vs. non-dividend growth stocks historically.
- Global dividend ETFs attracted $23.7 billion in inflows H1 2025, the highest in 3 years.
- Dividend growers averaged a 2.9% yield vs. the market’s 1.8% over the long term.
- Sortino ratios favor dividend stocks in bear markets due to lower downside risk.
- Dividend strategies beat the S&P 500 with reduced volatility across market cycles.
- ETF flows hit $1.09 trillion YTD 2025, dividend funds gaining significant share.
Taxation Impact on Dividend Returns
- Qualified dividends are taxed at 0%, 15%, or 20% based on 2025 income levels.
- Foreign withholding taxes average 15-30% on international dividends before treaties.
- Tax-deferred IRAs grow $100,000 to $239,000 over 15 years vs. $193,000 taxable at 6%.
- Single filers pay 0% on qualified dividends up to $48,350 of taxable income in 2025.
- Married joint threshold for 0% qualified dividend tax: $96,700 in 2025.
- 15% rate applies $48,351-$533,400 single or $96,701-$600,050 joint 2025.
- Non-qualified dividends are taxed at ordinary rates up to 37% vs. qualified’s max 20%.
- U.S.-treaty countries reduce foreign withholding to 15% from the standard 30%.
Yield on Cost and Long-Term Income Growth
- Visa YOC reached 12% after 15 years from 0.2% initial yield via 22% CAGR growth.
- Reinvested dividends have accounted for roughly 80–85% of the S&P 500’s cumulative wealth creation since 1960, underscoring how income and compounding dominate long‑run equity returns.
- Dividend growers like Extra Space Storage hiked payouts 110%+ over the past decade.
- Yield on cost doubles in ~14 years at 5% dividend growth from 3% starting yield.
- S&P 500 Aristocrats show higher YOC levels vs. high-yield indexes long-term.
- UNP YOC is projected to nearly double to 4.58% by 2030 at 8% annual growth.
- McDonald’s first tranche YOC hit 10.12% through consistent dividend increases.
- $100K in S&P 500 with reinvested dividends grew to $2.27 million since 1970.
Dividend ETF Performance and Yield Statistics
- Global dividend ETFs attracted $23.7 billion in inflows H1 2025, the highest in 3 years.
- SPHD delivered a 3.76% YTD return with a 3.85% trailing yield as of Nov 2025.
- Vanguard High Dividend Yield ETF posted 12.5% 5-year annualized returns.
- Dividend ETFs exhibit lower volatility than the S&P 500 due to stable holdings.
- Fidelity High Dividend ETF offers a 3.09% 12-month yield with a Silver rating.
- Factor dividend ETFs saw $0.9 billion in October inflows, led by Value strategies.
- VYM reported a 12.85% YTD performance tracking a high-yield index.
- Nuveen ESG Dividend ETF yields 5.44% among the top high dividend options.
Frequently Asked Questions (FAQs)
Global dividend payouts are forecasted to reach $1.83 trillion in 2025.
71.9% of all dividend changes were increases in 2025.
The MSCI U.S. Index dividend yield stands at approximately. 1.19% in late 2025.
According to a 2025 yield ranking, Italy (FTSE MIB) showed the highest among major economies, with a yield of 5.16%.
Conclusion
Dividend investing today remains a powerful strategy for building income, reducing portfolio volatility, and compounding wealth over time. Rising global dividends, stronger payout ratios, and increased investor demand have reinforced the role of dividends in both growth-oriented and income-oriented portfolios. While risks such as dividend cuts remain, especially in cyclical sectors, disciplined payout policies and reinvestment strategies continue to support long-term return potential. As investors navigate changing market conditions, dividend strategies offer stability, resilience, and meaningful income, making them a vital component of diversified portfolios.


