In early 2020, Ethereum was the undisputed king of smart contracts. Then came Binance Smart Chain, fast and low-cost, winning over a new wave of developers and users. In 2025, the battle for dominance between the two ecosystems has reached a new peak. Whether you’re a retail investor, developer, or DeFi degen, understanding their metrics is key to navigating this evolving blockchain economy. Let’s dive into the hard numbers behind the hype and see how BSC and Ethereum stack up in today’s multichain world.
Key Takeaways
- 1Ethereum’s market cap has reached $387 billion, compared to $294 billion for BSC.
- 2Daily transaction count on BSC exceeds 4.1 million, doubling Ethereum’s 2.02 million.
- 3BSC’s average gas fee remains under $0.04, while Ethereum averages $1.17 post-EIP-4844.
- 4Ethereum hosts over 560,000 active validators, while BSC operates with just 50.
RWA Value by Blockchain
- Ethereum leads with a massive $3.80 billion in real-world asset (RWA) value.
- ZKsync Era follows with an impressive $2.00 billion in RWA holdings.
- Stellar secures third place, recording $302.70 million in assets.
- Polygon holds $181.50 million, reflecting growing adoption in asset tokenization.
- Solana reaches $135.40 million, pushing into the RWA space.
- Avalanche accounts for $132.30 million, showing solid engagement.
- Binance Smart Chain reports $0.00, indicating no RWA value tracked on the chain.

Market Capitalization and Network Valuation
- Ethereum’s market cap sits at $387 billion, a 14% increase year-over-year.
- Binance Smart Chain’s market cap grew to $294 billion.
- ETH token price stands at $3,184, while BNB is at $538.
- Ethereum dominates Layer 1 TVL with $102 billion; BSC trails with $58 billion.
- Ethereum’s circulating supply is around 120.3 million ETH.
- BNB total supply remains at 157.9 million, with 98% in circulation.
- Ethereum network revenue from gas fees reached $2.4 billion in Q1 2025.
- BSC network revenue stood at $481 million, largely from DeFi and GameFi.
- Ethereum Foundation’s treasury holds $1.2 billion; BNB Chain Fund totals $489 million.
- Ethereum Layer 2 ecosystems now hold a combined market cap of $47 billion.
- Major BSC ecosystem tokens like PancakeSwap and Venus account for $12.6 billion in total valuation.
Daily Transaction Volume Comparison
- BSC processes over 4.1 million transactions per day, a 22% rise from last year.
- Ethereum processes 2.02 million daily transactions, maintaining steady Layer 1 activity.
- Average throughput for BSC is 285 TPS, compared to Ethereum’s 26 TPS.
- Ethereum’s Layer 2 networks now account for 54% of all Ethereum transaction volume.
- BSC hit a peak of 5.4 million transactions in a single day in March 2025.
- Ethereum’s peak daily transactions reached 2.31 million, aided by rollups.
- BSC’s average daily transaction value is $3.9 billion.
- Ethereum processes $11.8 billion in daily value, driven by institutional-grade apps.
- Median confirmation time is 2.3 seconds on BSC, versus 13.1 seconds on Ethereum.
- Combined, Ethereum L2s process over 3.4 million daily transactions.
Binance Smart Chain vs Ethereum: Key Differences
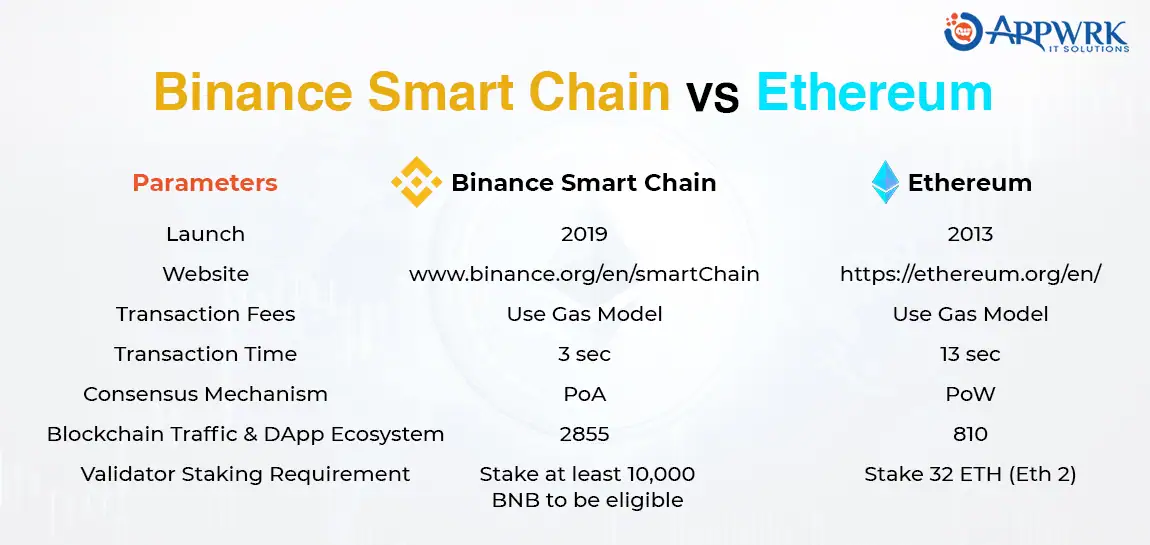
- Binance Smart Chain launched in 2019, while Ethereum started in 2013, giving Ethereum a significant head start.
- Both use a Gas Model for transaction fees, but differ in performance and structure.
- BSC processes transactions in just 3 seconds, compared to Ethereum’s 13 seconds.
- Consensus mechanism differs: BSC uses PoA (Proof of Authority), while Ethereum used PoW (Proof of Work) before migrating to PoS.
- Blockchain traffic and DApp count are 2,855 on BSC versus 810 on Ethereum, highlighting BSC’s ecosystem growth.
- Validator requirement on BSC is 10,000 BNB, while Ethereum requires 32 ETH for staking (under Ethereum 2.0).
Active Wallet Addresses on Both Chains
- Ethereum has 114.6 million unique wallet addresses that interacted in 2025.
- BSC reports 193.8 million active addresses, driven by gaming and microtransactions.
- Ethereum sees 3.2 million monthly active wallets; BSC sees 5.7 million.
- Daily active wallets average 612,000 on Ethereum, compared to 1.4 million on BSC.
- Ethereum wallet growth rate is 8.4%; BSC’s is 15.2% year-over-year.
- Ethereum wallet usage is 48% DeFi, 31% NFTs, 21% other.
- BSC wallets are 62% GameFi, 23% DeFi, and 15% utility-focused.
- High-value wallets ($10K+) are 42% more prevalent on Ethereum than BSC.
- BSC recorded over 4.3 billion wallet interactions YTD 2025.
- Ethereum recorded 2.9 billion on-chain wallet activities in Q1 2025.
Gas Fees and Transaction Costs
- The average transaction fee on Ethereum in 2025 is $1.17, down from over $3 in 2023 due to proto-danksharding (EIP-4844).
- BSC users continue to benefit from low fees, averaging just $0.04 per transaction.
- Ethereum L2 solutions now offer fees as low as $0.015 per swap, with Base and Arbitrum leading.
- The highest observed fee spike on Ethereum this year reached $18.33 during NFT mints in January.
- BSC’s max recorded fee spike was only $0.26, during a memecoin surge in April.
- Median gas usage per transaction on Ethereum is around 55,000 gas, compared to 37,000 gas on BSC.
- Ethereum’s EIP-4844 reduced blob transaction costs by 45%, improving L2 economics.
- Users spent approximately $612 million in total gas fees on Ethereum in Q1 2025 alone.
- BSC’s total transaction fee revenue in the same quarter was $110 million, with most volume from PancakeSwap and Mobox.
- Ethereum validators earned over $320 million in priority fees YTD, while BSC validators shared $73 million.
- Around 58% of Ethereum transactions now occur on rollups, drastically lowering the effective fee burden for users.
Ethereum Supply Distribution: On-Chain Breakdown
- The Beacon Chain holds the majority share with 55.6% of the total ETH supply.
- Other wallets and contracts collectively account for 17.7%, showing wide distribution beyond known entities.
- Centralized exchanges (CEX) control 15.3% of Ethereum’s circulating supply.
- WETH contracts represent 5.2%, highlighting usage in DeFi wrapping mechanisms.
- The Ethereum Foundation owns 4.3%, reflecting its governance and operational role.
- Bridges hold approximately 0.95%, indicating cross-chain activity.
- DeFi platforms manage about 0.95%, tied to decentralized finance protocols.

Block Time and Transaction Finality
- The average block time for Ethereum is now 12.6 seconds, following recent consensus upgrades.
- BSC’s block time is significantly faster at 3.0 seconds, consistent since 2023.
- Ethereum’s finality time sits around 13 minutes, whereas BSC achieves finality within 30 seconds.
- On rollups like Arbitrum and Base, Ethereum achieves soft finality within 2 minutes.
- BSC records an average of 28,800 blocks per day, Ethereum around 6,900.
- The number of reorgs on Ethereum has dropped by 62% after the Dencun upgrade.
- BSC experienced 11 major chain reorgs in 2025 due to validator collisions.
- Ethereum’s slot-based consensus has increased block predictability by 24%.
- BSC utilizes a modified PoSA model (Proof of Staked Authority), maintaining a 3-second block production even under load.
- Time-to-inclusion (from mempool to block) is under 1.5 seconds for BSC; Ethereum averages 4.2 seconds.
- Ethereum’s total block rewards for Q1 2025 are 17,800 ETH, while BSC distributed 5.1 million BNB in validator incentives.
Validator and Node Distribution
- Ethereum has over 560,000 active validators across L1, spread globally with diverse clients.
- BSC maintains a capped validator set of 50, with 21 active at a time based on stake ranking.
- Ethereum node decentralization spans 68 countries, with 32% in the US and 19% in Germany.
- BSC validators are largely centralized in 8 core jurisdictions, including Singapore and the UAE.
- The average staking requirement for Ethereum is 32 ETH, while BSC requires over 10,000 BNB for eligibility.
- Ethereum’s client diversity: 42% Prysm, 28% Lighthouse, 21% Teku, and 9% others.
- BSC relies heavily on 1 core client, with less than 3% of nodes running alternate versions.
- Slashing incidents on Ethereum reached 43 in 2025, mostly due to configuration errors.
- BSC has yet to implement full slashing; misbehaving validators are rotated out silently.
- Ethereum staking services (like Lido, Rocket Pool) hold 41% of total validators.
- BSC validator concentration means 5 entities control over 60% of the staking weight.
Top 10 Blockchain Networks by Revenue
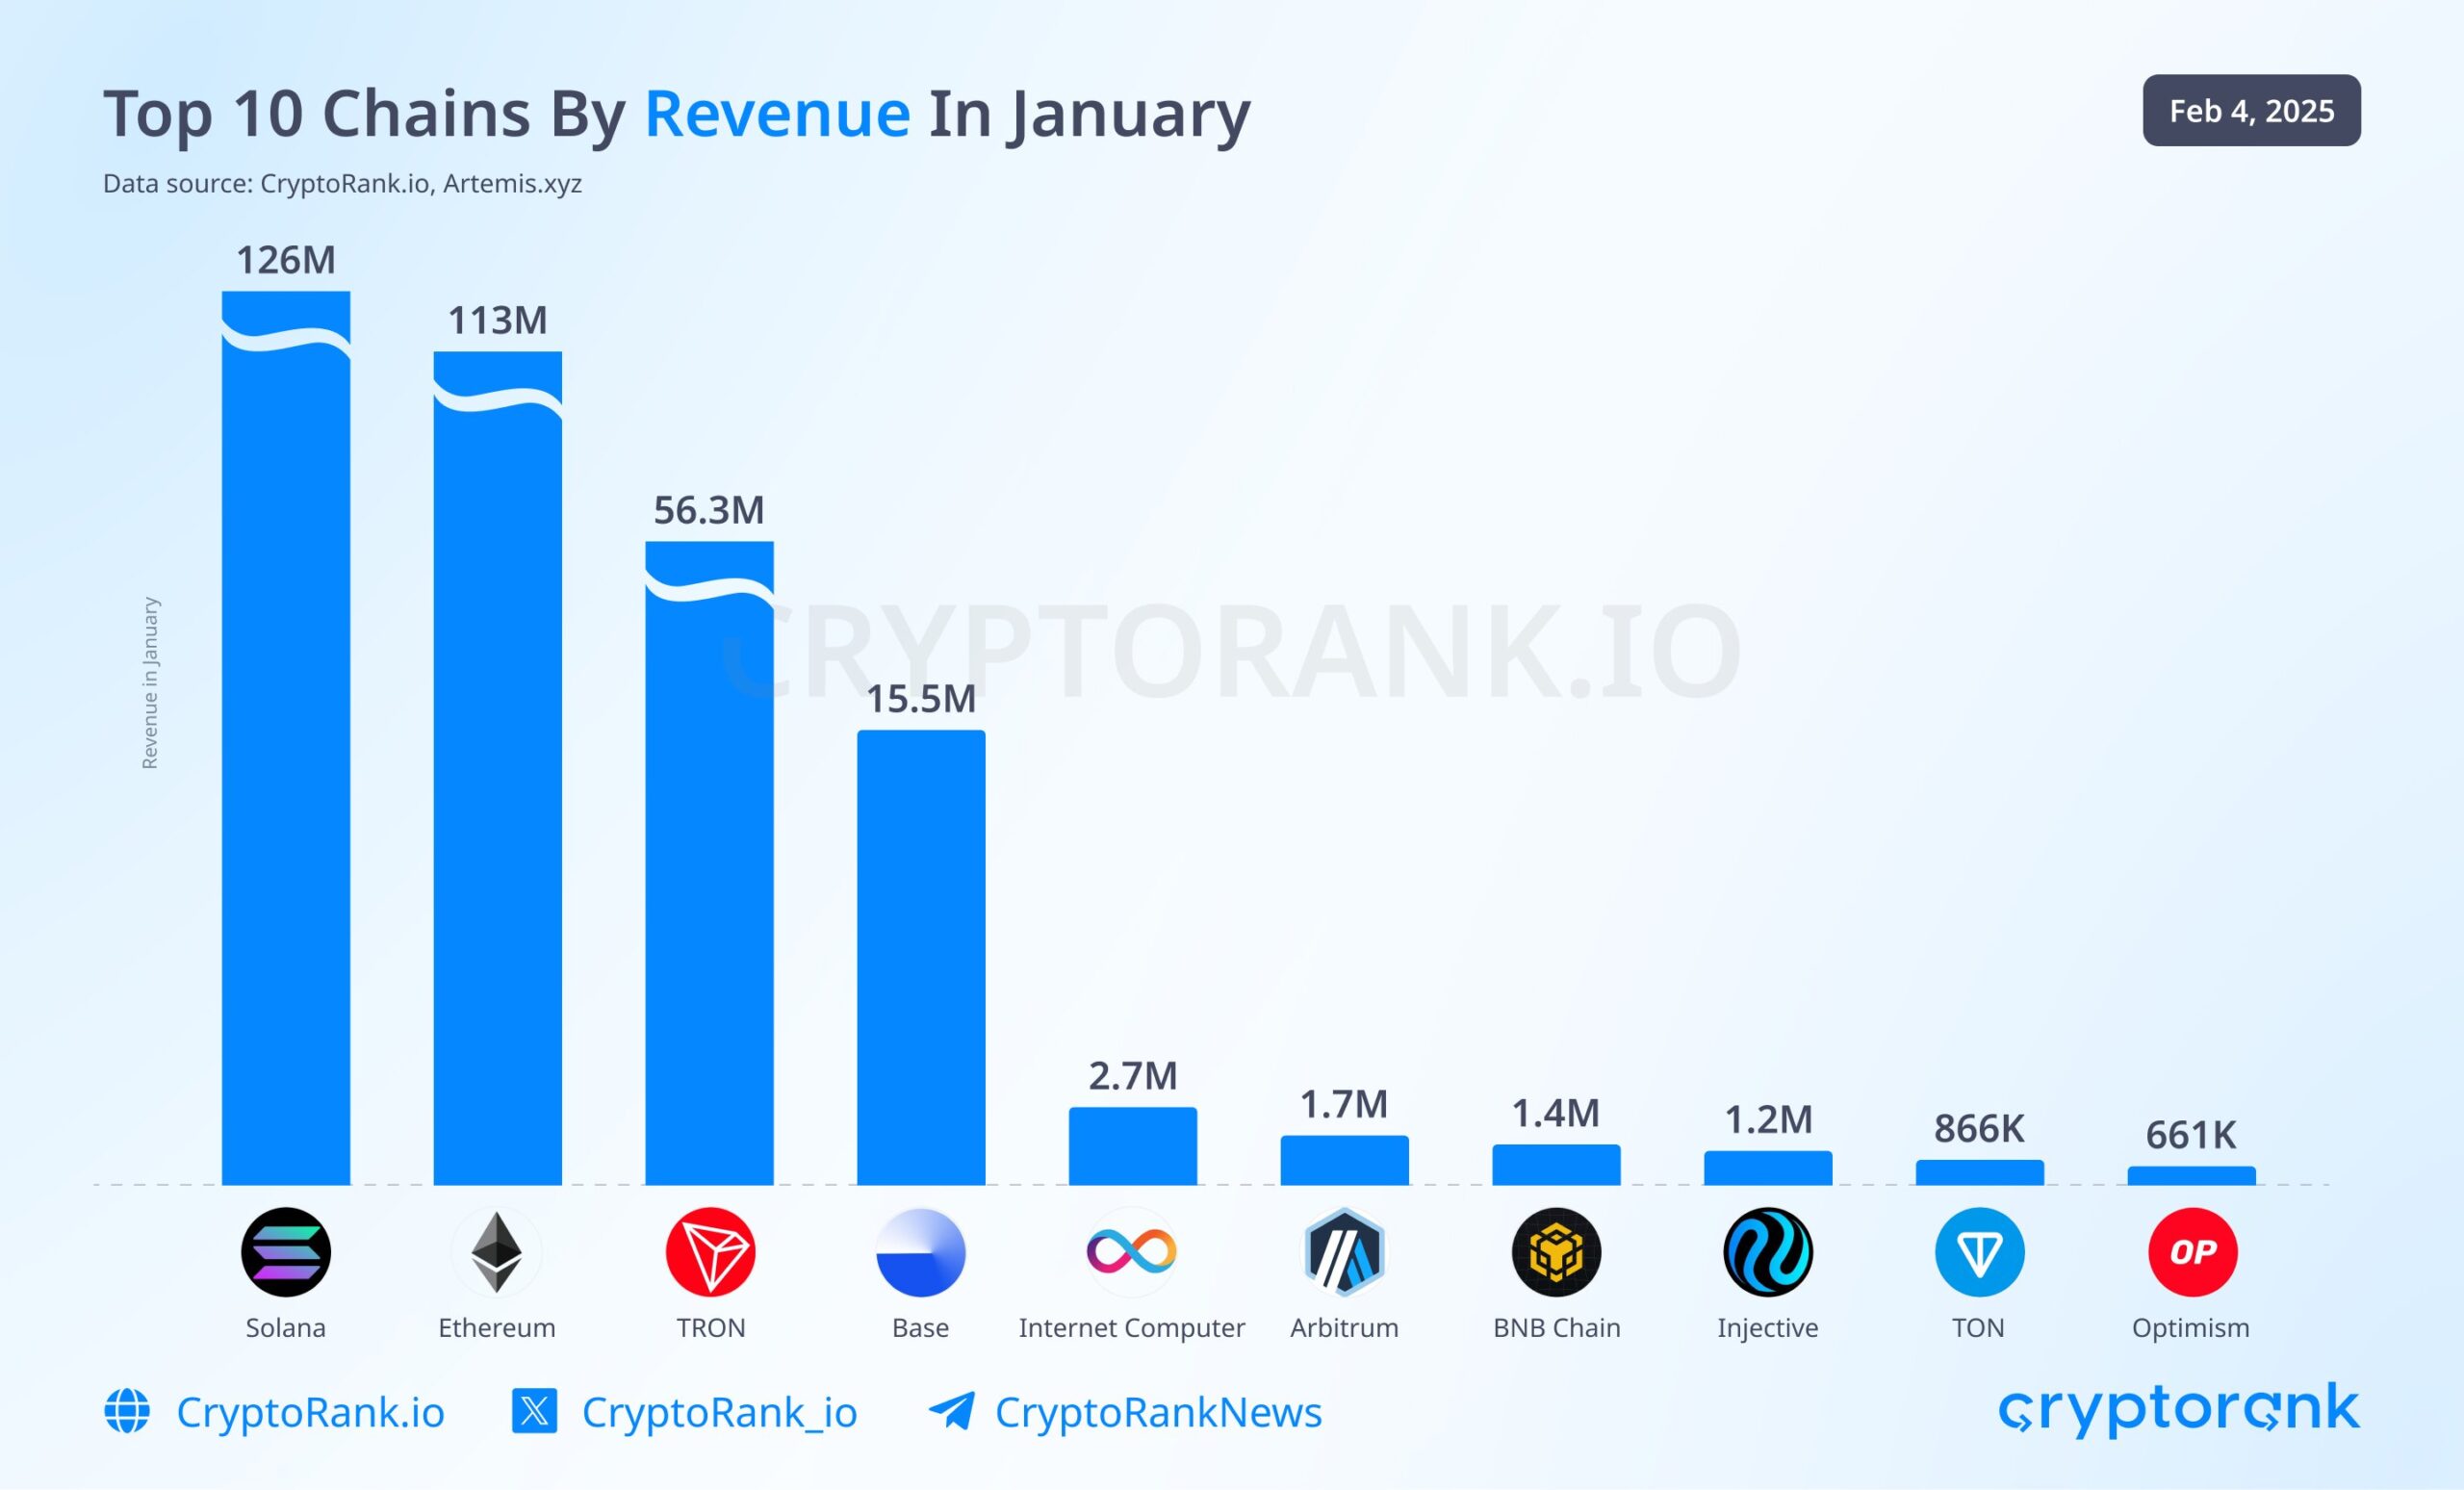
- Solana led the month with $126 million in revenue, taking the top spot.
- Ethereum followed closely with $113 million, maintaining its strong ecosystem presence.
- TRON generated $56.3 million, securing third place among revenue-generating chains.
- Base, Coinbase’s L2 solution, earned $15.5 million.
- Internet Computer posted $2.7 million, showing steady activity.
- Arbitrum brought in $1.7 million, ahead of its L2 rival Optimism.
- BNB Chain recorded $1.4 million in revenue.
- Injective followed with $1.2 million, reflecting rising DeFi interest.
- TON registered $866K, gaining traction within Telegram’s ecosystem.
- Optimism rounded out the list with $661K, trailing Arbitrum in L2 earnings.
Smart Contract Deployments and Usage Trends
- Ethereum recorded over 6.2 million new smart contract deployments in the first half of 2025.
- BSC saw 4.1 million, with growth driven by gaming, DeFi, and token factories.
- Contract failure rate is 1.8% on Ethereum, while BSC reports a lower 0.9%, due to simplified architecture.
- Verified contracts on Etherscan increased by 17%, with over 1.9 million open-source deployments.
- BSCscan shows 2.6 million verified contracts as of June 2025.
- Ethereum leads in smart contract interaction volume, averaging 33 million calls per day.
- BSC processes over 41 million contract interactions daily, thanks to higher throughput.
- Solidity remains dominant on both chains, but Vyper and Huff gained traction on Ethereum.
- Ethereum introduced a new contract type for account abstraction (ERC-4337) with 900,000+ smart wallets created.
- BSC’s pre-built contract frameworks drove a 26% increase in deployments from no-code tools.
- Gas-optimized contracts on Ethereum reduced bytecode size by an average of 11.2% in 2025.
DeFi Ecosystem Growth Metrics
- Ethereum continues to lead with a total value locked (TVL) of $102 billion across its DeFi protocols.
- BSC’s DeFi TVL is $58 billion, reflecting a strong user base in yield farming and micro lending.
- Uniswap remains the top Ethereum DEX, with a daily volume of $1.8 billion.
- PancakeSwap dominates BSC, processing over $950 million per day in swaps.
- Ethereum supports over 1,200 active DeFi protocols in 2025; BSC hosts 670+.
- BSC leads in the number of active yield farms, with over 3,400 farming pools live.
- Lido Finance is Ethereum’s largest liquid staking platform, with $21.6 billion in staked ETH.
- BSC’s largest protocol by TVL is Venus, with $7.3 billion in lending and collateralized positions.
- Ethereum saw $97 billion in flash loan volume YTD; BSC’s figure stands at $34 billion.
- Ethereum Layer 2s now contribute over $29 billion to the combined DeFi TVL.
- Stablecoins on Ethereum total $89 billion, while BSC supports about $42 billion, mainly in BUSD and USDT.
- The average DEX transaction size is $1,050 on Ethereum, versus $210 on BSC.
- Ethereum-based DAOs now control $11.2 billion in treasury funds.
- BSC DAOs hold approximately $2.7 billion, growing fast with GameFi integration.
- Ethereum governance participation rates average 13.8%, and BSC averages 6.1%.
Top Cryptocurrency Exchanges by Trading Volume
- SuperEx dominates the market with a staggering $163.61 billion in trading volume.
- Binance ranks second with $15.41 billion, far behind SuperEx.
- 4E Exchange recorded a volume of $3.52 billion, placing it in the top tier.
- BiFinance follows closely with $3.32 billion in total trading.
- HTX posted a healthy $2.99 billion in exchange activity.
- Darkex Exchange reported $2.95 billion in volume for the year.
- Zedcex Exchange handled $2.59 billion, maintaining a mid-tier presence.
- Bybit registered $2.47 billion, reflecting solid user engagement.
- MEXC achieved $2.45 billion in trading transactions.
- OKX rounds out the list with $2.30 billion in trading volume.

NFT Activity Across Both Chains
- Ethereum remains the NFT leader, with over 41 million NFTs minted in 2025.
- BSC surpassed 62 million NFT mints, largely due to gaming and mass-mint platforms.
- OpenSea still commands Ethereum’s top marketplace slot, transacting $3.2 billion YTD.
- BSC’s top NFT marketplace, Element, processed $1.4 billion so far in 2025.
- Ethereum NFT daily volume averages $67 million, while BSC sees $34 million.
- The average NFT mint cost is $15 on Ethereum (gas inclusive), versus just $0.40 on BSC.
- Ethereum saw a record-breaking single NFT sale of $6.8 million in April.
- BSC’s highest NFT sale in 2025 reached $440,000, a collectible from a mobile RPG.
- Ethereum’s ERC-721 standard remains dominant, but ERC-1155 usage grew 22%.
- BSC supports the BEP-721 and BEP-1155 formats, both optimized for lower-cost batch minting.
- Ethereum NFT platforms like Zora and Sound.xyz now powers 17% of creator economy transactions.
- BSC launched 3 new NFT Layer 3 chains in 2025, increasing total throughput by 36%.
Developer Activity and GitHub Contributions
- Ethereum maintains the largest Web3 developer base, with 5,900+ active monthly contributors.
- BSC trails with 2,300+ active developers, with faster growth in GameFi and tooling.
- Ethereum repos on GitHub saw 136,000+ commits YTD 2025.
- BSC GitHub projects had 61,000+ commits, led by projects like PancakeSwap and ApeSwap.
- Solidity is used in over 88% of Ethereum’s smart contracts; Vyper’s adoption is at 7%.
- BSC developers primarily use Solidity; Rust and Golang adoption is <2%.
- Ethereum’s main developer conferences (e.g., Devcon) attracted 18,000+ attendees globally in 2025.
- BSC’s ecosystem summits saw 7,300+ attendees, with a strong presence in Southeast Asia.
- Ethereum developer grant funding totals $94 million this year.
- BSC’s Builder Grant program allocated $38 million across tooling, gaming, and education.
- Ethereum’s core protocol repos have 2,100+ forks, and BSC’s core client has 580.
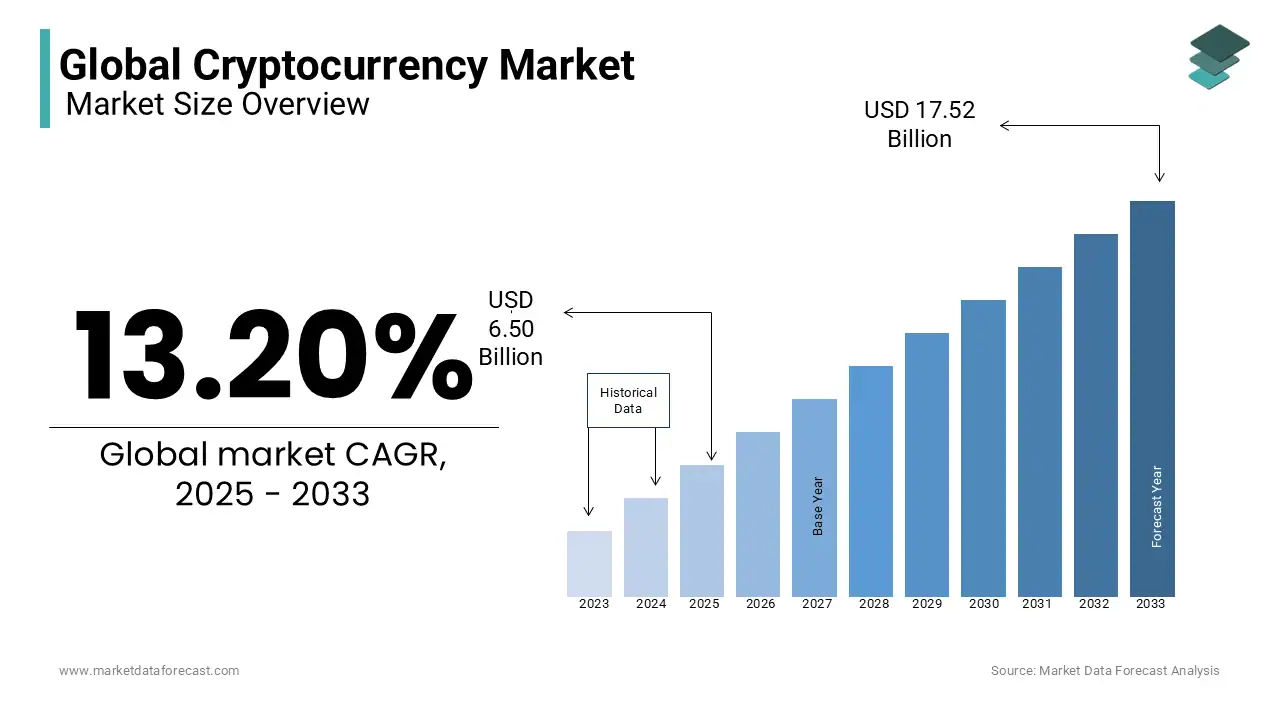
Global Cryptocurrency Market Size Forecast
- The global cryptocurrency market is projected to grow at a CAGR of 13.20% from 2025 to 2033.
- Market size is expected to rise from $6.50 billion in 2025 to $17.52 billion by 2033.
- 2025 is labeled as the base year, while 2023 and 2024 provide historical benchmarks.
- The bar graph shows steady annual growth, reflecting increased adoption and investment.
- The forecast indicates nearly a 3x market expansion over the 8-year period.
Security Incidents and Network Reliability
- Ethereum has had 0 confirmed major breaches in 2025 so far; smart contract audits are now standard.
- BSC experienced 6 security incidents, mainly involving unaudited GameFi tokens.
- The largest BSC exploit this year resulted in a $32 million protocol drain via oracle manipulation.
- Ethereum bug bounty payouts totaled $3.8 million in 2025.
- BSC paid out $1.2 million in bounties, with most reports via Immunefi.
- Ethereum’s average uptime is 99.996%, while BSC’s stands at 99.982%.
- Reorgs on Ethereum dropped by 62% compared to 2024.
- BSC had 3 validator desync incidents, resolved within 6 minutes each.
- Audited smart contract deployment rate is 74% on Ethereum, 41% on BSC.
- Ethereum deployed a new on-chain circuit breaker mechanism in Q2 2025.
- BSC enhanced on-chain logging via BEP-340 to help track exploit vectors faster.
Institutional Adoption and Ecosystem Support
- Ethereum has over 320 institutional partners actively building or investing in 2025.
- BSC is backed by over 120 institutional players, largely focused on DeFi and gaming infrastructure.
- BlackRock tokenized a $700 million bond on Ethereum in February 2025.
- BSC’s largest institutional product is a $100 million gaming fund led by Animoca Brands.
- Ethereum’s ecosystem now includes 190+ enterprise-grade dApps, and BSC has 110+.
- Coinbase and JPMorgan are actively deploying pilots on Ethereum testnets.
- Binance Labs funded over 48 new projects on BSC this year.
- Ethereum Foundation’s ecosystem grants exceed $94 million, BSC’s sit at $38 million.
- MetaMask Institutional supports full Ethereum and rollup integration; BSC support is partial.
- Ethereum custodial wallet adoption grew 31%, and BSCs rose 18%.
Recent Developments
- Ethereum’s Dencun upgrade activated in Q1 2025, cutting rollup fees by 45%.
- BSC rolled out BEP-341, optimizing event indexing and improving explorer performance.
- Arbitrum Orbit launched support for multi-language VM compatibility on Ethereum.
- BSC launched Layer 3 gaming sidechains with native cross-chain asset flow.
- Ethereum devs proposed EIP-7623 for real-time fee markets, now under testnet review.
- BSC introduced auto-liquid staking via Binance Earn for BNB holders.
- Ethereum finalized integration with Chainlink CCIP for seamless cross-chain messaging.
- BSC announced plans for a decentralized sequencer by the end of 2025.
Conclusion
Ethereum and Binance Smart Chain have evolved into distinct blockchain ecosystems serving different needs. Ethereum excels in decentralization, developer depth, and institutional-grade applications. BSC dominates in speed, affordability, and retail user acquisition, particularly in gaming and micro DeFi. In 2025, both chains continue to grow, not in competition alone but as complementary pillars of a multichain Web3 economy. As technology and users mature, success will be defined not by one winner, but by how well each chain adapts to its strengths.


