Arbitrum’s rise underscores its importance as a high‑throughput, low‑cost Layer‑2 platform on Ethereum. Its network now hosts over $19.21 billion in Total Value Locked (TVL) and handles 2.16 billion transactions, positioning it as a dominant player in the Layer‑2 landscape. Real‑world applications range from institutional publishing of economic data on‑chain, such as U.S. GDP reports, to Robinhood’s tokenized U.S. stock access, which leverages Arbitrum’s infrastructure for fast, low‑fee execution. Want to explore how these numbers reveal deeper insights? Dive into the full article below.
Editor’s Choice
- $19.21 billion TVL, the highest among Ethereum L2s as of early September 2025.
- 2.16 billion total transactions, reflecting substantial network activity.
- 37.1 % L2 market share, indicating Arbitrum’s dominance.
- 1.45 million active wallets, a broad and active user base.
- Over $12 billion TVL earlier in 2025, showing exponential growth in liquidity.
- Daily active addresses surged 37.7 % month‑over‑month by June 2025, driven by stablecoin and DeFi demand.
- Stablecoins held on-chain ~ $3.44 billion, with USDC comprising ~58 %.
Recent Developments
- The U.S. Department of Commerce began publishing quarterly GDP data on Arbitrum One starting in July 2025.
- Arbitrum DAO emphasizes growth driven by user retention and organic adoption, with the DAO treasury holding 3.5 billion ARB (~$1.3 billion).
- In Q2 2025, South Korean investors reportedly reduced exposure to Tesla, reallocating significant capital into crypto assets, contributing to higher activity on Ethereum Layer-2 platforms like Arbitrum.
- June 2025, Stylus updates enabled smart contracts in Rust, C, and C++, plus custom Layer‑3 support via Orbit.
- In April 2025, Timeboost gas‑fee ordering launched, generating over $2 million in revenue.
- Partnered with Robinhood to bring tokenized U.S. stocks to European users, and plans for an Arbitrum‑based L2 by Robinhood’s Orbit framework.
Arbitrum wstETH Lending Market Statistics
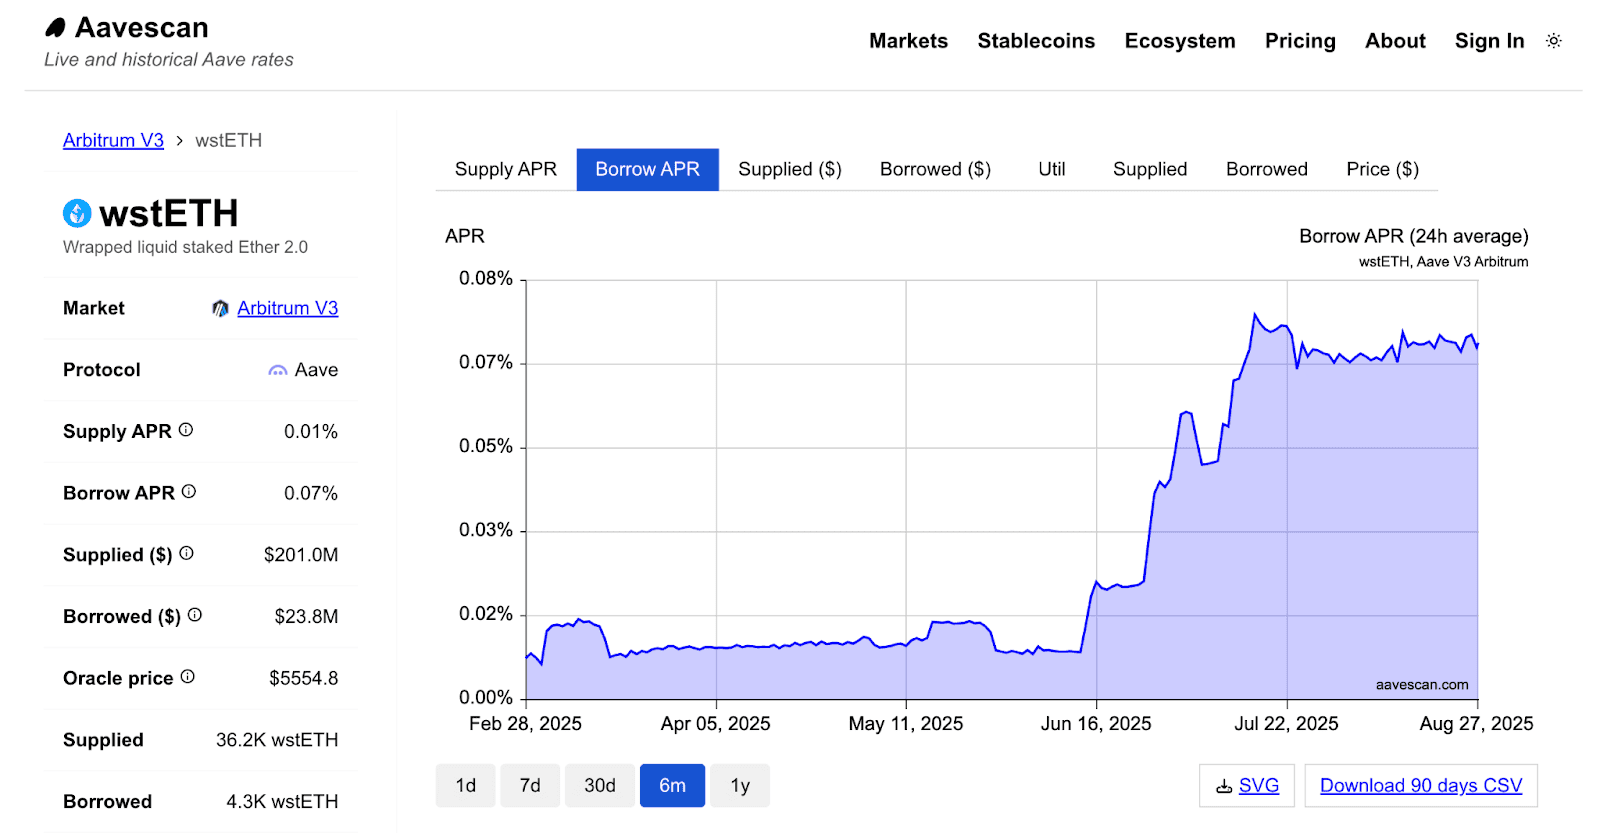
- Supply APR on Aave V3 for wstETH is just 0.01%, reflecting low yields for lenders.
- Borrow APR averages 0.07%, showing relatively cheap leverage opportunities on Arbitrum.
- Over $201 million worth of wstETH has been supplied, equivalent to 36.2K tokens.
- Borrowed value stands at $23.8 million, equal to about 4.3K wstETH.
- The oracle price of wstETH is $5554.8, aligning closely with ETH’s market valuation.
- The Borrow APR trend stayed flat near 0.02% through spring 2025, but surged in June–July 2025, peaking around 0.078% before stabilizing at 0.07% by late August.
Arbitrum Key Metrics Overview
- TVL: $19.21 billion as of September 2025.
- Total transactions: 2.16 billion processed.
- Active wallets: 1.45 million using the chain.
- L2 market share: 37.1 %, highest among competitors.
- June 2025 TVL history: climbed from ~$1.3 billion (end 2024) to $8.6 billion mid‑2025, a +330 % increase.
- Bridge deposits: $4.6 billion, down ~67 % from peak, suggesting high capital reuse within the network.
- TVL YTD high: $3.39 billion earlier in 2025.
Total Value Locked (TVL)
- $19.21 billion as of early September 2025.
- $8.6 billion by June 2025, a record high among Ethereum L2s.
- Growth of +330 % from end‑2024 to mid‑2025.
- YTD high of $3.39 billion earlier in 2025, showing steady appreciation.
- Stablecoin TVL: ~$5.6 billion, lending utilization ~13.7 %.
- $3.44 billion in stablecoins on‑chain (USDC ~58 %).
- TVL vs Bridge: deployed/bridge ratio ~186 %, highlighting capital recycling.
ARB Token Allocation and Vesting
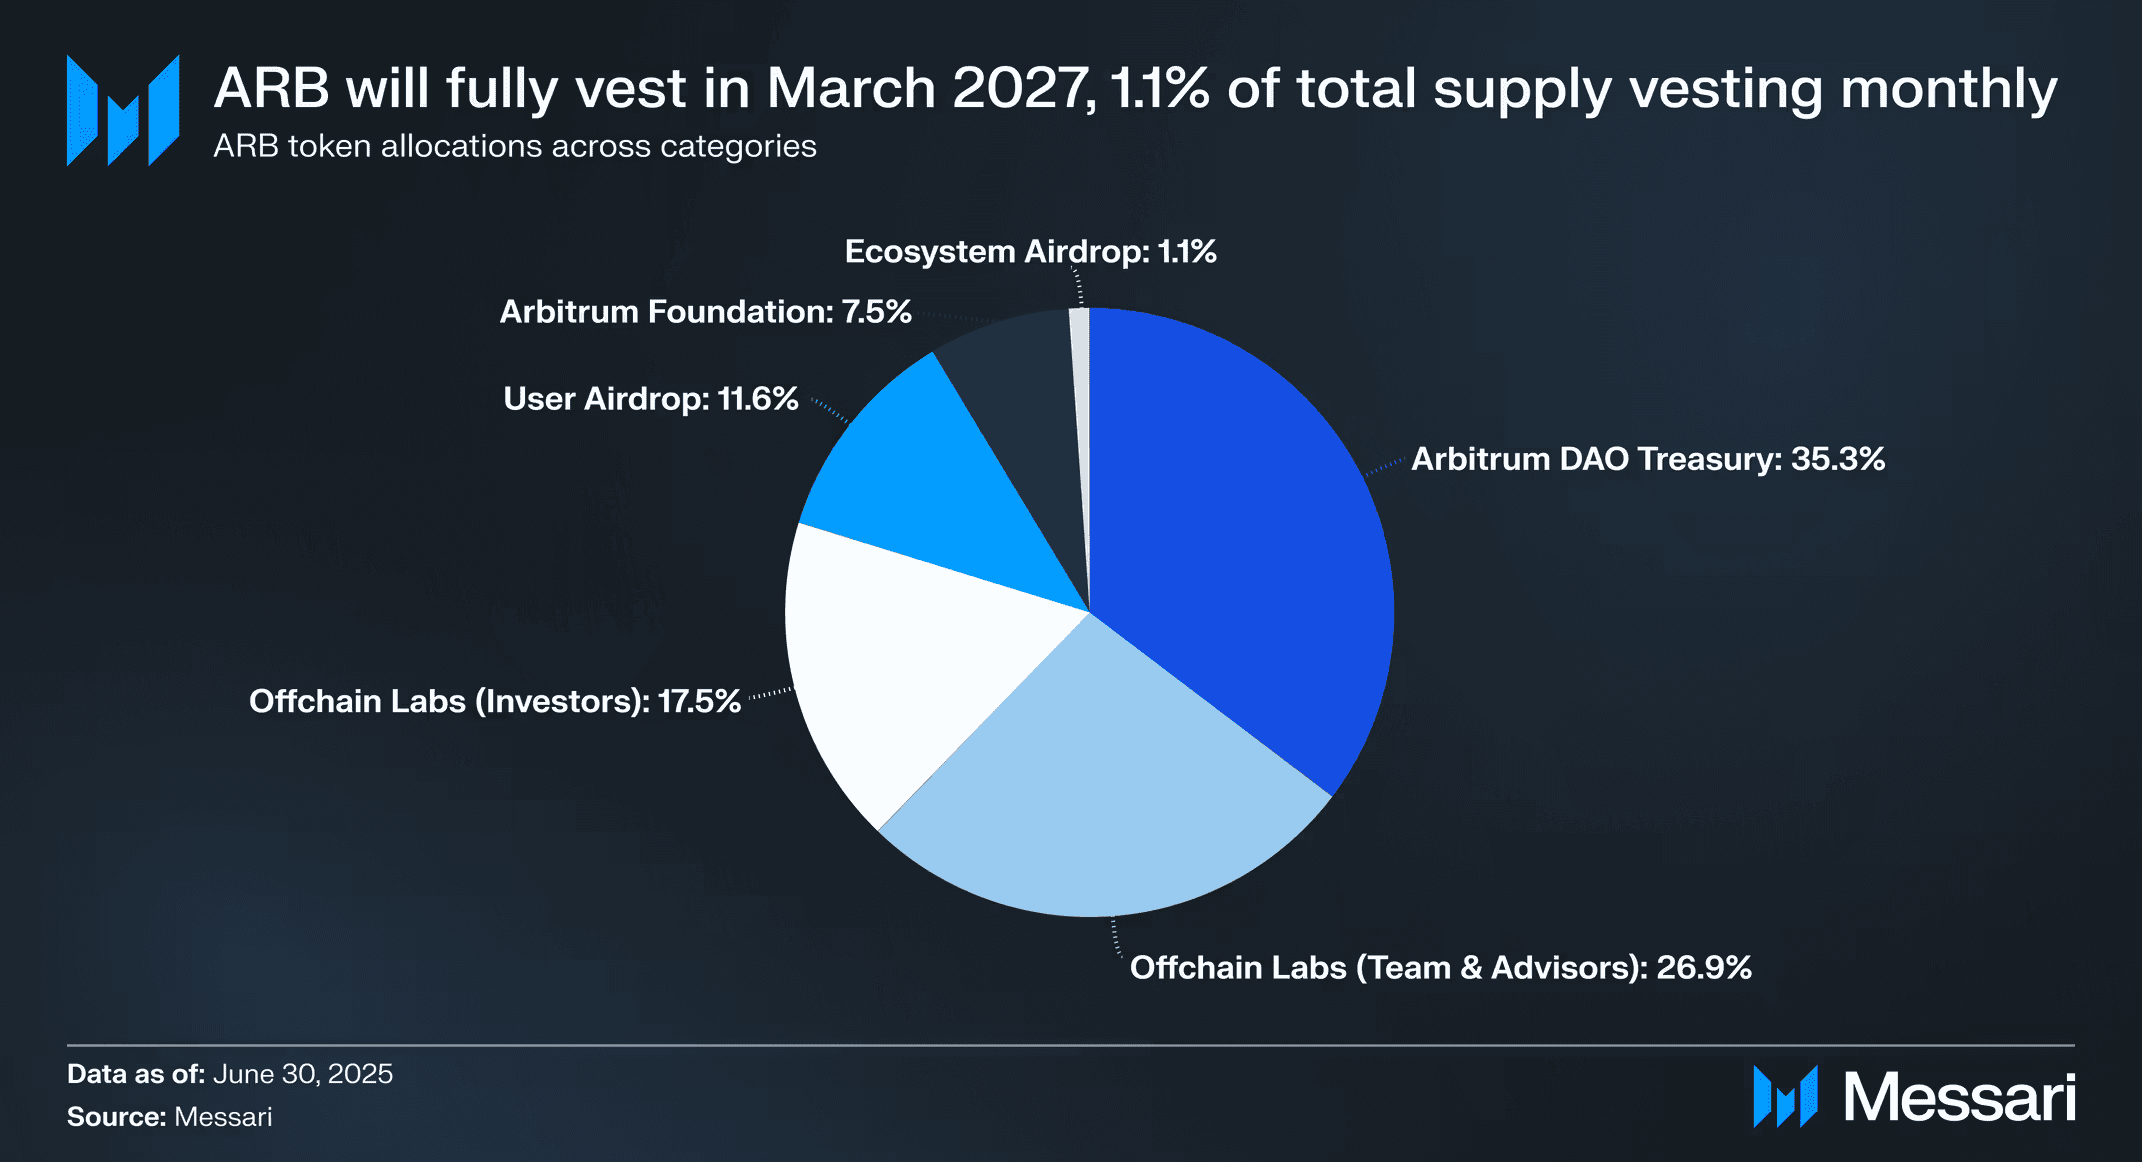
- Arbitrum DAO Treasury holds the largest share at 35.3%, giving the DAO strong control over ecosystem funding.
- Offchain Labs Team & Advisors control 26.9%, aligning long-term incentives with project development.
- Offchain Labs Investors retain 17.5%, reflecting early backing of Arbitrum’s growth.
- User Airdrop distributed 11.6%, ensuring broad community participation in governance.
- Arbitrum Foundation manages 7.5%, providing oversight and support for ecosystem initiatives.
- Ecosystem Airdrop accounts for just 1.1%, reserved for targeted adoption programs.
- ARB tokens will fully vest by March 2027, with 1.1% of the supply unlocking each month until that date.
Daily Transactions and Throughput
- 2.16 billion total transactions as of September 2025.
- Daily active addresses up 37.7 % MoM in June 2025.
- Snapshot (Aug 27, 2025): ~3.4 million transactions per day, and ~470,000 active addresses.
- Comparative: Base processes over 50 million monthly transactions, vs Arbitrum’s ~40 million.
- Token swap fees ~ $0.30 vs several dollars on Ethereum mainnet.
Unique Addresses and User Growth
- 1.45 million active wallets by September 2025.
- Daily active addresses rose 37.7 % MoM by June 2025, indicating strong user growth.
- 470,000 active addresses daily on August 27, 2025.
- Highest single-day new addresses recorded: 637,812 on May 18, 2024.
- Minimal address growth (1 new address) ever on June 30, 2021, a sign of early-stage maturity contrast.
Arbitrum Price Predictions
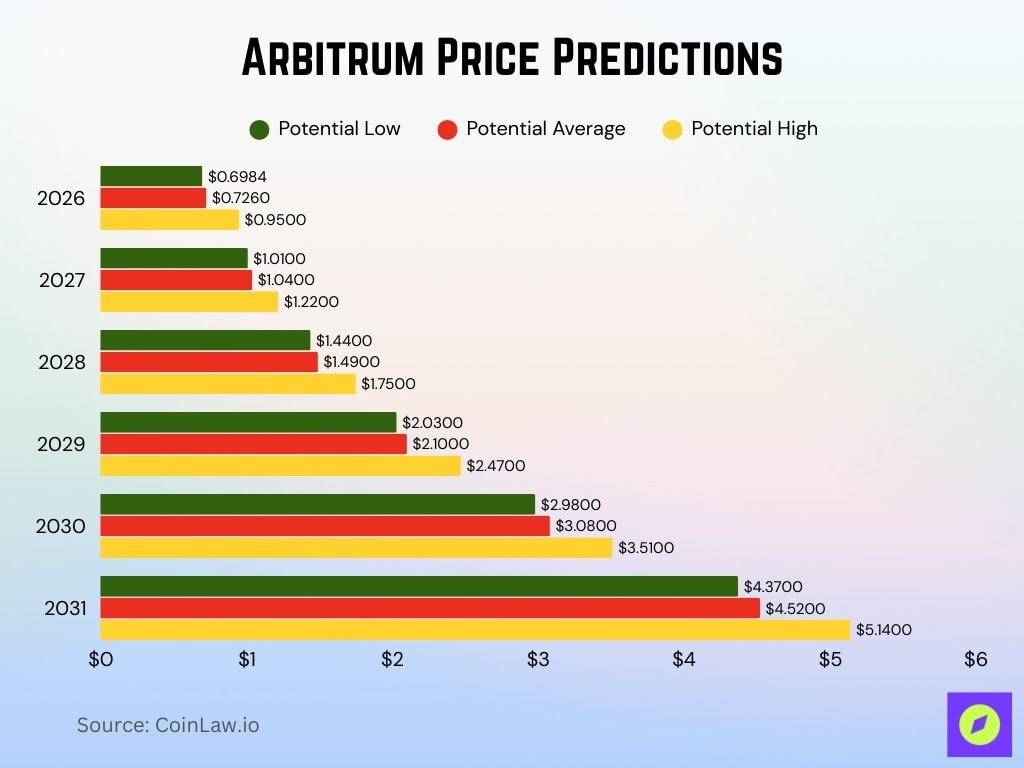
- In 2026, ARB is projected to trade between $0.6984 and $0.95, with an average price of $0.7260.
- By 2027, forecasts show growth to a range of $1.01–$1.22, averaging $1.04.
- In 2028, ARB could climb to a potential high of $1.75, with an average of $1.49.
- By 2029, estimates place ARB between $2.03 and $2.47, averaging around $2.10.
- Entering 2030, projections reach as high as $3.51, with an average of $3.08.
- By 2031, ARB may achieve a significant milestone, potentially hitting $5.14, with an average price of $4.52.
Gas Fees and Cost Efficiency
- An average token swap on Arbitrum costs around $0.30, compared to several dollars on Ethereum mainnet, a clear cost advantage for users.
- Ethereum’s gas per transaction at $3.78 on average in 2025, underscoring even greater savings on Arbitrum.
- Gas fees under the AnyTrust model (Arbitrum Nova) can be as low as pennies per transaction.
- A blog post on dynamic pricing (August 2025) outlines efforts to make gas charges cheaper and more predictable by aligning them with actual resource usage.
- Arbitrum collected about $10 million in gas fees in a recent period, indicating strong usage and fee generation potential.
- Dynamic pricing aims to improve cost transparency by adjusting fees in real time based on network demand.
Arbitrum Token (ARB) Supply and Circulation
- Circulating supply of ARB is approximately 5.29578 billion tokens.
- The total (or max) supply is 10 billion ARB tokens.
- A scheduled unlock on September 16, 2025, will release 92.65 million ARB (~2.04% of circulation).
- The Arbitrum multisig wallet held 11.3 million ARB at the end of June 2025.
- That same wallet transferred 6.3M ARB and received 1.2M USDC during June, with OPEX funds of 515k USDC remaining.
- The circulating supply translates to roughly 53% of the max supply.
- Buyback initiatives are in motion, 92.65 million ARB (~$30–$47 million) to be added to the treasury.
DeFi Activity on Arbitrum
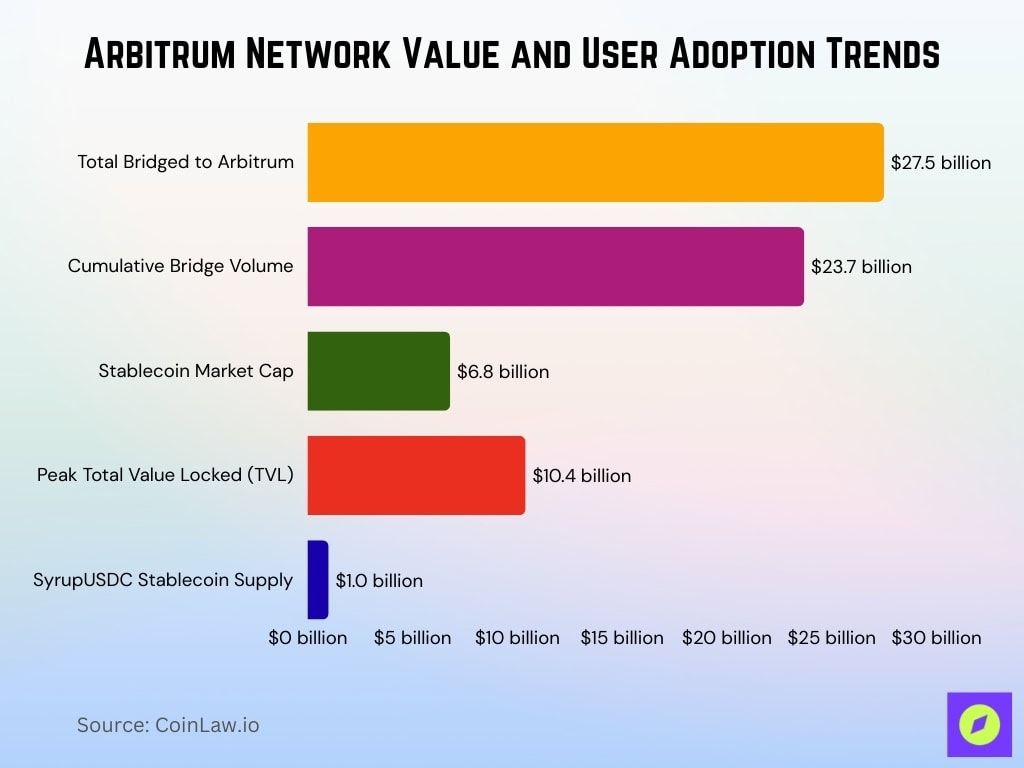
- Arbitrum saw more than $27.5 billion bridged, with 17.3 million transfers and 4 million users as of Q2 2025.
- Total cumulative bridge volume stands at approximately $23.7 billion.
- The stablecoin market cap on Arbitrum surpassed $6.8 billion.
- Arbitrum’s TVL once exceeded $10.4 billion, accounting for 8.4% of global DeFi liquidity in 2025.
- Maple Finance’s SyrupUSDC stablecoin exceeded $1 billion in supply after expanding to Arbitrum.
- Season One of the $40 million DRIP program (launched September 3, 2025) offers 24 million ARB tokens to incentivize borrowing and liquidity.
- ZyFAI, an automated DeFi strategy protocol, launched recently on Arbitrum, boosting ecosystem tools.
- By August 2025, DeFi TVL on Arbitrum neared $5.59 billion, and daily DeFi users rivaled Ethereum’s numbers.
Market Capitalization
- ARB’s market cap lies in the range of $2.6 to $2.73 billion (as of early September 2025).
- ARB ranks at #58 by market cap with around $2.717 billion.
- Fully diluted valuation (FDV) near $5.06 billion.
- As of March 2025, the combined market capitalization of tokens and protocols operating within the Arbitrum network, such as GMX, Radiant, and ARB, was estimated to contribute to a total ecosystem valuation of approximately $290 billion.
- August 2025 insights show average daily trading volume of ARB at $7.8 billion.
- ARB ranks around $0.50 USD per token in recent price data.
- ARB token is projected to trade within a speculative range of $0.295 to $0.820 in 2025, though such predictions are subject to high volatility and should not be viewed as guaranteed outcomes.
Stablecoin Usage and Market Cap
- Stablecoins settled roughly $5.7 trillion in value in 2024, about $475 billion a month.
- As of July 2025, Arbitrum’s on‑chain stablecoin market cap topped $6.8 billion.
- The overall stablecoin ecosystem reached approximately $251.7 billion in market cap by mid‑2025.
- USDC continues expanding strongly, backed by regulatory support.
- DAI remains the top decentralized stablecoin, with around $6.7 billion in circulation.
Trading Volume and Exchange Metrics
- ARB’s daily trading volume reached about $393 million.
- In August 2025, token trading volume soared to $7.8 billion.
- Arbitrum One DEXs handled around $398 million in 24h volume, accounting for 4% of blockchain DEX volume.
- H1 2025 crypto exchange volume hit $9.36 trillion, the strongest first half since 2021.
- Project-level ARB trading metrics continue to reflect high liquidity and investor activity.
- The ecosystem includes several high-volume DEXs and liquidity providers driving ARB traffic.
Smart Contracts and Verified Contracts
- Over 1.2 million smart contracts were deployed on Arbitrum in the first half of 2025.
- Despite limited public data on verification counts from Arbiscan, the deployment volume signals a substantial developer presence.
- Solidity remains the dominant language, and widespread EVM compatibility allows seamless porting from Ethereum.
- Chainlink integrations increased 2.4×, powering oracles in over 78 % of DeFi smart contracts.
- Growth in verified contract usage shows improved developer engagement.
- Automated micro-patterns are nearly universal on Arbitrum, with 99 % of contracts implementing at least one pattern and an average of 2.76 patterns per contract.
- The dominant “Storage Saver” pattern shows 84.62 % adoption.
- Migration from Ethereum poses specific security challenges, including address aliasing, timing logic errors, and failed permission checks.
Transaction Comparisons with Ethereum
- Arbitrum processed 1.2 million contract deployments in H1 2025.
- Ethereum mainnet saw over 1.8 million verified contracts by May 2025.
- Arbitrum has seen sharper growth in oracle-linked DeFi contracts.
- Micro-pattern adoption is consistent across Arbitrum and Ethereum.
- Migration to Arbitrum avoids many L1 gas spikes.
- Arbitrum’s combination of low fees and developer tooling accelerates its relative growth.
Network Security and Reliability Stats
- Access control flaws led to $953.2 million in global losses.
- Flawed business logic caused $63 million in losses.
- Migration-related risks include DOS vulnerabilities and stale off-chain data.
- The smart contract market is projected to grow from $2.63 billion in 2024 to $3.21 billion in 2025.
- Arbitrum’s EVM compatibility enhances the reusability of audit tools and security protocols.
Ecosystem Development and Partnerships
- The announcement of PayPal USD (PYUSD) integration on Arbitrum in July 2025 coincided with a 10% price increase in ARB, though other market factors may also have contributed.
- U.S. Department of Commerce anchored GDP data on Arbitrum One.
- The Graph’s Token API and subgraph tooling integrate Arbitrum into decentralized data layers.
- By July 2025, 482 million ARB (~13 % of its treasury) was disbursed across programs.
- Arbitrum hosts a rich developer ecosystem supported through grants and L3 frameworks like Orbit.
Conclusion
Arbitrum continues to stand out, thanks to its low-cost, high-throughput infrastructure paired with aggressive ecosystem investment and institutional use cases. It’s home to over 1.2 million smart contract deployments, hosts leading DeFi and derivatives protocols, and benefits from integrations like PayPal USD and government data anchoring. While security risks persist, especially in migration and logic design, solid developer tooling and active treasury allocations help strengthen ecosystem resilience. For readers eager to dig deeper into any metric or trend, the data-rich sections above lay the foundation for meaningful insight.


