Student loans have become a defining financial issue for millions of Americans. Whether it’s the dream of a better life through education or the burden of debt that follows, student loans impact every corner of society. The rising cost of education and the growing debt load make this an issue that demands attention. Understanding the statistics behind student loans provides insight into the broader financial struggles faced by current and former students.
Editor’s Choice
- 45.2 million Americans currently have federal student loan debt, reflecting persistent reliance on education borrowing amid shifting repayment and forgiveness policies.
- Total U.S. student loan debt stands at $1.81 trillion, keeping it the second-largest consumer debt category after mortgages.
- The average federal student loan balance per borrower is about $37,056, underscoring how rising education costs continue to outpace repayment.
- Roughly 25% of federal student loan borrowers are in default or serious distress, with nearly 10 million behind on their loans.
- About 10.16% of student loans are at least 90 days delinquent, highlighting growing repayment strain as protections phase out.
- Borrowers aged 50–61 now carry the highest average balance at about $48,203, showing the burden increasingly extends well into midlife.
- Federal loans still account for the overwhelming majority of student debt, with roughly $1.67 trillion+ of the total owed to the federal government.
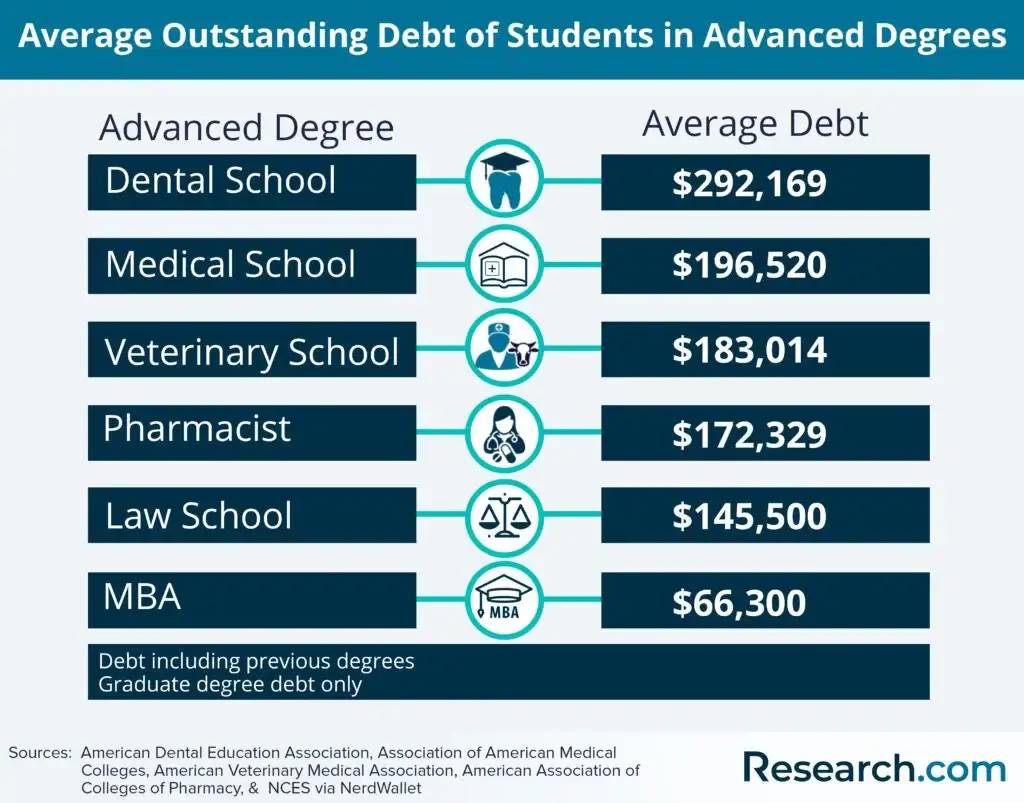
Average Student Loan Debt by Advanced Degree
- Dental school graduates carry the highest debt, averaging $292,169, reflecting long program lengths and high tuition costs.
- Medical school debt averages $196,520, placing physicians among the most heavily indebted graduate professionals.
- Veterinary school graduates owe about $183,014, often facing high debt relative to starting salaries.
- Pharmacy graduates report an average debt of $172,329, driven by extended education and clinical training requirements.
- Law school graduates hold $145,500 in average debt, with outcomes varying widely by institution and career path.
- MBA graduates have significantly lower debt, averaging $66,300, as many programs are shorter and employer-funded.
Student Loan Debt Statistics
- Total U.S. student loan debt has risen to $1.81 trillion, more than doubling from under $800 billion in the late 2000s and reflecting explosive long-term growth in borrowing.
- Graduates of public four-year institutions now leave school with an average student loan balance of about $35,530, up from roughly the mid-$20,000s a decade ago.
- Borrowers who attended private nonprofit colleges graduate with an average debt of around $39,510, several thousand dollars higher than their public school peers.
- Roughly 24.2 million borrowers are actively making student loan payments, while about 18.7 million are in deferment, forbearance, or other non-paying statuses.
- About 50% of recent bachelor’s degree recipients from public and private nonprofit four-year colleges graduate with student loans, carrying an average balance of $29,300.
- Graduate borrowers hold a disproportionate share of outstanding student debt, with about 46% of total education debt owed by the roughly 30% of students who pursue graduate study.
- The typical monthly student loan payment clusters around $398–$455, corresponding to average debts between about $35,000 and $40,000 on standard 10-year repayment plans.
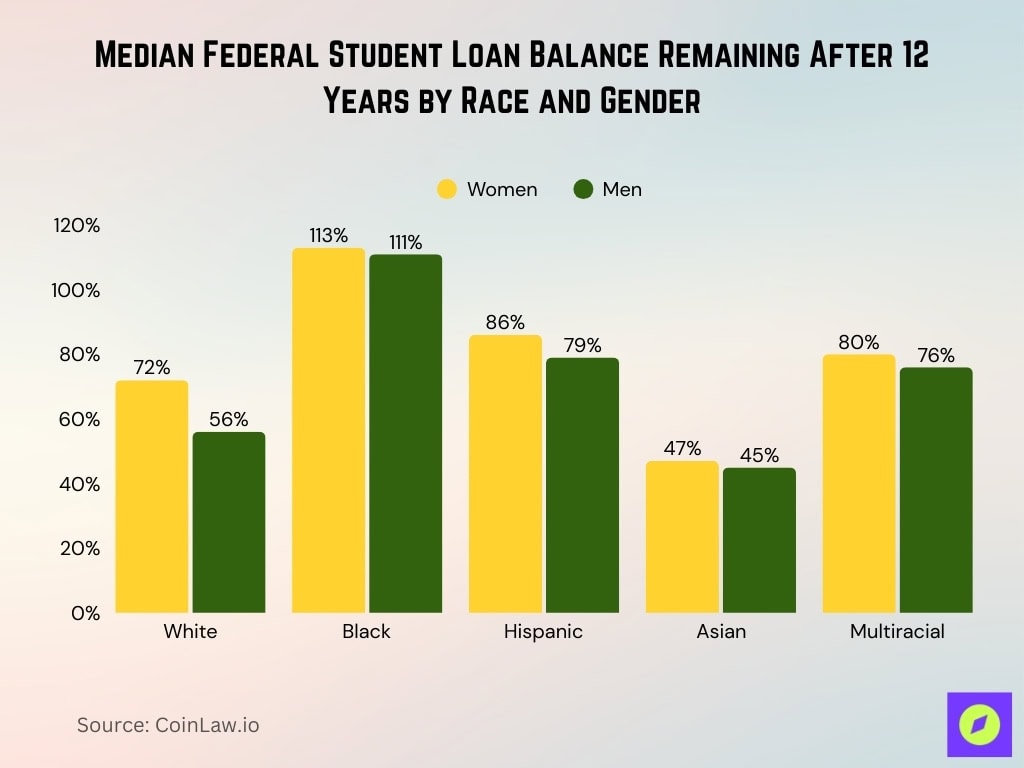
Median Federal Loan Balance Remaining After 12 Years
- White women now owe about 72% of their original federal student loan balance 12 years after starting college, meaning they have repaid only around 28%.
- White men owe roughly 56% of their balance 12 years out, reflecting faster repayment compared with most other racial and gender groups.
- Black women owe about 113% of their initial balance after 12 years, indicating their debt has grown rather than shrunk over time.
- Black men owe approximately 111% of what they originally borrowed 12 years later, showing similarly severe persistence and growth of loan balances.
- Hispanic women still carry roughly 86% of their original student loan balance after 12 years in repayment.
- Hispanic men owe close to 79% of their starting balance after 12 years, indicating slower payoff than their White and Asian peers.
- Asian women have about 47% of their federal loan balance remaining after 12 years, the lowest share among women.
- Asian men retain roughly 45% of their balance after 12 years, the lowest remaining proportion across all race-gender groups.
- Multiracial women owe around 80% of their original balance 12 years after entering repayment.
- Multiracial men have about 76% of their initial federal loan balance still outstanding after 12 years.
Debt Distribution by Demographics
- Women hold about 63.6% of all U.S. student loan debt, owing roughly $833 billion compared with $477 billion held by men.
- Black college graduates owe an average of about $25,000 more in student loan debt than white graduates four years after earning a bachelor’s degree.
- Hispanic borrowers face default rates of around 5.7% within four years of graduation, roughly double the 2.4% rate among white borrowers in comparable cohorts.
- First-generation students are about 1.3–1.5 times more likely to borrow federal loans than students whose parents have college degrees, increasing their long-term debt risk.
- LGBTQ borrowers carry on average about $16,000 more in student loan debt than non-LGBTQ borrowers, reflecting compounding financial and social barriers.
- Because of the gender pay gap, women take roughly 2 years longer than men on average to fully pay off their student loans.
- Around 90% of LGBTQ borrowers aged 18–40 have federal student loans, and about 16% owe $50,000 or more in student debt.
- Black women graduate with about $30,400 in student loan debt on average, compared with roughly $22,000 for white women and $19,500 for white men.
Student Loan Debt Inflation
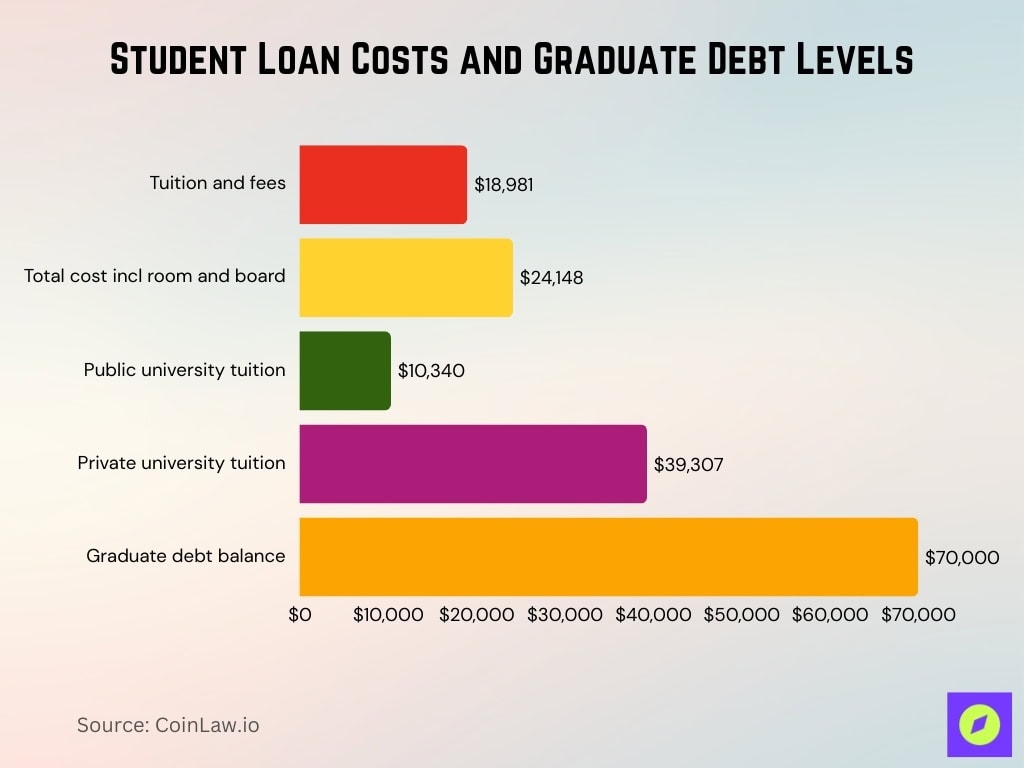
- The average annual cost of tuition and fees at four-year colleges has risen 93.2% since 2005-06 (and 17.4% after inflation), with 2025-26 costs averaging $18,981 for tuition and fees alone.
- Including room and board, the average total annual cost of attendance now reaches about $24,148, with public universities averaging $10,340 in tuition versus $39,307 at private institutions.
- Graduate study debt now represents 89.6% of the average education debt among indebted graduate borrowers, with typical balances exceeding $70,000 for many advanced degree holders.
- Tuition at four-year institutions has increased 41.7% faster than overall inflation in the 21st century, with an average annual tuition inflation rate of 3.91% versus 2.56% general inflation.
- Recent years show public four-year tuition rising around 2.24% year over year from 2024-25 to 2025-26, continuing a multi-decade upward trajectory in college pricing.
Federal and Private Student Loan Comparison
- Federal loans account for about 92.0% of total student loan debt (around $1.668 trillion), while private loans make up about 8.0% (roughly $144.9 billion) of the $1.81 trillion total as of Q2 2025.
- New federal Direct undergraduate loans carry a fixed interest rate of 6.39%, compared with typical private loan rates ranging roughly from 4%–16% depending on credit.
- Americans owe about $1.81 trillion in student loans in total, including roughly $144.9 billion in private student loan balances.
- Federal IDR plans generally cap payments between 5%–20% of discretionary income, whereas most private student loans lack true income-driven options.
- Roughly 45.2 million borrowers hold federal student loan debt, compared with an estimated 5–6 million with outstanding private student loans.
- Around 32% of federal borrowers owe less than $10,000, while about 21% owe between $10,000 and $20,000, underscoring how balances cluster at lower tiers.
- Delinquency affects about 11.3% of federal loan dollars versus just 1.61% of private loan dollars, reflecting different underwriting and repayment structures.
Student Loan Forgiveness Statistics
- About 1.07 million borrowers have now received PSLF relief, discharging roughly $78–93 billion in federal student loan debt.
- Across PSLF, TEPSLF, and the temporary waiver, roughly 615,000 borrowers have had about $42 billion in loans forgiven, with an average discharge of $68,547.
- Since 2021, federal actions (PSLF fixes, IDR adjustments, Borrower Defense, disability discharge, and other targeted relief) have approved about $188.8 billion in forgiveness for 5.3 million borrowers.
- Borrower Defense to Repayment and related fraud-based discharges now total tens of billions in cancellations, covering more than 200,000 defrauded students in major settlements.
- Roughly 34% of federal borrowers are estimated to be on a path to cancellation through IDR, PSLF, disability, closed-school, or other statutory forgiveness routes.
- SAVE and IDR account adjustment initiatives together have delivered over $50 billion in relief to more than 2 million borrowers enrolled in income-driven plans.
- PSLF approval metrics show sharply higher success rates post-reforms, with recent cohorts seeing approval rates roughly 5–6 times higher than the sub-3% levels recorded before 2021.
Breakdown of Student Loan Borrowers by Degree Level
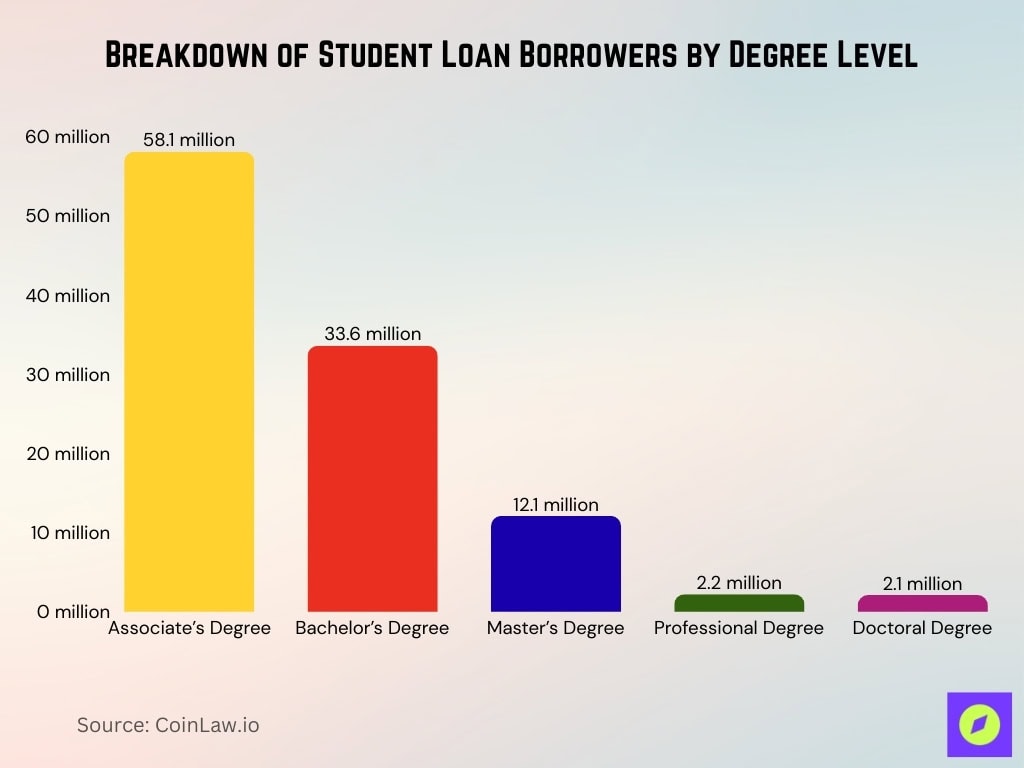
- Associate’s degree borrowers dominate the student loan system, with approximately 58.1 million borrowers, accounting for the largest share of all student loan holders.
- Bachelor’s degree holders represent a substantial portion, totalling 33.6 million borrowers, highlighting the widespread reliance on loans for undergraduate education.
- Master’s degree borrowers number about 12.1 million, reflecting the growing participation in graduate-level education and advanced credentials.
- Professional degree borrowers remain a small segment, with roughly 2.2 million borrowers, despite typically carrying higher individual debt balances.
- Doctoral degree borrowers account for around 2.1 million, making them the smallest group by borrower count, even with long academic pathways.
Student Loan Repayment Statistics
- About 24.2 million borrowers are actively making payments, while roughly 18.7 million are not, due to deferment, forbearance, or temporary relief programs.
- The typical repayment horizon is about 20 years, with extended and consolidated plans stretching payoff timelines to as long as 30 years for higher-balance borrowers.
- Roughly 36% of federal borrowers are enrolled in IDR plans, with payments tied to income and family size and expanding uptake under the SAVE Plan.
- An estimated 61% of borrowers who default owe less than $20,000, underscoring that smaller balances can still be unmanageable for financially vulnerable households.
- More than 10.5 million borrowers used deferment or forbearance during and after the COVID-19 emergency, helping drive delinquency rates temporarily below 1%.
- Around 26.5% of borrowers have changed repayment plans at least once, often shifting into IDR, graduated, or consolidation plans to reduce monthly payments.
- Interest capitalization can increase a borrower’s total outstanding balance by roughly 11%–26% over time, especially when transitioning between deferment, forbearance, and repayment.
Recent Developments
- Under SAVE, payments on undergraduate loans are capped at 5% of discretionary income (with income exempt up to 225% of the poverty line), giving $0 monthly payments to single borrowers earning up to about $32,800.
- Targeted federal relief actions since 2021 have approved about $188.8 billion in loan cancellation for roughly 5.3 million borrowers through PSLF fixes, IDR adjustments, and other programs.
- The revamped FAFSA process is projected to simplify aid applications for more than 17 million students annually and significantly expand eligibility for Pell Grants under the new formula.
- New projections suggest the national student loan default rate could climb toward 9%+ as the on‑ramp ends and millions fully re‑enter repayment amid higher interest costs.
- As 2025 closes, policy shifts around the SAVE Plan and IDR rules are expected to reshape repayment terms again in the coming year, altering options for tens of millions of federal borrowers.
Frequently Asked Questions (FAQs)
Approximately 42.5 million borrowers have federal student loan debt.
The average federal student loan balance is about $39,075 per borrower.
Federal loans make up roughly 91.6 % of all student loan debt, with private loans around 8.4 %.
Nearly 6 million Americans (≈16 %) were 60+ days late on student loan payments in 2025.
Conclusion
The student loan crisis continues to shape the financial futures of millions of Americans. With 1 in 8 Americans carrying some form of student debt, the effects ripple across housing markets, retirement plans, and overall economic stability. Recent policy changes and forgiveness programs offer some hope, but the underlying challenges of escalating tuition costs and long-term repayment struggles remain. Understanding the depth and breadth of this issue is critical as policymakers and borrowers alike navigate the future of student loans.


