Blockchain consensus models shape how cryptocurrencies validate transactions. Proof of Stake (PoS) has surged ahead due to its energy efficiency, while Proof of Work (PoW) remains trusted for its long-proven security. For instance, enterprise applications favor PoS for lower costs, while Bitcoin miners still rely on PoW for network integrity. Dive deeper into the numbers to see how these models stack up in energy use, speed, and scalability.
Editor’s Choice
- PoS reduces energy use by over 99% compared to PoW, as evidenced by Ethereum’s shift at The Merge.
- Bitcoin mining consumes about 169.7 TWh annually, surpassing the energy use of Poland.
- Ethereum PoW used ~84,000 Wh/transaction, while PoS used under 35 Wh/transaction.
- PoW energy per Bitcoin transaction equals 707.6 kWh, while PoS networks use a fraction.
- PoS block time steadied at ~12 seconds post-Merge, with transaction volumes up 7%.
- PoW still offers stronger formal security guarantees, though PoS approaches parity via hybrid methods.
- Ethereum energy cut by ~99.95% post-Merge, reducing carbon impact massively.
Recent Developments
- In 2025, PoS dominates the crypto landscape, favored for its scalability and inclusivity.
- Ethereum’s Merge (2022) remains a landmark, cutting energy use by over 99% and validating PoS viability.
- As of mid-2025, Dogecoin has expressed interest in exploring a move to Proof of Stake, but no completed transition has been confirmed. Its consensus mechanism remains based on Proof of Work, often merged-mined with Litecoin.
- Industry reports highlight urgent environmental pressure to shift from PoW toward PoS for climate compliance.
- Hybrid consensus research emphasizes combining PoW and PoS to enhance security and operational flexibility.
Proof of Work vs. Proof of Stake
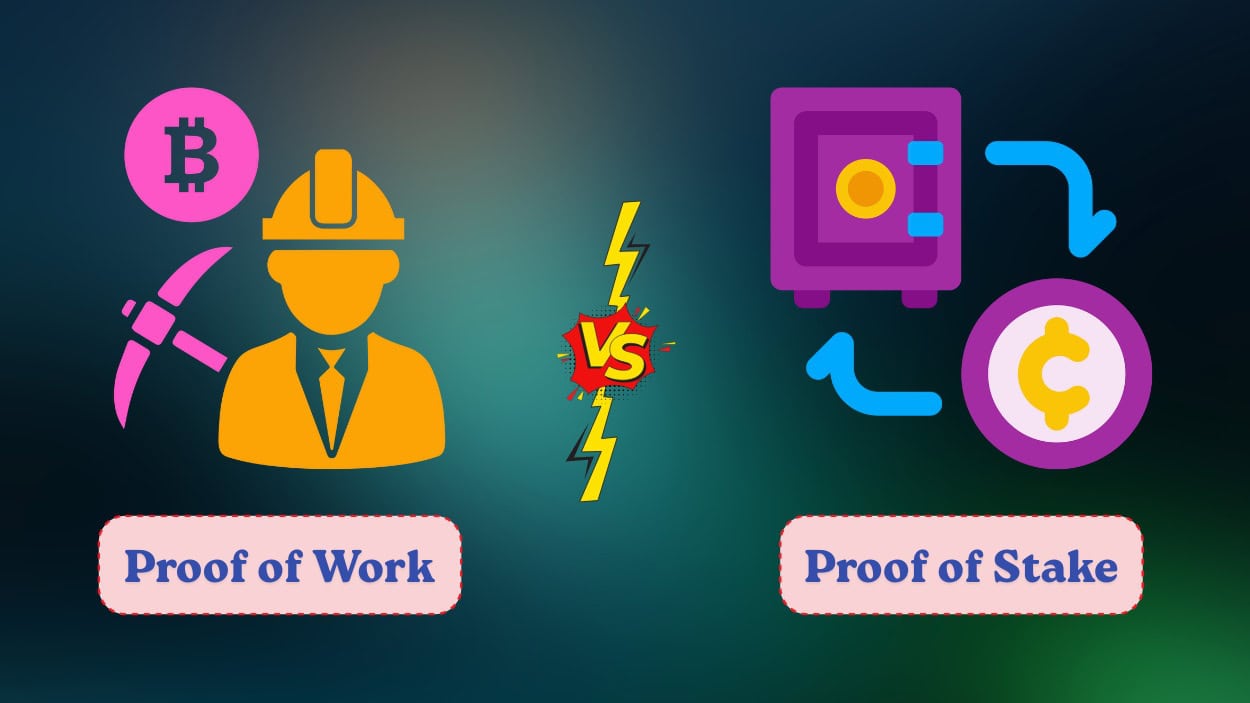
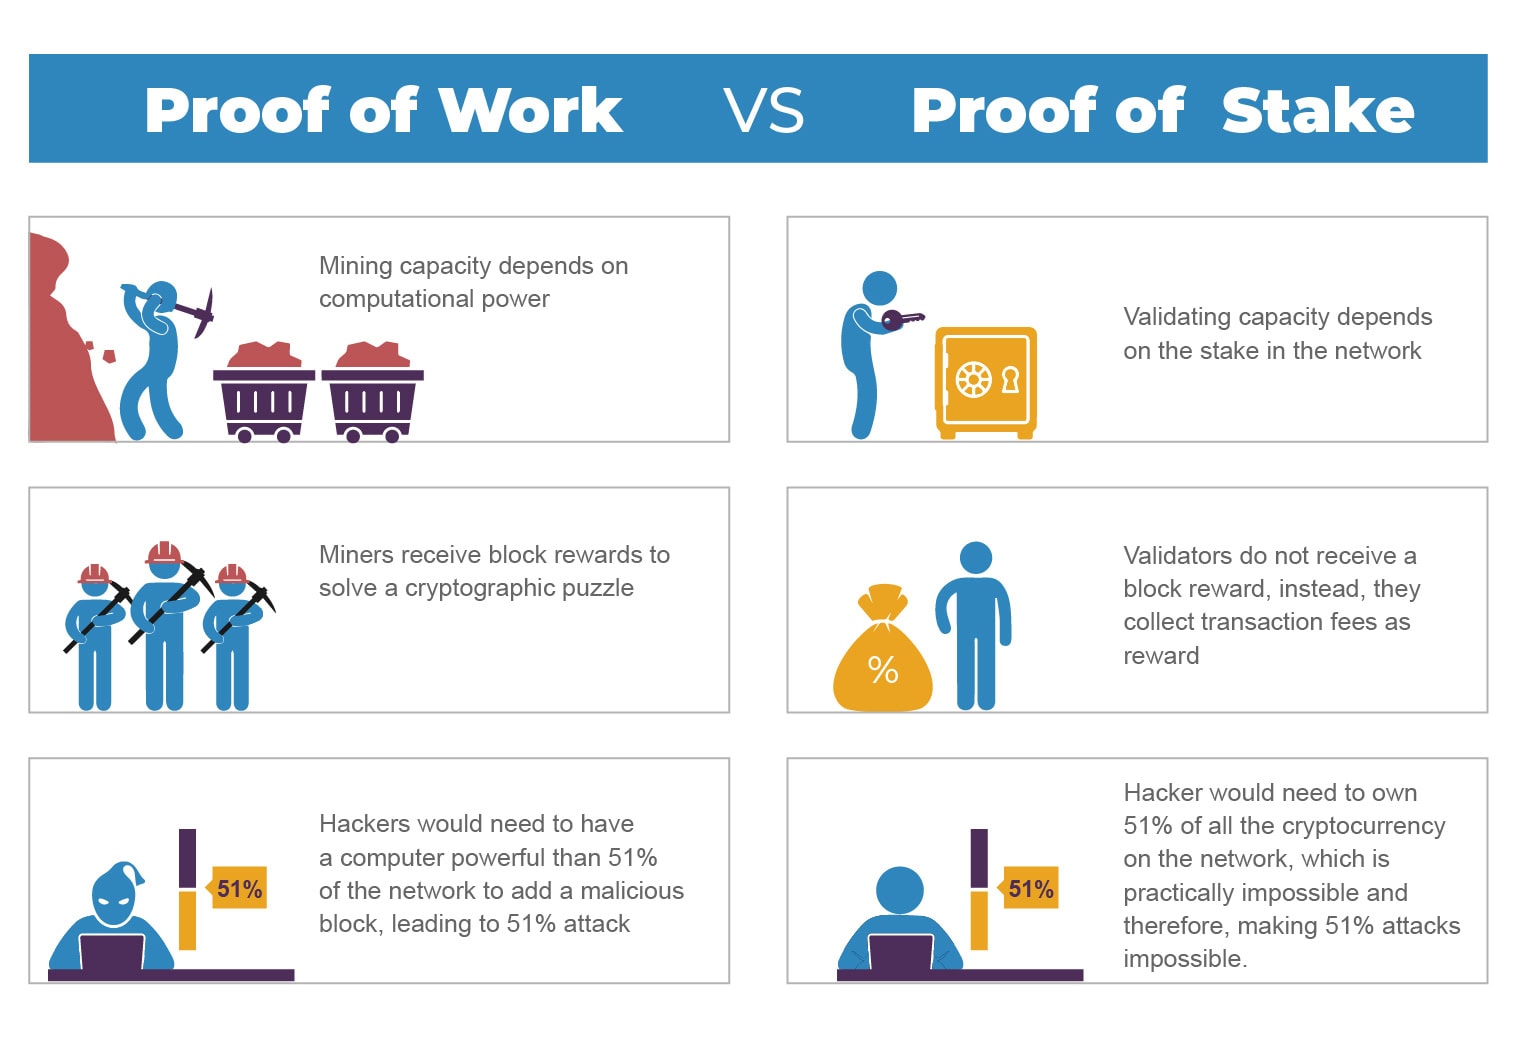
- Proof of Work relies on computational power to determine mining capacity, while Proof of Stake depends on the amount of tokens staked in the network.
- In PoW, miners earn block rewards for solving cryptographic puzzles, whereas in PoS, validators collect transaction fees instead of block rewards.
- A 51% attack in PoW would require control of more than 51% of total computing power, while in PoS, it would require owning 51% of all cryptocurrency on the network, making attacks nearly impossible.
Overview of Proof of Work
- PoW relies on miners competing to solve complex puzzles and requires massive computational power.
- Bitcoin remains the most prominent PoW network, using as much energy as small countries.
- PoW systems like Bitcoin consume approximately 169.7 TWh/year, with a heavy carbon footprint per transaction.
- Energy per transaction in Bitcoin approximates 707.6 kWh, far exceeding conventional systems.
- PoW is tested and trusted, and formally offers strong security, especially through the longest‑chain rule.
- However, PoW contributes to e‑waste, with mining hardware often discarded quickly.
Overview of Proof of Stake
- PoS selects validators based on their staked coins instead of computing power, cutting energy needs drastically.
- Ethereum’s switch to PoS made its network ~2000× more energy-efficient, reducing energy usage by ~99.95%.
- PoS networks use minimal energy per transaction; Ethereum’s PoS spends just 35 Wh/transaction versus PoW’s 84 kWh.
- Hardware requirements for PoS are low, often no more than a standard laptop.
- PoS is increasingly popular in newer blockchains like Cardano, Solana, Polkadot, and Ethereum 2.0.
- Energy savings support enterprise adoption focused on cost efficiency and environmental responsibility.
Proof of Work vs. Proof of Stake: Pros and Cons
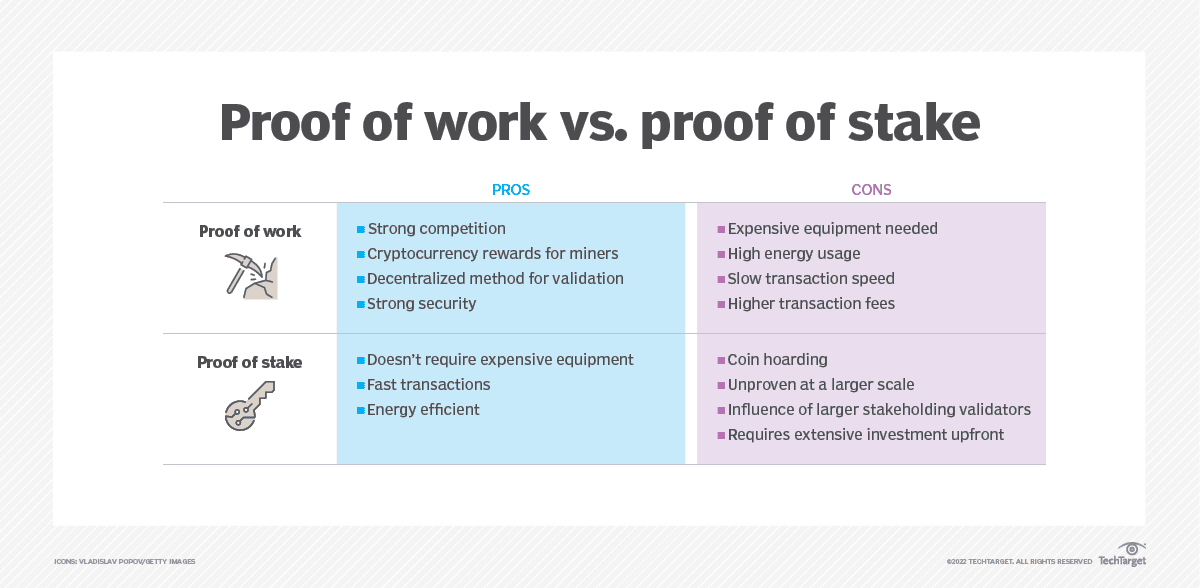
- Proof of Work Pros include strong competition, cryptocurrency rewards, a decentralized validation method, and strong security.
- Proof of Work Cons are expensive equipment, high energy usage, slow transaction speed, and higher transaction fees.
- Proof of Stake Pros highlight no need for costly equipment, fast transactions, and being energy efficient.
- Proof of Stake Cons involve risks of coin hoarding, being unproven at large scale, the influence of large validators, and the need for significant upfront investment.
Energy Consumption Comparison
- Switching to PoS can save at least 99.85% of energy versus PoW.
- Ethereum’s PoW consumed ~84,000 Wh per transaction, PoS now uses just 35 Wh, a >99.9% drop.
- PoW overall energy use, Bitcoin ~169.7 TWh/year.
- PoS uses a fraction of energy, comparable to a small housing estate annually, not a country.
- Ethereum’s energy fell by 99.95% after the Merge, drastically lowering its environmental impact.
- General consensus, PoS employs negligible energy compared to PoW across systems.
- EU regulators and industry groups cite PoW energy use as a driver to favor PoS adoption for sustainability.
Transaction Speed and Scalability Statistics
- Bitcoin processes roughly 5 transactions per second (TPS), each costing ~830 kWh in energy.
- Ethereum PoS after Merge delivers a consistent 12-second block time, boosting TX per day by ~7%.
- Solana, using PoS with Proof‑of‑History, leads in TPS, averaging around 1,133 TPS in real-world usage.
- Cosmos achieves high throughput via PoS, supporting rapid validator selection and faster throughput.
- PoS validators operate on lightweight systems; no need for heavy mining farms.
- PoS supports greater scalability, fewer resources limit performance less as networks grow.
Ethereum Staking Landscape
- 13.4M ETH are currently staked in Ethereum’s Proof-of-Stake system.
- Lido Finance leads with 31%, making it the largest staking provider.
- Unlabelled stakers account for 23%, showing a significant share from unidentified participants.
- Coinbase contributes 15%, securing a strong position among centralized exchanges.
- Kraken holds 8.5% of the total staked ETH.
- Binance controls 6.75%, supported by its global exchange dominance.
- Staked.us represents 3.02%, a notable institutional player.
- Bitcoin Suisse has 2.15%, reflecting Swiss institutional participation.
- Stakefish accounts for 2.08% among the specialized staking providers.
- Rocket Pool holds 1.62%, offering decentralized staking alternatives.
- Other validators total 7.42%, reflecting the remaining fragmented landscape.

Security Metrics
- PoW has a decade‑long, battle‑tested security track record, underpinning Bitcoin’s $1 trillion+ value without major breaches.
- PoS deters attacks via financial penalties; validators who misbehave risk losing their staked assets, known as slashing.
- To compromise a PoW network, attackers must control 51% of the network’s hashrate, requiring immense hardware and energy.
- PoS requires control of 51% of the coin supply and validator nodes, making an attack expensive, though economically accessible.
- Experts generally agree that PoW remains the gold standard for trust and decentralization, even as PoS innovates in security.
- Formal comparisons show PoS security is improving and can approach PoW’s robustness when properly structured.
- Hybrid models that combine PoW and PoS attributes are emerging, aiming to blend security and efficiency.
Network Decentralization Statistics
- PoW promotes decentralization via distributed mining, though mining pools concentrate influence, especially in energy‑cheap regions.
- PoS systems risk centralization, as large coin holders gain more validator power, creating oligarchic tendencies.
- Initiatives in PoS aim for optimal decentralization by making staking accessible to broader participants, such as run‑your‑own‑node models.
- Cardano, a PoS chain, emphasizes decentralized validation through its Ouroboros protocol and educational decentralization initiatives.
- PoW’s hardware requirements form a democratizing barrier (expensive), yet decentralized access remains (with enough capital), PoS lowers entry cost but raises wealth‑based centralization risk.
- Many new blockchain projects adopt PoS, and decentralization remains a design focus, especially in validator protocols and staking thresholds.
- Hybrid consensus models explore combining PoW’s distributed validation and PoS’s financial stake to mitigate centralization risks.
Adoption and Market Share Statistics
- By mid‑2025, Ethereum (PoS) will boast a market cap of around $400 billion, leading the smart‑contract landscape.
- Cardano (PoS) holds about $22 billion market cap (June 2025), with strong adoption in emerging economies.
- Solana (PoS + PoH) markets around $80 billion, driven by NFTs, DeFi, and high TPS capabilities.
- BNB Chain (PoS‑based) maintains a market cap near $85 billion, anchored by Binance’s ecosystem.

- PoW systems like Bitcoin remain dominant in value storage, but the shift to PoS in new projects accelerates due to efficiency and scalability.
- Public interest and institutional flows increasingly favor PoS networks for ESG-aligned investments.
- Ecosystem tools (wallets, exchanges) increasingly support staking, reflecting growing PoS adoption infrastructure.
Validator and Miner Distribution
- In PoW, mining power concentrates in large pools, often across regions with low electricity costs.
- PoS spreads responsibility across individual validators, with lower hardware needs. Ethereum supports over 1 million active validators post‑Merge.
- PoW miners face high entry costs (ASICs, power), reducing participation to well‑funded entities; PoS lowers these barriers.
- PoS networks like Cardano and Solana attract global validator participation due to low system requirements and accessible staking.
- Ethereum’s staked collateral (~32 ETH per validator) ensures financial commitment, while remaining accessible through staking pools.
- PoW tends to concentrate in regions with subsidized energy, PoS allows geographically dispersed validators, supporting broader network distribution.
- Some newer networks implement delegated staking, enabling small holders to delegate to validators and participate indirectly.
Environmental Impact Statistics
- Ethereum’s Merge cut energy consumption by ~99.95%, drastically shrinking its carbon footprint.
- As of 2025, PoW blockchains consume energy amounts equivalent to whole countries, PoS networks use energy comparable to a housing estate or small town.
- While delegated Proof of Stake (DPoS) introduces additional coordination overhead compared to basic PoS, the energy use remains substantially lower than PoW. Some estimates suggest DPoS networks use hundreds of GWh annually, compared to PoW networks like Bitcoin, which exceed 97,000 GWh.
- PoS validators can operate on everyday devices like laptops with 8 GB RAM, underscoring minimal environmental cost.
- Industry regulators increasingly favor PoS for sustainability, aligned with ESG mandates and climate commitments.
- PoW raises sustainability concerns through e‑waste (discarded hardware) and carbon emissions, driving calls for greener alternatives.
- PoS continues growing due to its low environmental impact, easing industry and regulatory acceptance.
Efficiency and Cost Analysis
- PoS runs on low‑power devices, while PoW needs expensive, power‑hungry mining rigs. PoS wins efficiency hands down.
- PoS dramatically lowers transaction costs by avoiding energy-intensive mining, and users benefit from more predictable fees.
- PoW cost per transaction remains high (major energy and hardware input), PoS enjoys sustained low operational costs.
- Reduced hardware turnover in PoS also cuts costs related to e‑waste and equipment depreciation.
- PoS allows automated participation (staking), meaning users save on manual maintenance and energy costs.
- PoW suffers from rising mining difficulty over time, increasing capital outlay for miners; PoS avoids this arms race.
- Overall, PoS offers superior cost‑efficiency, especially for mass adoption and enterprise deployment.
Attack and Failure Rates
- PoW’s long tenure has seen few successful attacks on major networks, no major PoW breach in over a decade (e.g., Bitcoin).
- PoS vulnerabilities (slashing, stake centralization) concern developers, though robust protocols mitigate these risks effectively.
- PoS designers build in penalties for validator misbehavior, increasing network reliability over time.
- Hybrid consensus experiments aim to reduce single‑point failures by combining PoW’s resilience with PoS’s efficiency.
- Ethereum’s PoS transition has shown no major security failings post‑Merge, reinforcing confidence in the model.
- Smaller PoS networks remain under observation, but continued testing and smart design reduce failure risk.
- Academics actively compare failure vectors in both methods, helping networks harden against real‑world attacks.
Rewards Distribution Statistics
- In Q2 2025, Ethereum validators earned an average risk-adjusted reward rate of ~3.15% APY, with no slashing events reported among Figment’s nodes.
- Approximately 29% of Ethereum’s total supply is staked, indicating strong validator participation.
- Consensus layer rewards account for ~89% of staking payouts, while execution layer (MEV-related) comprises the remaining ~11%.
- On average, a validator earned 0.00206 ETH per day in consensus layer rewards.
- Liquid staking platforms like Lido hold over 29% of the total Ethereum staking market share, with a total value locked (TVL) exceeding $25 billion.
- Obol Network’s Distributed Validator Technology (DVT) now secures over $975 million worth of ETH, with more than 300 node operators involved.
- The rise of liquid restaking platforms, such as Ether.fi built on EigenLayer, supports capital efficiency while retaining liquidity.
Consensus Participation Rates
- Ethereum validators in Q2 2025 achieved a stellar participation rate of 99.9%, slightly above the network average of 99.7%.
- High participation reflects strong network reliability and validator uptime.
- DVT systems introduce redundancy by distributing validator keys across multiple nodes, bolstering participation resilience.
- Liquid staking and diversified validator setups help maintain a smooth consensus even during node failures or maintenance.
- Improved protocols and tooling (e.g., Pectra upgrades like EIP-7514, EIP-4844) enhance validator performance and efficiency.
- Engagement via staking pools and liquid systems spreads responsibility and maintains high overall participation.
- Broader staking adoption translates into more collective stakeholders actively securing the network, improving robustness.
Blockchain Network Statistics
- The global blockchain market is on track for explosive growth, from $6 billion in 2021 to an estimated over $1 trillion by 2030, at a CAGR well above 50%.
- As of 2025, more than 560 million people (about 4% of the global population) use blockchain.
- Blockchain wallet ownership has risen 700% since 2016, now exceeding 85 million users globally.
- Nearly 90% of businesses surveyed report deploying blockchain in some form.
- The number of active cryptocurrencies stands at over 10,000, with a projected blockchain market value of $32.69 billion by around 2027.
- Blockchain infrastructure and applications continue to diversify, encompassing DeFi, enterprise systems, and central bank digital currency (CBDC) use cases.
- Growth in both network reach and ecosystem depth underlines increasing relevance across sectors.
Regulatory and Compliance Statistics
- U.S. regulators, such as the SEC, have raised concerns that staking rewards may constitute securities, affecting networks like Ethereum and Cardano.
- In 2024, Ethereum market funds were cleared by regulators only if they did not stake, reflecting compliance complexities.
- Staking levels vary; Ethereum’s staked share stands at 27% of circulating supply, whereas Cardano reaches 66%, and Solana 63%.
- Regulatory pressure around PoW energy consumption has influenced shifts toward PoS models in parts of the EU.
- Environmental policies and ESG frameworks increasingly favor PoS, with its 99% lower energy footprint compared to PoW.
- Legal clarity around staking remains fluid, and regulators continue to refine definitions and classifications of staking income.
- Overall, PoS models offer better regulatory alignment, particularly where environmental and financial oversight intersect.
Historical Performance Data
- PoW has proven resilient; Bitcoin’s ten-plus-year history remains unbreached.
- Ethereum’s 2022 Merge remains a pivotal milestone, cutting energy usage by ~99.95%.
- From 2022 to 2025, PoS adoption has surged, with major networks like Cardano and Solana building on staking models.
- Hybrid consensus initiatives increasingly prototype combining PoW security with PoS efficiency.
- Early PoS systems (e.g., Peercoin, Cardano) offered proof-of-concept, paving the way for full-scale Ethereum adoption.
- Historical metrics reinforce PoS’s upward trend in scalability, security, and acceptance.
- Experimental models such as SRSW and LSW have been proposed in academic research to improve fairness in PoS validator selection, with simulated improvements in fairness metrics ranging from 51% to 132%. These models, however, are not yet widely adopted or validated in production systems.
- Quantitative analyses reveal that Ethereum’s power concentration increased post-Merge, marking a centralization challenge within PoS systems.
Future Trends and Projections
- By 2030, blockchains could contribute $3.1 trillion in new business value, according to Gartner.
- Blockchain technology’s projected market value of over $1 trillion by 2030 suggests rapid global adoption.
- PoS models are expected to dominate consensus mechanisms, especially in enterprise, financial services, and smart contract platforms.
- Hybrid models blending PoW and PoS properties are poised to deliver balanced security and scalability.
- Enhanced decentralization via alternative validator weighting, like SRSW and LSW, will shape more equitable PoS systems.
- As staking infrastructure matures (liquid staking, DVT), capital efficiency and resilience will improve.
- Regulatory alignment, ESG considerations, and energy efficiency will reinforce PoS’s upward trajectory.
- Innovations like distributed validator clusters and smart staking protocols will define next-gen blockchain performance.
Conclusion
The shift from Proof of Work to Proof of Stake is clear. PoS now ensures high validator participation (99.9%), widespread staking adoption (~29% of ETH supply), and robust reward structures (~3.15% APY). Meanwhile, PoW retains its legacy of security but lags in sustainability and efficiency.
Blockchain continues expanding, with over 560 million users, explosive market growth, and enterprise deployment, signaling its transformation from niche to mainstream. Key challenges like decentralization, regulatory clarity, and consensus equity persist, but emerging tools like DVT, SRSW/LSW models, and hybrid consensus offer promising solutions.
Heading into the future, PoS appears poised to lead, powered by energy-efficient systems, eco-conscious regulation, and innovation in validator infrastructure. The contrast between PoW and PoS isn’t just theoretical; it’s reshaping the blockchain landscape in real time.


