Ethereum once ranked among the energy-intensive blockchains, but after switching to proof-of-stake, its consumption has dropped dramatically. In today’s climate of tighter ESG standards and regulatory scrutiny, even small changes in blockchain energy use draw scrutiny. For example, firms assessing crypto portfolios now factor in carbon impact; likewise, renewable energy developers see potential demand from validator operations. In this article, you’ll find up-to-date, carefully sourced statistics that reveal how Ethereum’s energy profile has shifted, and what that means going forward.
Editor’s Choice
- After the Merge, Ethereum’s annual energy consumption dropped by over 99.95% versus its proof-of-work days.
- Under proof-of-stake, Ethereum consumes about 0.0026 TWh/year (2,601 MWh) as of the latest estimates.
- That energy footprint corresponds to roughly 870 tonnes CO₂e annually under standard carbon factors.
- The per-transaction energy use has fallen to around 0.03 kWh (30 Wh) in recent studies.
- The transition (Merge) is often cited as improving energy efficiency by a factor of ~2,000× (i.e., ~99.95% reduction).
- Before the Merge, Ethereum’s energy draw was comparable to a small country (tens of TWh annually).
- The environmental impact cut includes a drop in annual CO₂ emissions from millions of tons to hundreds of tons, a reduction by ~99.99% in some models.
Recent Developments
- In September 2022, the long-anticipated Merge shifted Ethereum from PoW to PoS consensus.
- Post-Merge studies estimate an energy reduction of 99.98% in many event-window analyses.
- Analysts confirm PoS requires vastly less computing power, needing only megawatts vs gigawatts in PoW mode.
- Migration of former Ethereum mining hardware pushed parts of hashpower into other PoW chains, ~41% of Ethereum’s former hashrate switched in some studies.
- Block times have stabilized to ~12 seconds, and transactions per day are up ~7% compared to pre-Merge data.
- Validator participation increased significantly post-Merge, with some studies indicating a 30–50× rise in the number of validating entities, though some operators may run multiple nodes under one identity, potentially inflating raw counts.
- Some critics flag reduced “randomness” in validator selection, raising discussions about decentralization trade-offs.
Ethereum vs VISA Energy Consumption
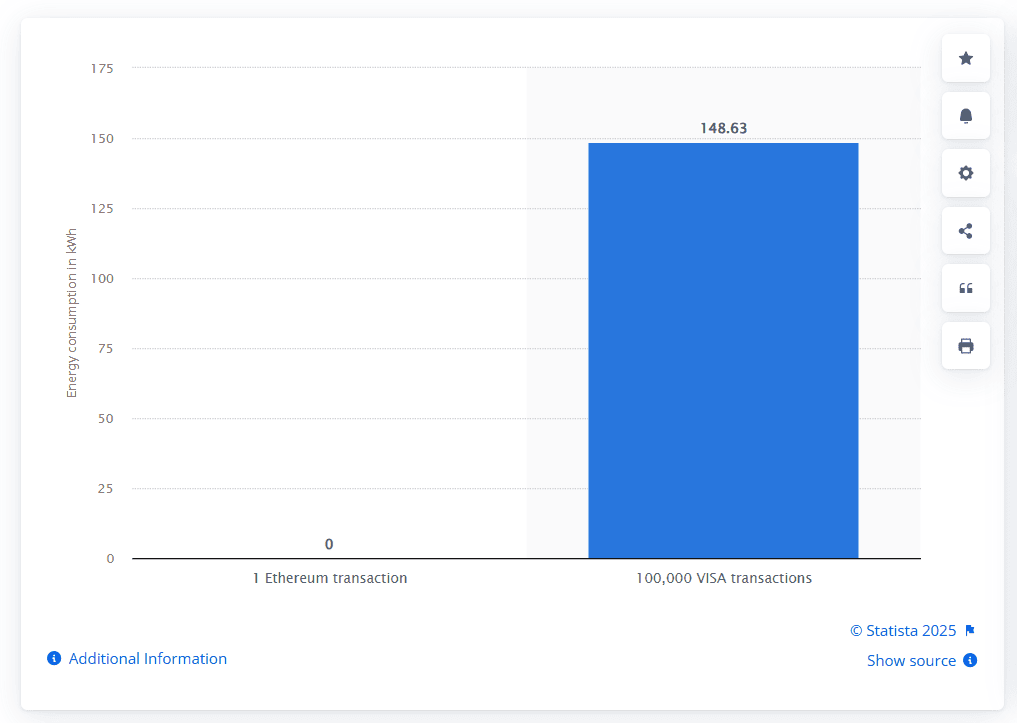
- A single Ethereum transaction consumes about 0 kWh post-Merge.
- By contrast, 100,000 VISA transactions consume around 148.63 kWh.
- This highlights Ethereum’s massive efficiency gains after transitioning to proof-of-stake.
- VISA transactions, despite being highly optimized, still require substantial cumulative energy compared to Ethereum’s per-transaction use.
Ethereum Energy Consumption Overview
- The annualized electricity use for PoS Ethereum is estimated at ~0.0026 TWh/year (≈ 2,601 MWh).
- In the same comparative model, data centers globally consume ~190 TWh/year, making Ethereum’s footprint minuscule by comparison.
- Pre-Merge, Ethereum under PoW consumed on the order of ~21 TWh/year in many reports.
- The shift implies a reduction factor exceeding 8,000× when comparing PoW vs PoS baseline consumption in some sources.
- Operating nodes under PoS (validators) typically run on commodity server setups, requiring only modest power draw (e.g., watts to low kilowatts, not megawatts).
- Estimates of energy use vary due to node diversity (hardware, geographic mix, client software).
- The Cambridge Blockchain Network Sustainability Index tracks rolling estimates, enabling comparisons over time.
Proof-of-Work vs. Proof-of-Stake Energy Usage
- Under PoW, blocks were validated via competition using compute resources; PoS relies on validators staking ETH, eliminating mining races.
- PoW systems like Bitcoin consume ~150–170 TWh/year.
- In PoW days, Ethereum per-transaction energy use was estimated at ~84,000 Wh (84 kWh).
- Under PoS, the newer consensus consumes as little as 35 Wh/transaction in some estimates, representing >99.9% reduction.
- Some sources frame PoS as being ~2,000× more efficient, i.e., ~99.95% less energy usage.
- PoW’s energy draw scales with hashrate; PoS energy is much flatter, tied to validator infrastructure rather than cryptographic competition.
- PoW also leads to greater e-waste, hardware turnover, and cooling overhead.
Electricity Consumption Comparison (TWh/year)
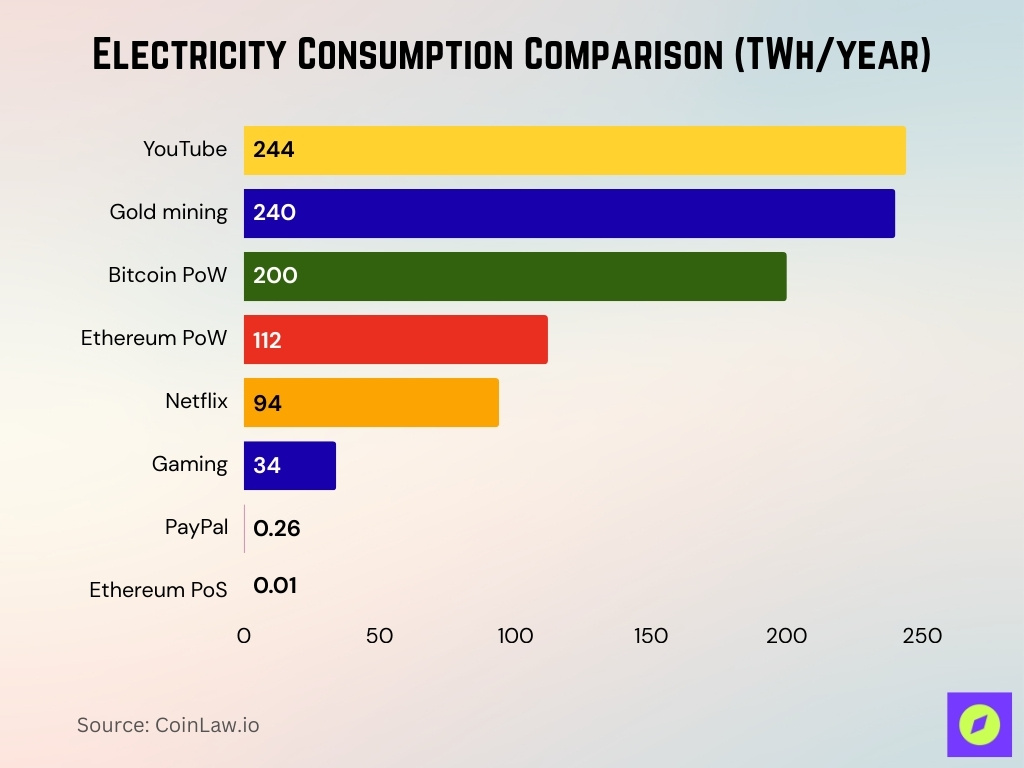
- YouTube consumes about 244 TWh/year, one of the largest figures in the chart.
- Gold mining follows closely at 240 TWh/year.
- Bitcoin PoW requires around 200 TWh/year.
- Ethereum PoW consumed about 112 TWh/year before the Merge.
- Netflix streaming accounts for roughly 94 TWh/year.
- Gaming uses around 34 TWh/year.
- PayPal operations consume only 0.26 TWh/year.
- Ethereum PoS after the Merge requires just 0.01 TWh/year, a >99% reduction compared to PoW.
Annualized Electricity Consumption of Ethereum
- The Ethereum network under PoS consumes about 0.0026 TWh/year (≈ 2,601 MWh) according to the CCRI bottom-up estimate.
- That value corresponds to roughly 870 tonnes CO₂e/year, applying regional carbon intensity factors.
- Before the Merge, estimates placed Ethereum’s PoW consumption at ~21 TWh/year in many comparative analyses.
- In one trend report, the Merge is estimated to have reduced Ethereum’s energy consumption by 99.98%, dropping from ~28.5 TWh to ~0.015 TWh in simulation.
- The Digiconomist Ethereum Energy Consumption Index currently reports ~0.01 TWh as annual consumption (an upper bound) for Ethereum under PoS.
- The global data center energy footprint is ~190 TWh/year; thus, Ethereum’s share is several orders of magnitude lower (≈ 0.0026 / 190 ≈ 0.0014%).
- Comparisons show that PoW Ethereum (pre-Merge) used up to ~8,100× more electricity than its current PoS state.
- Variability exists, as more validator nodes join or depart, the annual consumption may shift slightly upward or downward.
Carbon Footprint and CO₂ Emissions Statistics
- The annual CO₂ emissions associated with Ethereum under PoS are estimated at 870 tonnes CO₂e.
- In earlier PoW mode, annual CO₂ emissions were modeled around 11 million tonnes CO₂e, meaning the drop is on the order of 99.99% in many models.
- A single PoW-era Ethereum transaction had a footprint of ~109.71 kg CO₂ (pre-Merge), which dropped to ~0.01 kg post-Merge.
- Several sources state that the Merge cut Ethereum’s carbon footprint by ~99.95%.
- The CCRI method embeds regional electricity carbon intensities, so the 870-tonne figure is sensitive to node geography.
- In a comparative context, Bitcoin’s emissions currently lie in the tens of millions of tonnes annually (~100+ Mt CO₂).
- Some modeling reviews caution that CO₂ estimates omit embodied emissions (hardware, cooling, etc.), so actual values may differ.
- The drastic emission drop built a strong narrative around Ethereum’s “carbon debt repayment”, that past emissions are now being overridden by ultra-low ongoing emissions.
Per-Transaction Energy Use on Ethereum
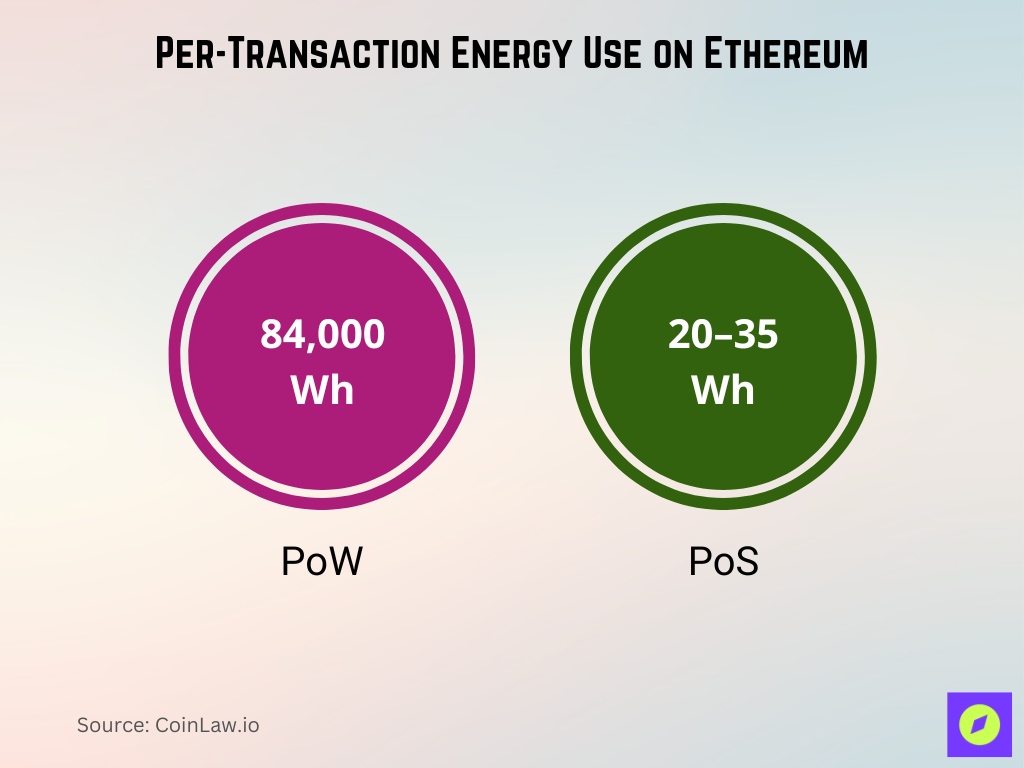
- The Digiconomist index currently estimates ~0.02 kWh (20 Wh) per Ethereum transaction under PoS.
- Some sources set a somewhat higher figure at 0.03 kWh (30 Wh) per transaction.
- In comparison, post-Merge analyses cite ~35 Wh/transaction as a benchmark.
- In contrast, under PoW, Ethereum transaction energy was estimated in some studies at up to 84,000 Wh (84 kWh).
- The EY report notes that prior to Merge, a transaction’s footprint was ~109.71 kg CO₂ (equating to very high energy use) vs ~0.01 kg after.
- Some critics argue that per-transaction metrics are misleading because block-level energy doesn’t scale linearly with transaction count.
- Transaction energy is influenced by block fill rate; when blocks are underutilized, per-transaction share is artificially higher.
- Because validator infrastructure is relatively fixed, marginal transaction additions have only a small incremental energy overhead.
Ethereum’s Share of Global Energy Consumption
- At 0.0026 TWh/year, Ethereum accounts for ~0.0014% of global data center energy usage (~190 TWh).
- Relative to Bitcoin, Ethereum now demands only ~0.005% of Bitcoin’s energy demand (per the EIA citing Cambridge data).
- As of 2025, Bitcoin’s energy use is estimated at ~137 TWh/year, while Ethereum’s is below 0.01 TWh/year.
- Pre-Merge, Ethereum’s energy demand was a nontrivial share of the total blockchain energy pool; post-Merge, its slice is effectively negligible.
- When compared with national energy consumption, Ethereum’s PoS footprint is smaller than many small countries’ annual use.
- Some studies suggest blockchain protocols (including Ethereum) collectively represent small percentages (<1%) of select energy sectors.
- Because the footprint is so low now, shifts in node geography or grid mix (renewables vs fossil) may dominate relative global share changes rather than raw energy.
Comparison With Bitcoin and Other Blockchains
- Bitcoin currently consumes ~193 TWh/year (per Digiconomist) or ~137 TWh/year (other sources), orders of magnitude above Ethereum’s ~0.01 TWh.
- Ethereum post-Merge is ~99.98% more energy efficient (or more) compared to its own prior PoW mode.
- In per-transaction terms, Bitcoin might use 1,000+ kWh, while Ethereum PoS uses ~0.02–0.04 kWh.
- Some PoS chains (like Tezos) post lower per-transaction energy still; comparison shows Ethereum is no longer among the worst.
- Ethereum under PoW consumed energy comparable to medium-sized countries; now its footprint is more akin to a small tech operation.
- Energy consumption is only one axis; latency, throughput, and security tradeoffs exist across blockchains.
- Some blockchains emphasize ultra-low consumption (DAGs, specialized PoS variants), but Ethereum remains competitive in large-scale application ecosystems.
Sustainability and Environmental Impact of Ethereum
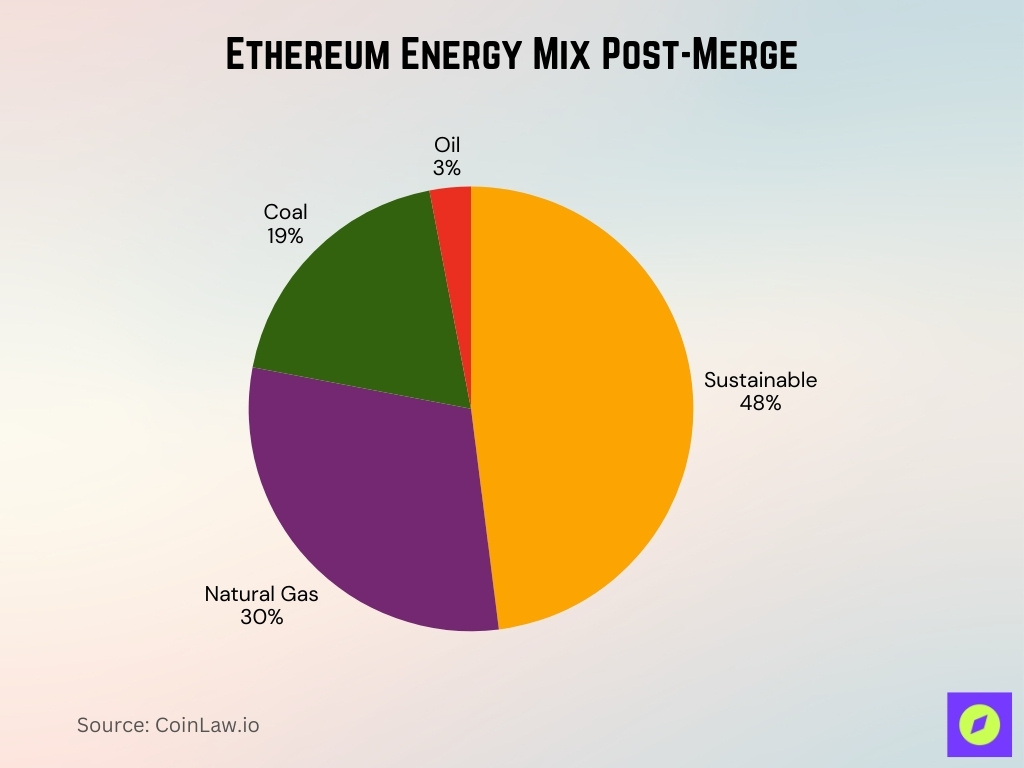
- About 48% of Ethereum’s energy mix is drawn from sustainable sources (wind, nuclear, renewables) post-Merge, with the rest from natural gas (30%), coal (19%), and oil (3%).
- Ethereum’s annual electricity use is 0.0026 TWh (2,601 MWh) under PoS.
- That yields ~870 tonnes CO₂e per year when factoring in regional carbon intensities.
- Prior to the Merge, estimates placed Ethereum’s CO₂ emissions at over 11 million tonnes annually, a drop of ~99.992%.
- The Merge reduced Ethereum’s energy demand by ~99.98% per event-study models.
- Some skepticism remains, since the Merge, Ethereum’s electricity consumption and CO₂ emissions have increased over 300% relative to early post-Merge baselines.
- A 2025 study found the Merge cut energy consumption by ~99.8%, but cautioned that rising node counts and validator activity may erode some efficiency gains over time.
- The Cambridge Digital Assets Program estimated Ethereum’s historical “emissions debt” at 27.5 Mt CO₂e, with ongoing emissions now on the order of 2.8 Kt CO₂e/year.
Ethereum Energy Consumption Before and After The Merge
- Several event-study analyses estimate Ethereum’s energy drop after the Merge at 99.98%.
- The Ethereum Foundation and estimates cite a reduction from the gigawatt scale (in PoW days) to just 2.62 MW under PoS mode.
- In prior PoW mode, the network demanded ~5.13 GW constant draw under some models.
- The Merge reduced carbon emissions from ~11 million tonnes CO₂ to ~870 tonnes in certain comparative models.
- The ratio of emission drop implies a ~99.99% reduction in CO₂ footprint.
- Ethereum’s block reward issuance declined by ~90–97% post-Merge due to the removal of mining rewards and transition to validator incentives, though USD-equivalent income varies with ETH price and staking dynamics.
Centralization and Decentralization Effects on Energy Use
- In the Event Study of the Merge, the Herfindahl index for the top 10 validators showed ~19% less concentration post-Merge.
- The number of unique validators grew significantly; some analyses suggest ~50× more unique validator identities compared to miner identities under PoW.
- However, some concerns arise about reduced randomness in validator selection under PoS, which may tilt the influence toward large stakers.
- Because energy usage under PoS is low and relatively flat, a few dominant validator nodes do not consume vastly more energy than many small ones.
- In PoW, larger operations gained economies of scale, concentrating mining in large farms. That was an inherent centralization pressure tied to energy use.
- In PoS, influence is tied to stake rather than hardware, thus energy cost is decoupled from the scale of validation.
- Some debate exists whether validator collusion or oligopoly (by large staking pools) could indirectly lead to centralization in protocol governance.
- Low incremental energy cost makes it more feasible for a broader set of participants (smaller nodes) to participate, supporting decentralization.
- Agent-based modeling of Ethereum consensus reveals that network topology (node connectivity, latency) influences consensus quality, so decentralization in practice still matters beyond energy.
ReFi and Green Applications on Ethereum
- ReFi (Regenerative Finance) aims to build financial systems that positively impact the environment (e.g., carbon credits, sustainable agriculture) using blockchain.
- As of 2025, Ethereum powers many ReFi projects via tokenization of real-world ecological assets (forests, carbon sinks, etc.).
- Some ReFi whitepapers estimate that Ethereum’s 99%+ reduction in energy made it feasible to host climate-focused projects without massive carbon overhead.
- The Commons Journal analyzed leading ReFi projects (e.g., Celo, Regen, Toucan, Klima, Moss) and highlighted Ethereum’s role as a low-transaction-cost environment for carbon accounting and peer-to-peer trading.
- Some protocols use smart contracts to distribute incentives for carbon sequestration, rewarding users for regenerative behavior.
- ReFi also intersects with public goods funding (e.g., Gitcoin climate rounds) built on Ethereum, creating alignment between finance and environmental goals.
- Critics argue that ReFi still faces issues of measurement integrity, double-counting, and verifying on-chain claims vs real Earth impact.
- As Ethereum remains a dominant smart contract platform, its low energy baseline facilitates experimentation in ReFi without undue carbon burden.
- Some forecasts see growth, and demand for “green” tokenized assets could scale with ESG adoption in traditional finance.
Key Data Sources and Methodologies
- Crypto Carbon Ratings Institute (CCRI) uses bottom-up measurements of different node types, hardware, and client software to estimate electricity consumption and CO₂ emissions.
- Digiconomist’s Ethereum Energy Consumption Index provides rolling estimates of energy and carbon, currently shows ~0.01 TWh/year and ~0.01 Mt CO₂.
- Cambridge Blockchain Network Sustainability Index (CBNSI) applies 7-day moving averages to node counts to track fluctuations in electricity use.
- Event Study Approach, compares metrics before and after the Merge to estimate energy and emission drop rates.
- Trend Reports compile multiple estimates, scenario ranges, and sensitivity analyses.
- Agent-Based Simulation Models simulate consensus behavior, validator dynamics, and network conditions, which indirectly influence energy efficiency.
- Emission Intensity Models, weight electricity use by regional carbon grid intensities to derive CO₂ estimates (key for converting MWh to tonnes CO₂e).
- Limitations & Assumptions, measurement errors from hardware diversity, node geography, client software, cooling overheads, and omitted embodied emissions.
Challenges in Measuring Blockchain Energy Consumption
- Decoupling block energy and transactions, energy to produce a block is independent of the number of transactions; per-transaction estimates can mislead.
- Node heterogeneity, varying hardware, software, and locations, makes aggregation noisy.
- Changing participation, validator nodes enter / exit, so estimates must adjust dynamically (e.g, via moving averages).
- Cooling, repair, and infrastructure overhead, not always captured in published models.
- Embodied emissions, manufacturing, and disposing of hardware are often omitted, underestimating the true carbon cost.
- Grid mix variability, regional carbon intensities shift (e.g,. more renewables), which affects CO₂ conversion.
- Double-counting or omission of off-chain layers, Layer-2 rollups, sequencers, and sidechains may incur energy overhead not always included.
- Temporal volatility, short-term spikes, or dips can skew estimates unless averaged or smoothed.
- Data transparency, some node operators don’t publish power use, and estimates rely on proxies or benchmarks.
- Comparability, different studies use different baselines or assumptions, making direct comparison tricky.
Frequently Asked Questions (FAQs)
Ethereum under PoS consumes about 0.0026 TWh/year (2,601 MWh).
Its energy consumption declined by approximately 99.95%.
The network generates roughly 870 tonnes CO₂e per year.
Each transaction consumes around 0.02 kWh (20 Wh).
Its cumulative emissions debt is estimated at 27.5 Mt CO₂e, versus current yearly emissions of 2.8 Kt CO₂e.
Conclusion
Ethereum’s shift from proof-of-work to proof-of-stake represents a landmark in blockchain sustainability, and energy consumption fell by nearly 99.98%, and CO₂ emissions plunged from millions of tonnes to under a thousand annually. Though measurement challenges remain, the consensus models and carbon conversion frameworks converge on the same story: Ethereum is now operating with an energy footprint closer to a modest enterprise than a nation.
Still, debates about validator centralization, measurement boundaries, and real-world environmental integrity remain open. Nevertheless, the low marginal energy cost opens space for ReFi, green dApps, and carbon accounting systems to thrive on the chain. As you reflect on these numbers and tensions, the full article’s data sections offer deeper context, trend charts, and forecasts to help you understand where Ethereum’s energy story may head next.


