Imagine a world where financial boundaries blur and the flow of money transcends borders as easily as a text message. Cross-border banking has transformed global economies, reshaping how businesses and individuals interact financially. In 2025, as financial landscapes grow more interconnected, the need to understand the statistics behind these trends has never been more crucial.
This article delves into the intricate world of cross-border banking, exploring key milestones, current flows, and uncertainties shaping this dynamic sector.
Editor’s Choice
- Cross-border bank claims expanded by $629 billion, primarily driven by credit to non-bank financial institutions.
- Cross-border loans from BIS reporting banks to the United States were reported at approximately $4.01 trillion.
- 53% of China’s cross-border transactions were conducted in renminbi, up from about 40% in July 2021, indicating increased international use of the currency.
- The average cost of sending $200 in remittances via banks increased, whereas costs via other service providers remained mostly unchanged.
- The cost of funding remittance transactions via mobile money increased to 5.4%, making payment cards the most cost-effective option at 5.1%.
- The Cross-Border Interbank Payment System (CIPS) has 168 direct participants and 1,461 indirect participants across 119 countries and regions.
- In 2024, VTB’s retail customers conducted 2.1 million cross-border transfers in non-sanctioned currencies, totaling over 50.5 billion roubles ($515.33 million), with projections to exceed 240 billion roubles in 2025.
Global Cross-Border Banking Flows
- Asia-Pacific led in cross-border capital inflows, capturing 35% of the global share in 2023.
- Europe saw a decline in cross-border banking activities by 8%, attributed to geopolitical tensions and slower economic recovery.
- North America accounted for $15 trillion in cross-border flows, marking a 12% increase compared to 2022.
- The global banking sector noted a 40% increase in cross-border lending to corporations, driven by post-pandemic expansions.
- Fintech-powered platforms contributed to 18% of cross-border transactions, up from 13% in 2022.
- China’s outbound investments reached $1.2 trillion, with Africa emerging as a key beneficiary of these flows.
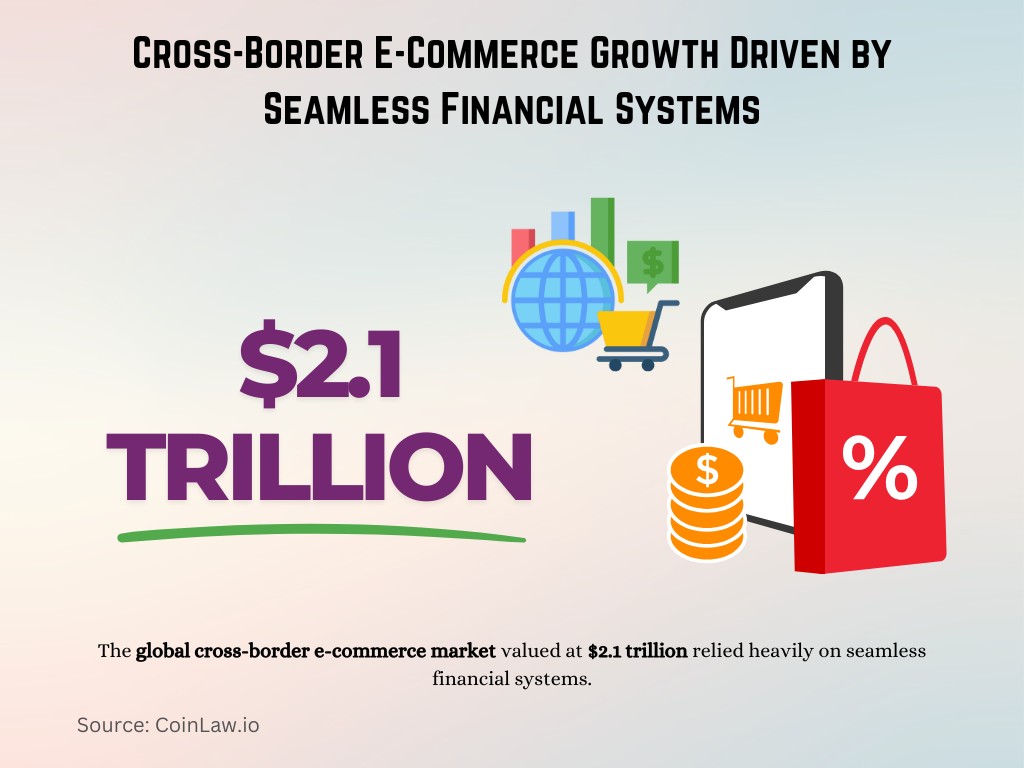
- The global cross-border e-commerce market valued at $2.1 trillion relied heavily on seamless financial systems.

Uncertainty and Cross-Border Banking Flows
- High inflation rates in 2023 led to a slowdown in global credit, reducing cross-border lending by 5% in some regions.
- US monetary tightening caused dollar-denominated debt servicing costs to rise in emerging markets by over 15%.
- The Russia-Ukraine conflict disrupted cross-border banking in Eastern Europe, causing a 20% drop in financial flows.
- Regulatory discrepancies between nations increased transaction costs by 10%, impacting small and medium enterprises (SMEs) significantly.
- Cybersecurity breaches in cross-border payment networks increased by 30%, raising concerns about digital vulnerabilities.
- The IMF predicted a potential 2% dip in global GDP if trade restrictions tighten, directly impacting banking flows.
- Despite uncertainties, $5 trillion worth of sustainable investments crossed borders, reflecting a shift toward green financing.
| Factor | Impact | Percentage/Value |
| High inflation (2023) | Reduced cross-border lending | 5% |
| US monetary tightening | Increased debt servicing costs in emerging markets | 15% |
| Russia-Ukraine conflict | Disrupted flows in Eastern Europe | 20% decline |
| Regulatory discrepancies | Increased transaction costs | 10% |
| Cybersecurity breaches | Increased vulnerabilities | 30% |
| Potential dip in global GDP | If trade restrictions tighten | 2% |
| Sustainable investments | Crossed borders | $5 trillion |
Cross-Border Credit to Non-Banks and Economic Implications
- Cross-border credit to non-bank borrowers reached $13.6 trillion in 2023, showing a steady annual growth of 8%.
- The share of non-banks in total cross-border credit climbed to 45%, driven by private equity firms and large institutional investors.
- Emerging economies received 25% of cross-border non-bank credit, highlighting increasing investor interest in high-growth markets.
- Non-bank lending played a significant role in financing infrastructure projects worth $2.5 trillion globally.
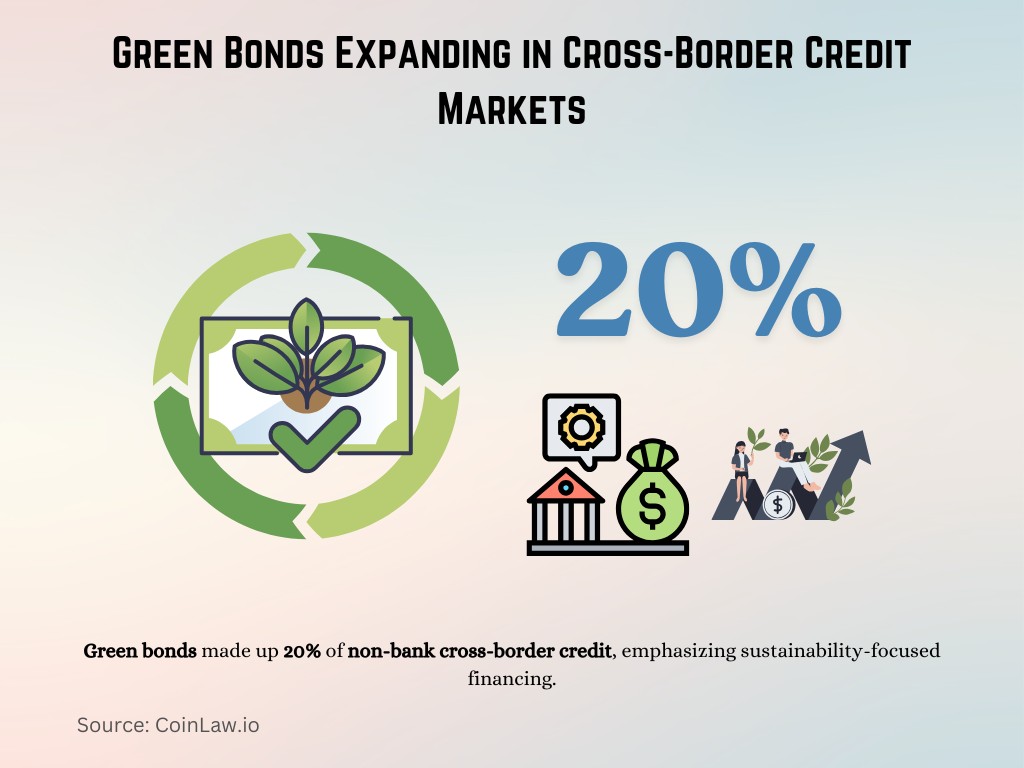
- Green bonds made up 20% of non-bank cross-border credit, emphasizing sustainability-focused financing.

- Cross-border credit for real estate investments grew by 15%, with the US, Canada, and the UK leading this segment.
- The rise of shadow banking contributed to 18% of cross-border credit flows, raising regulatory concerns.
Cross-Border Dollar Credit Amid US Policy Tightening
- Dollar-denominated cross-border credit exceeded $12.4 trillion, maintaining the US dollar’s dominance in global finance.
- Interest rate hikes in the US increased borrowing costs globally, affecting debt repayment in emerging markets.
- Latin America saw a 15% rise in corporate defaults on dollar-denominated loans, a direct impact of US monetary tightening.
- The share of dollar credit to Asian economies grew by 10%, fueled by trade and investment flows linked to China and India.
- Dollar credit demand in Africa rose by 7%, primarily for energy and infrastructure projects.
- US Treasury securities held by foreign banks reached $3.3 trillion, a 5% increase from the previous year.
- The strong dollar led to currency depreciation across 20 major economies, impacting their cross-border trade balance.
Cross-Border Payments Market Overview (2022–2032)
- The cross-border payments market was valued at $181.9 billion in 2022.
- It is projected to grow to $356.5 billion by 2032.
- This represents a Compound Annual Growth Rate (CAGR) of 7.3% from 2023 to 2032.
The market shows a steady upward trend, indicating strong global demand and increased digital transaction adoption.

Regional Analysis of Cross-Border Banking Activities
- Asia-Pacific accounted for 40% of global cross-border banking activities, solidifying its position as a leader in this space.
- Europe experienced a 10% decline, with banking flows disrupted by Brexit-related regulatory shifts and geopolitical tensions.
- The Middle East and North Africa (MENA) region saw a 12% growth, largely driven by oil-exporting economies.
- North America retained a 30% share, with the US playing a pivotal role in both inflows and outflows.
- Sub-Saharan Africa’s banking flows grew by 9%, supported by Chinese investments in critical sectors like energy and transport.
- Latin America’s cross-border banking claims rose by 8%, driven by commodity exports and trade financing.
- The Caribbean saw a 6% rise in cross-border banking flows, fueled by offshore banking and investment hubs.
| Region | Share/Growth | Key Factors |
| Asia-Pacific | 40% of global activity | Leading in banking flows |
| Europe | -10% | Brexit and geopolitical tensions |
| MENA | 12% growth | Oil-exporting economies |
| North America | 30% share | US dominance |
| Sub-Saharan Africa | 9% growth | Chinese investments |
| Latin America | 8% growth | Commodity exports |
| Caribbean | 6% growth | Offshore banking hubs |
Trends in Payment Methods by Transaction Type
- Credit or debit cards are the top choice for Travel (68%) and Ecommerce (51%), but less used for Remittance (28%).
- Digital payment services are widely adopted across all segments: 36% in e-commerce, 28% in Travel, and 30% in Remittance.
- Bank or wire transfers dominate Remittance transactions (51%), compared to 26% in Travel and 22% in e-commerce.
- Peer-to-peer (P2P) services see similar usage for Remittance (26%) but lower for e-commerce (18%) and Travel (17%).
- Pre-paid travel cards are more common in Travel (17%) and Remittance (18%), with lower usage in e-commerce (12%).
Online money transfer services are favored for Remittance (30%) but have minimal use in e-commerce (11%) and Travel (13%). - Money orders are the least used overall, with 18% for Remittance, 13% for Travel, and just 9% for e-commerce.

Cross-Border Bank Credit to Emerging Markets and Advanced Economies
- Emerging markets received $6.7 trillion in cross-border bank credit, marking a 14% increase from 2022.
- Advanced economies remained the largest recipients, taking in 55% of total cross-border bank credit.
- Asia received 30% of total emerging market credit flows, with India and China at the forefront.
- Cross-border bank credit to Latin America grew by 10%, with Brazil receiving a significant portion for industrial financing.
- Africa experienced a 12% growth, driven by mining and agricultural investments.
- The EU reported a 5% drop in cross-border bank credit, linked to economic stagnation in some member states.
- Cross-border credit for renewable energy projects rose by 18%, reflecting global commitments to sustainability.
Top Barriers to Digital Wallet Adoption for Cross-Border Payments in the U.K.
- A significant 32% of U.K. consumers who abstain from using digital wallets say they could be reached by partnering with third-party remittance companies.
- 25% believe adoption would improve through partnerships with other banks or credit unions.
- 22% suggest that greater usage would come by partnering with digital wallet providers.
Overall, lack of awareness remains the largest barrier to adoption in the U.K. market.

Impact of Regulatory Changes on Cross-Border Banking
- Basel III implementation increased compliance costs by 12%, reshaping cross-border banking strategies globally.
- New anti-money laundering (AML) regulations led to a 15% drop in high-risk cross-border transactions, particularly in offshore accounts.
- Emerging markets faced stricter capital controls, reducing inflows of speculative investments by 8%.
- Regulatory misalignments added 10% to transaction costs, especially for small and medium enterprises (SMEs).
- Cross-border tax compliance became a major focus, with G20 nations reporting $1.5 billion in recovered tax revenues from offshore entities.
- Crypto-friendly regulatory frameworks in countries like Singapore boosted cross-border crypto transactions by 20%.
- Sanctions and trade restrictions disrupted banking activities, leading to a 5% decline in global financial flows.
| Regulatory Change | Impact | Value/Percentage |
| Basel III compliance costs | Increased costs | 12% |
| AML regulations | Drop in high-risk transactions | 15% |
| Stricter capital controls | Reduced speculative inflows | 8% |
| Regulatory misalignments | Increased transaction costs | 10% |
| Cross-border tax compliance | Recovered tax revenues | $1.5 billion |
| Crypto-friendly regulations | Boost in cross-border crypto transactions | 20% |
Technological Innovations in Cross-Border Banking
- Blockchain technology powered $2 trillion in cross-border transactions, ensuring faster and more secure processes.
- Digital currencies like CBDCs (Central Bank Digital Currencies) accounted for 15% of total cross-border payments in pilot regions.
- AI-driven fraud detection reduced payment fraud in cross-border banking by 25%, saving billions for financial institutions.
- API-driven banking platforms facilitated 30% of cross-border payments, enhancing real-time transaction capabilities.
- Cross-border remittances via mobile apps grew by 40%, with fintech companies like Wise and Revolut leading the charge.
- Digital ID systems accelerated onboarding for cross-border clients by 35%, improving customer experience.
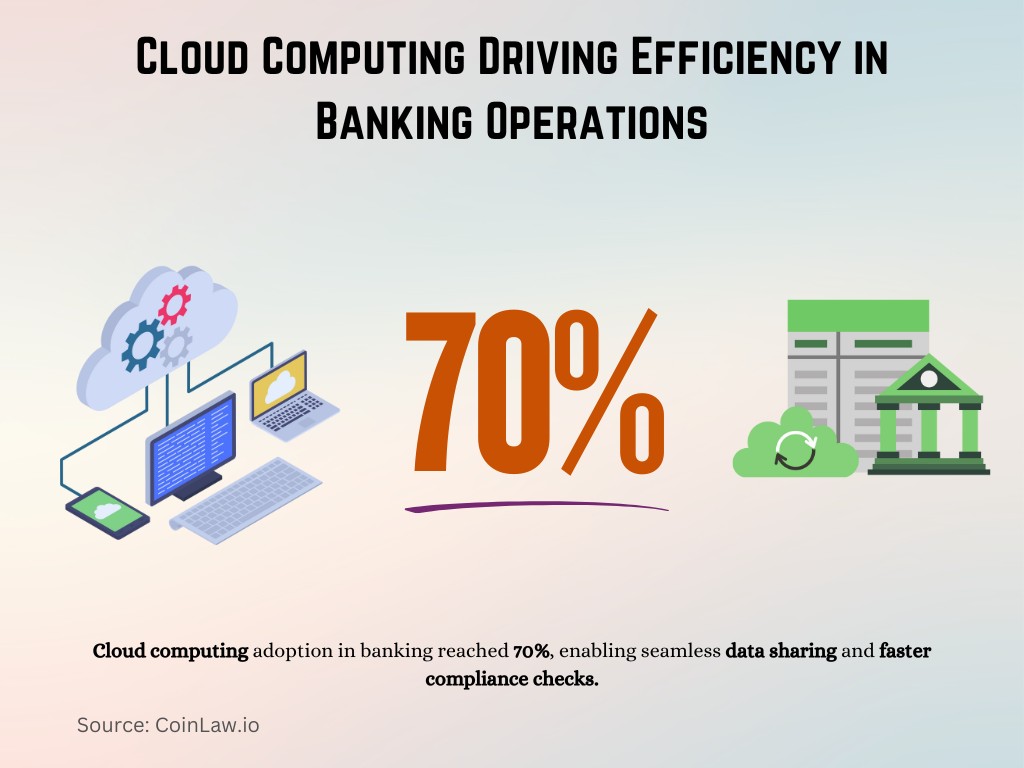
- Cloud computing adoption in banking reached 70%, enabling seamless data sharing and faster compliance checks.

Implications for Economic and Financial Stability
- Cross-border banking’s contribution to global GDP increased by 5%, highlighting its role in economic integration.
- Emerging economies with strong banking ties experienced 2% higher growth compared to those with limited access.
- Increased cross-border credit in sustainable projects mitigated financial risks associated with climate change.
- Dependency on dollar-denominated debt raised vulnerability to US monetary policy changes in over 40 countries.
- Financial crisis risks decreased by 20%, thanks to coordinated global banking regulations.
- The rise of fintech reduced banking exclusion, adding 200 million people to the global financial ecosystem.
- Cybersecurity threats remain a major concern, with the potential to disrupt cross-border banking flows and destabilize economies.
Recent Developments
- Global Expansion: In the third quarter of 2024, banks’ cross-border claims expanded by $629 billion, marking a 3.4% year-on-year increase, primarily driven by credit to non-bank financial institutions in advanced economies.
- Technological Integration: The SEPA Instant Payments Regulation took effect in Europe, requiring banks to be capable of receiving instant payments by January 9, 2025, and sending them by October 9, 2025.
- Geopolitical Influences: U.S. President Donald Trump raised concerns about the fairness of Canada’s dealings with American banks, highlighting issues in cross-border banking regulations and operations.
- Digital Currency Initiatives: The Bank for International Settlements (BIS) initiated the “mBridge” project, a cross-border central bank digital currency involving China, Hong Kong, Thailand, UAE, and Saudi Arabia, aiming to enhance cross-border payment efficiency.
- Shifts in Wealth Management: Switzerland’s wealth management industry is facing increased competition from Asian financial hubs like Hong Kong and Singapore, leading Swiss wealth managers to expand their presence in Asia to maintain their global standing.
Conclusion
Cross-border banking continues to shape the global economic framework, acting as a bridge between nations and industries. Technological innovations, regulatory adjustments, and evolving economic trends define its current and future trajectory. While challenges like geopolitical tensions and cybersecurity risks persist, the sector’s potential to foster financial inclusion and economic stability remains unparalleled. As the world moves towards a more interconnected financial ecosystem, understanding these dynamics is crucial for policymakers, businesses, and individuals alike.


