Consumer debt in the U.S. has kept rising, reaching new highs in mortgage, credit card, auto, and student loan balances. Two real‑world impacts: Homebuyers face steeper payments because mortgage balances and rates are rising, tightening affordability. And millions of student loan borrowers resumed payments today, triggering spikes in delinquency rates and credit‑score impacts. These shifts affect everything from consumer spending to mortgage markets.
Let’s explore the full picture, recent developments, what kinds of debt are growing, who holds that debt, and what it means for the months ahead.
Editor’s Choice
- Total U.S. household debt stood at $18.39 trillion at the end of Q2 2025, up about 1% ($185 billion) over the prior quarter.
- Housing‑related debt (mortgages + home equity) rose by $149 billion in Q2 2025.
- Non‑housing debt, including credit cards, auto, and student loans, increased by $45 billion in Q2 2025.
- Mortgage balances alone climbed by $131 billion in Q2 2025.
- Credit card debt rose by $27 billion in Q2 2025, another quarterly high.
- Auto loans increased by $13 billion, and student loans by $7 billion in the same quarter.
- Credit card balances matched last year’s record figure (about $1.21 trillion).
- Delinquency rates remain elevated, with approximately 4.4% of debt in some phase of delinquency.
Recent Developments
- Resumption of student loan payments in 2025 triggered an increase in serious delinquencies (90+ days overdue) among student loan borrowers.
- In Q1 2025, serious delinquency across all credit types rose from 2.0% in Q4 2024 to about 2.8%, driven largely by student loans.
- Non‑housing debt growth is slower than housing debt, but auto, credit card, and student loan balances all increased in Q2.
- Credit card APRs have climbed, in some reports averaging 22‑24%+ in mid‑2025.
- Lower savings, higher prices, and inflation are squeezing household budgets, making debt servicing harder.
- Regulators and credit reporting are now more focused on overdue BNPL and student loan reporting to agencies.
- Mortgage delinquency edges up slightly, and auto and credit card delinquency are more stable but still elevated compared to pre‑pandemic periods.
Overview of Consumer Debt
- As of end‑Q2 2025, total U.S. household debt stood at $18.39 trillion.
- Housing debt is the largest share, followed by credit cards, auto loans, and student loans.
- Non‑housing debt (credit cards, autos, student loans) accounts for a smaller but growing portion of total debt.
- Average credit card debt among cardholders with unpaid balances in Q1 2025 was about $7,321, up 5.8% from Q1 2024.
- The average household debt per U.S. household is estimated to be around $105,056 in mid‑2025.
- Total consumer (non‑mortgage) credit was reported as $17.68‑$17.7 trillion in early 2025, up 1.8% from a year earlier.
- Revolving credit (mostly credit cards) growth rate in July 2025 was 9.7% annually.
Total Consumer Debt Breakdown
- Mortgage debt grew by about $131 billion in Q2 2025.
- Credit card debt rose by $27 billion in Q2 2025.
- Auto loans increased by $13 billion in Q2.
- Student loan balances increased by about $7 billion in Q2.
- Housing debt (mortgages + home equity) alone rose by $149 billion in Q2.
- Non‑housing debt rose by $45 billion in the same period.

Debt by Type (Mortgage, Credit Card, Auto, Student Loan, Personal Loan)
- Mortgage balances reached $12.94 trillion by the end of Q2 2025, up about $131 billion over the previous quarter.
- Credit card debt stood at $1.21 trillion in Q2 2025, rising by $27 billion from Q1.
- Auto loan balances climbed to $1.66 trillion, an increase of $13 billion in Q2 2025.
- Student loan balances edged up by $7 billion in Q2, totaling around $1.64 trillion.
- Home Equity Lines of Credit (HELOC) balances were about $411 billion, after rising by $9 billion in the quarter.
- Non‑housing debt overall (credit cards, autos, student loans) increased 0.9% from Q1 to Q2 2025.
- Mortgage originations in Q2 2025 were about $458 billion in new mortgages.
- New auto loans and leases appearing on credit reports in Q2 were $188 billion, up from $166 billion in Q1.
- Aggregate credit card limits rose by $78 billion in Q2, about a 1.5% increase.
Consumer Debt by Generation
- Gen Z added more debt between June 2024 and June 2025 than any other generation.
- Younger borrowers carry more debt per person and show the highest delinquency rates.
- Individuals aged 40‑49 held the most total debt in Q2 2025, about 4.3 times what 18‑29 year‑olds carried.
- Millennials and Gen Z are disproportionately exposed to student loan and credit card debt compared to older generations.
- Older generations (age 70+) show lower delinquency rates but still maintain some debt, particularly mortgage debt.
- Across generations, mortgage debt remains the dominant debt type, especially among older households who are more likely to own homes.
BNPL vs. Credit Card Usage by Demographic
- Millennials showed the highest increase in BNPL usage at 87%, while their credit card usage dropped by 18%.
- Gen Z adults leaned into credit cards, with a 30% increase, while BNPL usage grew more modestly at 15%.
- Gen Xers increased BNPL usage by 12%, but reduced credit card use by 14%.
- Baby boomers were the only generation to report a decline in BNPL usage (–27%), while credit card use also fell by 9%.
- Across all U.S. adults, BNPL usage rose by 32%, and credit card usage declined by 11%.
- Low-income earners (under $50K) increased BNPL usage by 33%, with only a slight drop in credit card usage (–2%).
- Those earning $50K–$99.9K used BNPL 22% more, but reduced credit card usage by 16%.
- High-income earners ($100K+) adopted BNPL more aggressively (44% increase) while cutting back on credit cards by 19%.
- Parents reported a 74% surge in BNPL usage, compared to a 26% drop in credit card usage, suggesting a major shift in borrowing behavior.
- Non-parents showed marginal changes, with BNPL down by 2% and credit cards down by 4%.

Consumer Debt Trends by Income and Age
- In the lowest‑income 10% of ZIP codes, credit card debt that is 30+ days delinquent rose to 22.8% in Q1 2025.
- The highest‑income 10% saw a delinquency rate of 8.3% in the same period.
- The 90‑day delinquency rate for credit cards in the lowest income decile climbed to 20.1% in Q1 2025; in the highest income decile, around 7.3%.
- Delinquency rates rise sharply among younger age groups: 18‑29-year-olds had a serious delinquency rate of 3.35% in Q1 2025.
- Age 30‑39 had 2.97%, age 40‑49 about 2.41%, age 50‑59 around 2.47%, age 60‑69 1.72%, age 70+ 1.69%.
- Overall delinquency was 4.3‑4.4% of outstanding debt in Q1‑Q2 2025.
- Serious student loan delinquency (90+ days) jumped from 0.53% in Q4 2024 to 7.74% in Q1 2025.
Debt‑to‑Income Ratios
- Debt‑to‑income (DTI) ratios have been rising modestly, reflecting that debt is growing somewhat faster than income in many households.
- Lower‑income households show significantly higher DTI, especially when credit card, auto, and student loan payments are included.
- Middle-aged groups (30‑49) often have the highest absolute debt burdens and correspondingly higher DTI ratios.
- Younger age groups (18‑29) may have lower total debt, but a higher proportion of income devoted to servicing debt due to smaller incomes.
- In Q2 2025, non‑housing debt grew 0.9%, while income growth lagged in many sectors, pushing up DTI pressure.
- Resumption of student loan payments and associated reporting has increased the “debt service burden” for many.
- Credit card APRs at 22‑24% mean interest payments are large relative to income, amplifying DTI impact.
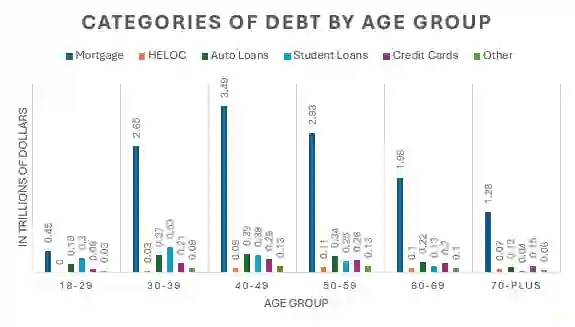
U.S. Debt Categories by Age Group
- 40–49-year-olds carry the highest mortgage debt, totaling $3.49 trillion, more than any other age group.
- 30–39-year-olds follow closely, with $2.65 trillion in mortgage debt and a notable $0.73 trillion in auto loans.
- 50–59-year-olds hold $2.93 trillion in mortgage debt and the second-highest credit card debt at $0.26 trillion.
- 18–29-year-olds hold the least total debt, with only $0.45 trillion in mortgages and $0.13 trillion in student loans.
- Student loans peak in the 40–49 age group at $0.39 trillion, reflecting long-term repayment trends.
- HELOC (Home Equity Line of Credit) debt rises with age, peaking at $0.13 trillion among 50–59-year-olds.
- 70+ Americans still carry $1.28 trillion in mortgage debt and $0.42 trillion in auto loans, indicating extended borrowing into retirement.
- Credit card debt is relatively consistent among ages 30–59, with peaks of $0.28 trillion for 40–49 and $0.26 trillion for 50–59.
- The “Other” debt category remains low across all age groups, highest in the 70+ at $0.06 trillion.

Delinquency and Default Rates
- Aggregate delinquency was around 4.3% at the end of Q1 2025, up from 3.6% in Q4 2024.
- In Q2 2025, outstanding debt in some stage of delinquency remained elevated, about 4.4%.
- The credit card loan delinquency rate was 3.05% in Q2 2025.
- Student loan serious delinquency (90+ days late) rose sharply after resumption of reporting: from 0.53% in Q4 2024 to 7.74% in Q1 2025.
- In the lowest‑income 10% ZIP codes, 30‑day delinquency on credit card debt was 22.8% in Q1 2025.
- 90‑day credit card debt delinquency for the lowest income decile was 20.1% in Q1 2025; the highest income decile was 7.3%.
- Among age groups, 18‑29 year‑olds had serious delinquency at 3.35%, as compared to 1.69% for those 70+.
Global Comparison of Consumer Debt
- U.S. household debt is about 72.9% of GDP, higher than Germany (51.3%) and Italy (37.8%), but lower than Canada (102.2%).
- Among OECD countries, the U.S. has a mid‐to‐upper ranking for household liabilities relative to net disposable income.
- In countries like Japan (65.7%), France (62.6%), and the UK (77.8%), household debt as % of GDP is closer to or somewhat lower than in the U.S.
- Emerging economies tend to have much lower household debt ratios.
- U.S. total household debt (≈ $18.39 trillion) is large in absolute value, but several countries with smaller economies have debt burdens that are large relative to their GDP.
- Consumer credit growth rates for revolving credit in the U.S. (9.7% annualized as of July 2025) are high compared to many advanced economies.
- Nonrevolving credit in the U.S. is growing, too, though more slowly.
- Variations in regulation, social safety nets, credit culture, and interest rate environments among countries drive large differences in how consumer debt impacts households globally.
What Impacts Your Credit Score the Most?
- Payment history is the largest factor, making up 35% of your credit score. Late or missed payments can significantly damage your credit.
- Amount owed contributes 30%. Keeping balances under 30% of your credit limit helps maintain a healthy score, even if you pay in full each month.
- New accounts affect 15% of your score. Opening too many new credit lines at once may lower your score due to hard inquiries.
- Length of credit history makes up 10%. A longer history shows stability, but even short histories can be positive with responsible use.
- Types of credit used account for the final 10%. A diverse mix of credit types (mortgage, student loan, credit card, etc.) may boost your score.

Impact of Interest Rates on Debt
- The effective federal funds rate has hovered around 4.33% in September 2025.
- Revolving credit in July 2025 increased at an annual rate of 9.7%.
- Nonrevolving credit grew at about 1.8% in the same period.
- Mortgage rates remain elevated, which raises monthly payments and reduces affordability for prospective homebuyers.
- The net interest on U.S. federal debt is projected to total approximately $870 billion in FY2025, with future growth depending on interest rates and debt levels.
- Higher rates increase the cost of carrying credit card balances, auto loans, and other unsecured debt.
- For households with variable-rate debt, interest expense volatility adds uncertainty to budget planning.
- The cost of new debt issuance by households is more sensitive to rate hikes, making borrowing more expensive.
Future Outlook
- As of September 2025, futures markets and economic forecasts suggest the Federal Reserve may reduce interest rates by 25–50 basis points by year-end, depending on inflation and labor market data.
- If revolving credit growth continues at current rates and rates remain high, debt servicing burdens may continue rising.
- Innovations in debt relief, such as more flexible repayment options and expanded forbearance, may become more common.
- Home equity and real estate values could provide some cushion for households through refinancing.
- Regulatory oversight is likely to increase, especially for high‑APR products, BNPL, and student lending.
- Global trends suggest that countries with high household debt may be more exposed if economic growth slows or interest rates rise further.
Frequently Asked Questions (FAQs)
About $18.39 trillion.
Mortgage balances increased by $131 billion in Q2 2025, reaching about $12.94 trillion by end‑June 2025.
Approximately 4.4%.
Credit card balances rose by $27 billion to $1.21 trillion; auto loan balances rose by $13 billion to $1.66 trillion.
Revolving credit increased at about a 9.7% annual rate, nonrevolving credit at about a 1.8%.
Conclusion
U.S. consumer debt today remains large and rising. Partly driven by high interest rates and resumed obligations like student loans, debt burdens are creating real risks, higher delinquency, reduced access to good credit, and financial strain for many households. In a global context, the U.S. has high household debt relative to GDP, though not alone. The shape of the next year depends on interest rate policy, regulatory moves, and how well borrowers adapt.
Understanding these trends matters for policymakers, lenders, and most importantly, for consumers navigating their own debt.


