Introduction
Online payments and digital transactions have become ubiquitous in the 21st century, transforming how consumers shop and businesses operate. As the world has shifted towards increased e-commerce and mobile commerce, online payments have exploded in popularity and usage over the past decade. In 2021 alone, global digital and mobile payment transaction values amounted to $7.5 trillion, representing a year-over-year growth rate of 26%. This massive growth underscores how integral online payments have become to the modern economy.
The adoption of online payments by consumers and merchants will be examined, analyzing preferences for different payment methods based on geography and demographics. Key players in the payments processing industry will be assessed, highlighting market shares for top payment networks and gateways. Factors driving the proliferation of new forms of online payments, from cryptocurrencies to mobile money, will also be explored based on emerging statistics. Finally, the article will highlight statistics related to security, highlighting consumer concerns and payment fraud risks as adoption spreads. The data provided aims to illustrate the dramatic evolution of online and mobile payments in recent years, and what ongoing digital disruption could mean for the future of finance and transactions.
Editors Choice
- The global digital payments market was estimated to be valued at $4.9 trillion in 2020 and is projected to experience a CAGR of 18% between 2020-2025.
- Mobile payments accounted for 47% of global e-commerce transactions in 2021 and were projected to experience compound annual compounded growth at 23% between 2025-2030.
- Digital wallets such as PayPal and Alipay have quickly become the go-to online payment methods with a 48% market share worldwide for transaction volume.
- North America accounts for 46% of global digital transaction values; however, Asia Pacific is showing the greatest progress.
- Digital wallets (1.4%) and credit cards (0.9%) remain among the highest-risk products, while debit cards experience just 0.2% fraud.
- Alternative payments such as BNPL, cryptocurrency, and P2P apps are increasingly gaining traction with younger demographics.
- PayPal leads the payment gateway industry with a 32% market share, while Stripe processes billions in transactions for over 250,000 businesses each year.
- Paytm has over 337 million registered users in India and leads offline mobile payments with a 70% market share.
U. S. Online Payments Statistics
Are You Doing Business in the US? Check Out These U.S. Online Payments Statistics To Gain Insight into Consumer Preferences For Payment Methods
- Estimations suggest that digital payment transactions in the US could reach $2.041,000.00 billion by 2023.
- The United States Online Payments Market is projected to experience compound annual compound growth of 14.66% by 2027 and reach $3.5 trillion.
- In 2022, 7 out of 10 US customers who participated in a survey agreed to use mobile payment apps as their preferred method for making purchases.
- 56% of US customers surveyed felt comfortable leaving wallets at home and using mobile payments via their phones for payments in 2022.
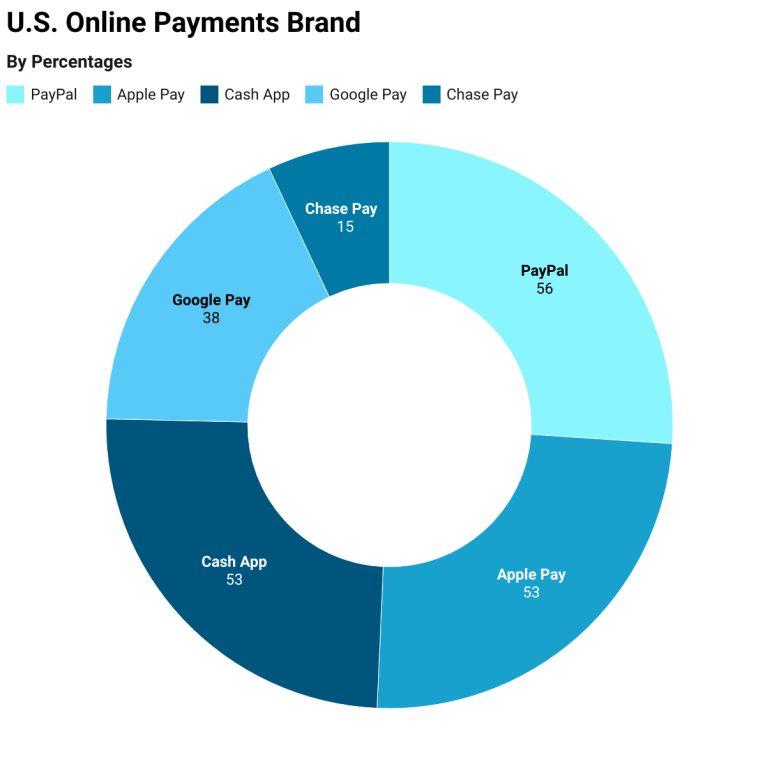
- PayPal, Apple Pay, and Cash App are the three primary mobile payment brands used by American consumers in the US.
Market Size and Growth
The online payments industry has experienced massive growth over the past decade, fundamentally transforming commerce and transactions across the globe. According to Worldpay data, the global market for digital and mobile payment transactions was valued at $4.9 trillion in 2020. This is forecast to grow to $7.5 trillion by 2021 and further increase to $10.5 trillion by 2025, reflecting a compound annual growth rate (CAGR) of 18% over the 5-year period.
North America accounted for the greatest proportion of global digital transaction values in 2020, at $2.13 trillion or 43% of the total market. However, the Asia-Pacific region is expected to see the fastest growth going forward, with digital payments in APAC forecast to reach $3.5 trillion by 2025.
When segmented by technology, mobile payments made up the largest share of global digital transaction values in 2020, amounting to $2.8 trillion or 57% of the total. Mobile commerce is projected to continue leading growth, with m-payments forecast to grow at a CAGR of 23% globally between 2021-2025.
The expanding online payments market size correlates directly with the accelerating growth of worldwide e-commerce sales. According to eMarketer, global retail e-commerce sales grew 20% in 2021 to reach $5.2 trillion, representing nearly 22% of total retail spending. As more businesses shift sales online and consumers become ever more comfortable with digital payments, this will continue fueling the growth of cashless transactions worldwide.
Segmentation
Segmentation by Payment Method
Digital wallets like PayPal, Alipay, and Apple Pay have become the most popular online payment method by transaction volume. In 2021, digital wallets accounted for 48% of global e-commerce transactions, followed by credit cards (31%), debit cards (13%), and bank transfers (8%). In terms of total value, credit cards remain the top payment method at 36% market share globally, with digital wallets at 35%, bank transfers at 17%, and debit cards at 12%.
Segmentation by Industry
The retail sector accounts for the largest share of global digital transaction values, representing nearly 50% of the total in 2021. Digital media, travel, and software/SAAS follow as the next largest industries for online payments, with approximately 11%, 7%, and 4% market share respectively. Online food delivery is the fastest-growing payments vertical, forecast to grow at a CAGR of 23% through 2025.
Segmentation by Region
In 2021, North America accounted for nearly half (46%) of total global digital transaction values, followed by Asia Pacific (32%), Europe (17%), Latin America (3%), and Middle East & Africa (2%). Asia Pacific is expected to see the most growth, with its market share rising to 40% by 2025, while North America’s share declines slightly to 41% by that time.
Global Online Payments revenue is projected to reach $14.66 trillion by 2027.
According to the most recent Online Payments growth statistics (2022), global digital payment transactional value is projected to hit $14.66 trillion by 2027.
Global Online Payments market revenue is projected to expand at an average compound annual growth rate of 11.79% from 2023-2027.
In 2023 digital payment is projected to see transaction values reach $9.47 trillion worldwide.
| Total Transaction Value |
2023 Online Payments |
Growth Rate CAGR |
2027 Online Payments |
| Global | $9.47 T | 11.79% | $14.66 T |
| USA | $2.04 T | 14.66% | $3.53 T |
| China | $3.85 T | 7.80% | $5.20 T |
*Dollars are in USD.
The total U.S. Online Payments transaction value is projected to reach $3.53 trillion by 2027.
- U.S. Online Payments revenue is forecasted to experience compound annual compound growth of 14.66% between 2023-2027.
- By 2023, Online Payments transaction values across the U.S. are expected to surpass $2.04 trillion.
The total China Online Payments transaction value is projected to reach $5.20 trillion by 2027.
- China’s Online Payments revenue is expected to experience compound annual compounded growth of 7.80% between 2023-2027.
- By 2023, China’s Online Payments transaction value is projected to have reached $3.85 trillion.
2. Two-thirds (2/3) of adults worldwide are now using Online Payments, 89% in the U.S.
According to World Bank Group global Online Payments statistics (2021), 64% of adults worldwide now make or receive Online Payments.
In developed nations, 95% of adults use Online Payments compared to 57% in developing nations.
| Using Online Payments | Global Latest 2021 |
Developed Countries |
Developing Countries |
| Adults | 64% | 95% | 57% |
| Account owners | 84% | 98% | 80% |
About 84% of financial services account owners globally conduct digital transactions.
In developed nations, 98% of account owners utilize Online Payments compared to only 80% of adults in developing nations.
About 9 in 10 Americans are now using Online Payments.
According to McKinsey & Co’s most recent U.S. Online Payments statistics (2022), 89% of Americans now utilize digital payment methods.
| U.S. Consumers | Percentage |
| Using Online Payments | 89% |
| Used two or more forms of Online Payments | 62% |
| Done in-app and peer-to-peer (P2P) purchases | 69% |
| Expect to have a digital wallet within two years | 60% |
American consumers who utilize multiple forms of Online Payments have increased from 51% in 2021 to 62% by 2022.
About 69% of users had conducted in-app and peer-to-peer (P2P) purchases by 2022.
60% of Americans anticipate owning a digital wallet within two years.
Online Payments Statistics
In the last few years, the convenience of paying anywhere using Online phones has resulted in a significant growth in m-payments. The Online payments market is expected to grow further in upcoming years as well.
Here are the key Online payment statistics supporting its growth:
- Global Online transactions were valued at $2 trillion in 2022.
- The Online payments market is expanding at an estimated CAGR of 36.2% from 2023-2030.
- Online payments will continue to expand and will overtake cash and card payments by 2025.
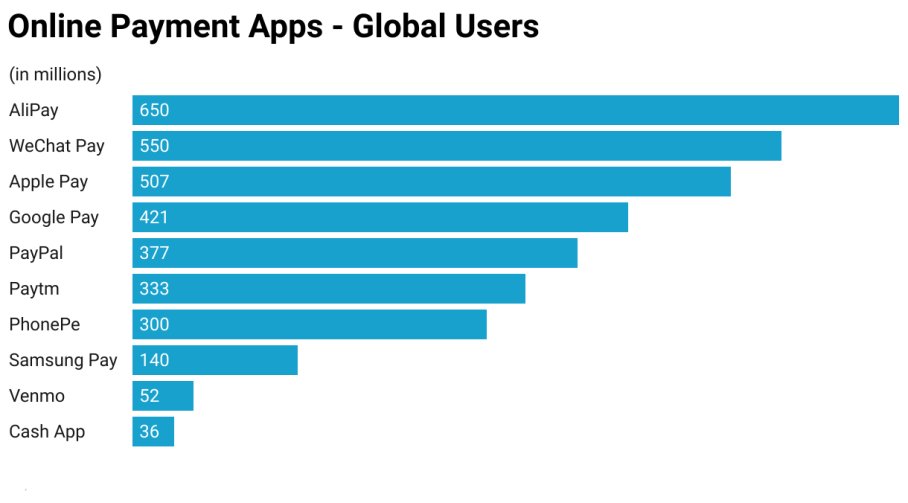
- AliPay, WeChat Pay, and Apple Pay were the market leaders in Online payments in 2022.
Below is a table listing the top 10 Online payment apps and their user bases:

Consumer Preferences and Behavior
Consumer Preferences
Surveys consistently show digital wallets like PayPal to be the most preferred online payment method globally, with over 50% of consumers selecting it as their top choice. Credit cards come second, preferred among 15-25% of shoppers. Preferences vary by region – in China, 83% of consumers prefer Alipay, while in Germany, over 50% favor direct bank transfers.
Mobile payments are also gaining strong traction among consumers, with adoption rates accelerating since the pandemic began in 2020. Surveys found over 65% of consumers now use their smartphones to make purchases. Digital wallets like Apple Pay and Google Pay rank as the top preferred mobile payment methods.
Purchase Frequency and Ticket Size
On average, consumers make 2-3 online purchases per month, according to payment provider Worldpay’s data. Average order values differ significantly by industry – for food delivery and ridesharing the averages are $20-$25, while for electronics and luxury retail, it is $200-$300.
Across sectors, the average online transaction size is approximately $85. Mobile transactions still tend to be smaller than desktop purchases, averaging around $60 per order.
Mobile Payments Growth
Mobile payments are the fastest-growing segment of digital transactions. Mobile’s share of total online transaction volume rose from 30% pre-pandemic to 47% in 2021, per Worldpay data. The mobile payments market is forecast to grow at a CAGR of 23% from 2021-2025, versus 18% for the total digital payments market. Adoption is being driven especially by Generations Y and Z, over 85% of whom have made mobile point-of-sale purchases.
Main Players Statistics
PayPal:
- Revenue (2021): $25.4 billion
- Total Payment Volume (2021): $1.25 trillion
- Market valuation: $134 billion (as of Jan 2022)
- Global digital wallets market share: 32%
- Active user accounts: 429 million (Q3 2021)
- Total transactions: 15 billion (2021)
Stripe:
- Revenue (2020): $7.4 billion
- Valuation (2021): $95 billion
- Market share: 2.4% of card volume outside China
- Customers: Over 250,000 businesses globally
Square:
- Revenue (2021): $17.6 billion
- Gross Payment Volume (2021): $166 billion
- Market cap (Jan 2022): $55 billion
- Sellers using Square (2021): Over 30 million
- Cash App users: 70 million (2021)
Paytm:
- Registered users: Over 337 million (Nov 2021)
- Annual revenue (FY22): $1.01 billion
- Valuation: $20 billion (IPO Nov 2021)
- offline mobile payments market share: 70%
- Merchants using Paytm: 22 million+
Merchant Adoption
Percentage of merchants accepting online payments: An estimated 68% of small businesses globally now accept online payments directly through their websites or e-commerce storefronts. This is up from 63% in 2020, indicating steady growth in merchant adoption of digital payments capabilities.
Most adopted payment gateways and processors: PayPal leads as the top payment gateway worldwide, used by over 70% of merchants selling online. Stripe follows with approximately 30% merchant adoption, while Authorize.Net, Braintree, and Square each hold a 10-15% market share of online merchants.
Barriers to adoption for small businesses: High setup costs and processing fees are the main barriers holding back further adoption, cited by 65% of small businesses surveyed. Technical integration challenges and lack of customer demand follow as the next most common obstacles, at 55% and 45% respectively.
Among small retailers selling online, only 54% currently support mobile payments in-store through options like Apple Pay or Google Pay. The lack of compatible POS systems was ranked as their biggest obstacle to supporting mobile payments more widely.
Fraud rates by payment type: Fraud rates are lowest for debit cards, at just 0.2% of transaction volume as of 2021. Credit cards see higher fraud rates around 0.9%. Digital wallet fraud rates are the highest at 1.4% of transaction volume.
Consumer confidence: 68% of consumers report feeling confident in the security of online payments, while 15% remain very concerned according to a 2021 survey. 71% are worried about payment card fraud when shopping online.
Authentication methods:
- 3D Secure – Used for 63% of overall e-commerce transactions as of 2021, up from 47% in 2019. Helps reduce fraud rates by over 20%.
- Biometrics – 15% of consumers have used fingerprint, face, or iris scanning for payment authorization. Another 46% expressed interest in adopting biometric verification.
- One-time passcodes – Second most common authentication method, used for 23% of online transactions. Reduces fraud rates by 8-12% for online banking and payments.
Emerging Trends
Cryptocurrency Payments
- Cryptocurrency ownership globally has risen from 3% in 2020 to 6% in 2021.
- $15 billion worth of cryptocurrency was spent on payments in 2020. This is forecast to grow to over $30 billion by 2023.
- Among those who own cryptocurrency, 41% have used it to make a purchase online.
- Leading merchants accepting crypto payments include Microsoft, AT&T, and Home Depot. Around 30% of major online retailers are projected to accept crypto by 2025.
Buy Now, Pay Later Services
- Buy now pay later (BNPL) transaction values doubled from $60 billion in 2019 to over $120 billion in 2021 worldwide.
- BNPL usage rose most in online fashion/apparel and electronics purchases, increasing over 150% since 2019.
- About 25% of e-commerce shoppers have used BNPL services. Adoption rates are highest among younger demographics, at 35% for Gen Z and 30% for millennials.
Peer-to-Peer Payments
- 75% of millennials and Gen Z consumers reported using peer-to-peer payment apps like Venmo, Paypal, and CashApp.
- Top uses for P2P apps include splitting shared expenses (45% of users), paying friends (38%), and paying for family purchases (9%).
- The average P2P transaction size is around $55. Total P2P transaction volume is projected to reach $1.8 trillion globally by 2025.
FAQ
1. How big is the global digital payments market currently?
A. The global digital payments market was valued at $4.9 trillion in transaction volume in 2020. This includes mobile wallets, bank cards, e-commerce payments, and more.
2. Which region has the highest adoption of digital payments?
A. North America accounts for the greatest share (46%) of global digital transaction values as of 2021. However, Asia Pacific is expected to see the fastest growth in the coming years.
3. What is the most popular online payment method?
A. Digital wallets like PayPal and Alipay are now the most commonly used online payment method based on transaction volume, accounting for 48% of global e-commerce transactions.
4. How fast is the mobile payments segment growing?
A. Mobile payments are expanding rapidly, forecast to grow at a 23% CAGR from 2021-2025. They accounted for 47% of online transaction volume globally in 2021.
5. Which alternative payment platforms are gaining traction?
A. Buy Now Pay Later services, cryptocurrency payments, and peer-to-peer apps like Venmo are gaining strong adoption, especially among younger demographics.
6. How do fraud rates differ between payment types?
A. Fraud rates are highest for digital wallets at 1.4% of transaction volume. Credit cards see a 0.9% fraud rate, while fraud rates for debit cards are just 0.2%.
ABOUT AUTHOR

Kundan Goyal possesses a wealth of experience in Digital Marketing, offering valuable insights to businesses of all sizes. He actively contributes to industry-specific PR, news outlets, and forums, shaping discussions and driving forward-thinking strategies. Outside of work, HE enjoys carrom and has a deep passion for news editing and research. His strength lies in helping companies make informed, strategic decisions and predicting future trends. With his dedication and innovative approach, he is a versatile professional who brings a unique blend of skills and expertise to the ever-evolving digital landscape, enabling businesses to thrive in this dynamic environment.