The latest data on the Clover point-of-sale (POS) ecosystem signals a turning point for merchants, payment processors, and software providers alike. With real-world applications in both quick-service restaurants, upgrading checkout workflows, and independent retailers deploying cloud-enabled systems across multiple locations, Clover’s growth speaks to a broader shift in business operations. Let’s dive into the numbers and explore how this platform is shaping commerce.
Editor’s Choice
- Clover’s annualized gross payment volume (GPV) is approaching $300 billion in 2025.
- Revenue for Clover’s POS unit grew by 27% year-over-year in Q1 2025.
- Clover devices sold reached 4 million units as of mid-2025.
- Clover supports approximately 160,000 restaurant locations in the U.S., which represents an estimated 8% of the 730,000 total restaurants nationwide.
- Clover’s expansion into hospitality and multi-location food service segments via new devices (Kiosk, Flex 4) supports increased adoption.
Recent Developments
- In November 2024, Clover launched an all-in-one hardware and software solution targeting small service-industry businesses.
- Clover announced the upcoming availability of the Clover Flex 4 for U.S. merchants in November 2024.
- Clover hit the 4 million devices-sold milestone in mid-2025, the fastest pace yet.
- The parent company, Fiserv, reaffirmed its goal of $3.5 billion in Clover-unit revenue for 2025.
- Clover’s revenue growth is being driven not just by hardware sales but by increased value-added services and software subscriptions.
- The company is shifting focus away from micro-merchants toward small businesses that will adopt broader services (for example, not just payments but lending, analytics).
- Competitive pressure in the restaurant space is intensifying as Clover and competitors like Toast vie for a share of ~730,000 U.S. restaurant locations.
Global POS Software Market Growth Statistics
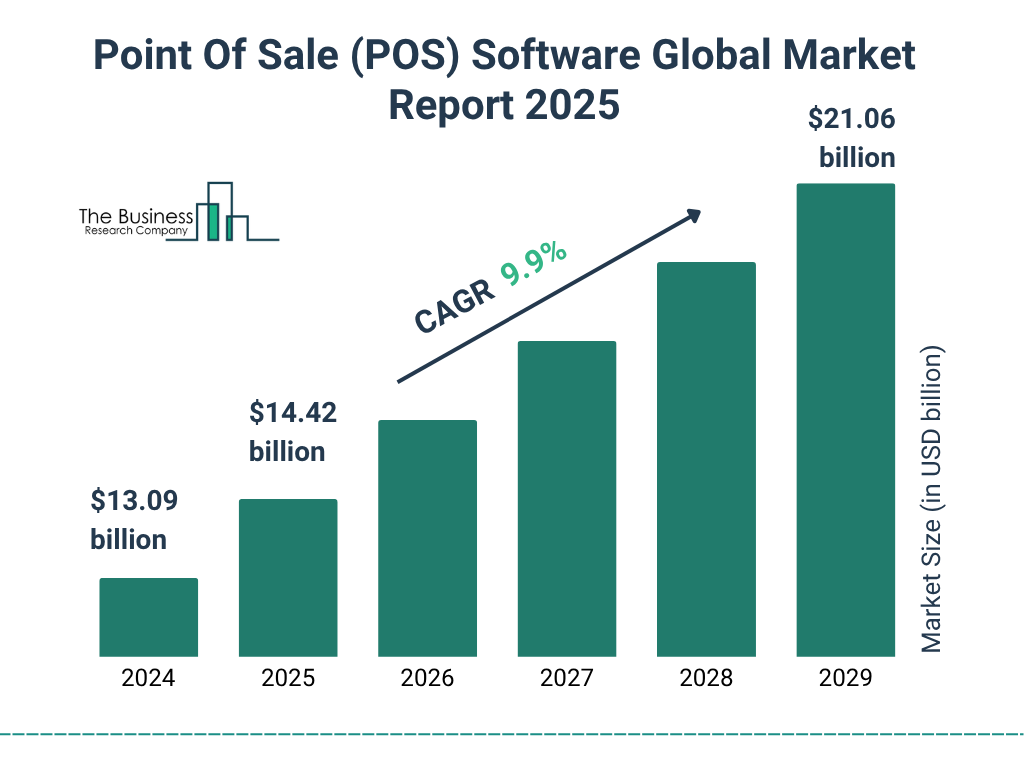
- The global Point of Sale (POS) software market is projected to reach $14.42 billion in 2025, marking steady year-over-year growth.
- Industry expansion continues through 2026–2028, with estimates nearing $19.16 billion as more merchants shift to cloud-based systems.
- By 2029, the POS software market is forecasted to hit $21.06 billion, driven by omnichannel integration and mobile POS solutions.
- The sector’s compound annual growth rate (CAGR) of 9.9% signals strong momentum and consistent global demand.
Employee and Workforce Statistics
- Clover had approximately 1,285 employees in 2025 as part of Fiserv’s merchant solutions division.
- Fiserv projects around 10%–12% organic growth in 2025, implying operational scaling for Clover.
- Clover’s parent company, Fiserv, reports Clover unit revenue growth of approximately 27% year-over-year.
- More than 700,000 businesses use Clover devices globally as of 2025.
- Industry data shows 72% of retailers are adopting cloud-based POS systems in 2025, increasing software and support workforce needs.
Restaurant POS Adoption Rates
- For the same segment, rival Toast holds ~130,000 locations (~18%) and ~16% of payment volume.
- Clover’s share of U.S. restaurant payment volume is circa 8%.
- Industry reports show that 83% of U.S. restaurants now use cloud-based POS systems in 2025.
- Self-service kiosk adoption within restaurants has the fastest growth rate in the terminal market (9.5% CAGR).
- Competitive pressures from entrenched providers like Micros and NCR Voyix show that newer entrants like Clover are gaining via newer feature sets.
- With more restaurants accepting mobile and contactless payments, vendor platforms such as Clover that support multiple payment types gain share.
Self-Order & Self-Pay Technology Usage
- The global self-service technologies market is projected to grow from $39.45 billion in 2024 to $41.96 billion in 2025, implying a ~6.4% CAGR.
- The global self-ordering kiosk market alone is expected to reach $37.2 billion in 2025, up from ~$34.4 billion in 2024.
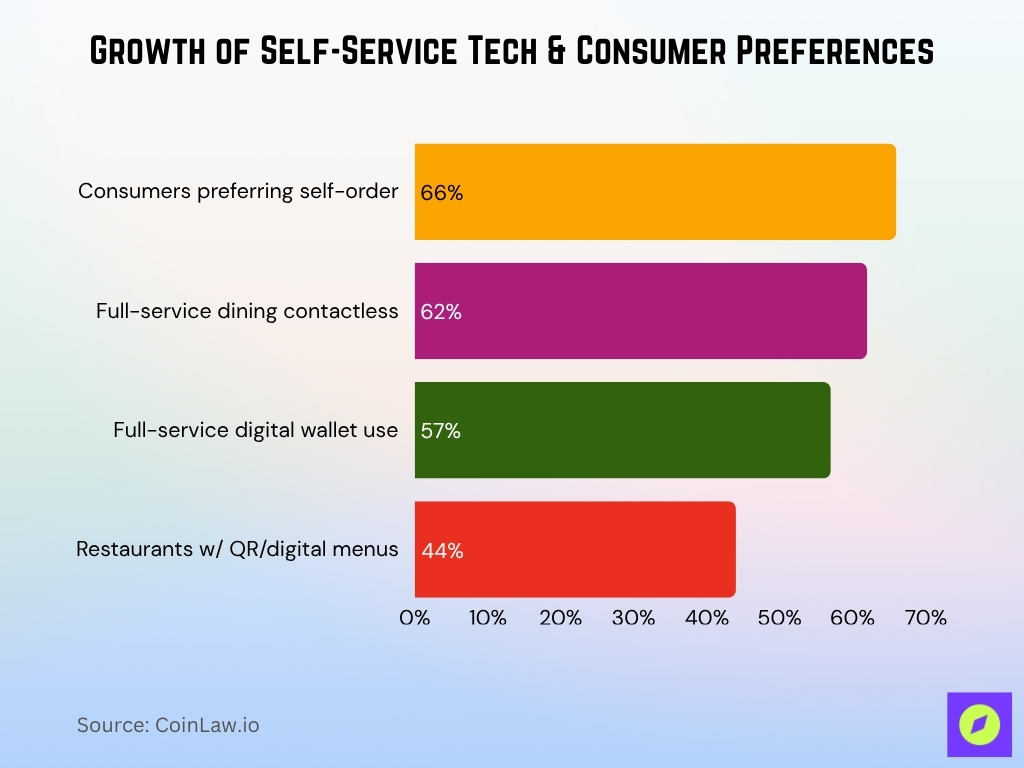
- More than 66% of consumers prefer self-service ordering over interacting with staff, especially in multi-location restaurants.
- In the full-service dining segment, 62% of customers said they would use contactless or mobile payment options, and 57% would use a digital wallet such as Google Pay or Apple Pay.
- The self-service payment kiosk market is forecast to grow at a CAGR of ~6.0% between 2024-2030.
- 44% of restaurants have added QR-code menus or digital self-order solutions to reduce labor costs.
Diversity and Inclusion Metrics
- 63% of restaurants offer a loyalty program, signaling broader transparency in operational data.
- Staff turnover in full-service restaurants averages around 26% with an average employee tenure of 110 days.
- 34% of restaurant staff cite wages as a reason for leaving or planning to leave a job, linking to workforce diversity and retention.
- Verticals such as restaurant and retail are encouraging inclusive hiring practices for technology installations, though documented percentages remain limited.
- Companies in the POS/hardware sectors increasingly include diversity metrics in annual reports, aligning with broader U.S. workforce trends.
- 68% of consumers in loyalty schemes say the brand better understands their buying preferences, indicating improved engagement across demographics.
- 83% of consumers say belonging to a loyalty program influences their decision to buy again, suggesting an inclusive program reach.
Software Features and Functionality
- 2025 trends include AI-driven insights, cloud-native architecture, omnichannel integration, and enhanced mobile device support.
- 41% of U.S. retailers upgraded to POS software with AI analytics and inventory tracking.
- 52% of chain retailers use multi-location management tools within POS software.
- Inventory tracking, CRM, and loyalty integration are key software features.
- 63% of restaurants offer a loyalty program integrated with POS software.
- POS platforms now routinely support digital wallet payments, remote ordering, and mobile apps.
- CRM, real-time reporting, and cloud analytics are considered standard POS software functions in 2025.
Hardware Options and Features
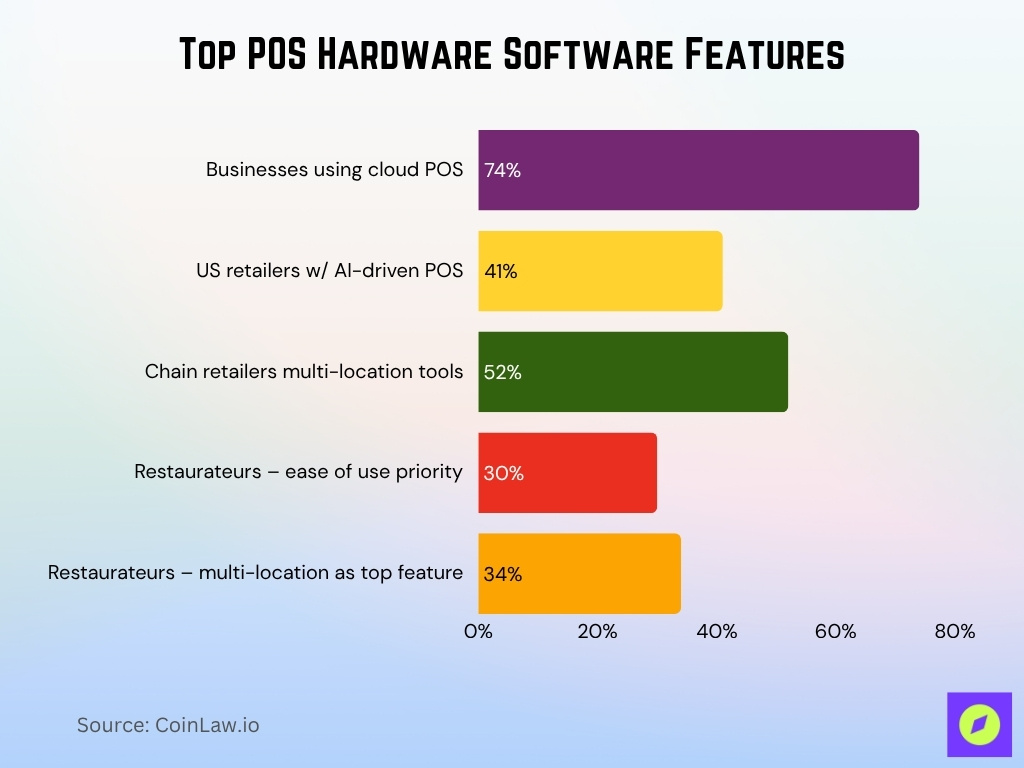
- 74% of businesses use cloud-based POS software, replacing on-premises hardware-dependent systems.
- 41% of U.S. retailers upgraded their POS software by 2025 to include AI-driven analytics and enhanced inventory tracking.
- 52% of chain retailers use multi-location management tools in 2025.
- Top hardware features include real-time stock tracking, automatic updates, and low-stock alerts.
- Growth in kiosk and self-order hardware and payment-terminal diversity supports flexible checkout options for merchants.
- 30% of restaurateurs say ease of use is the most important hardware or software factor in 2025.
- 34% of restaurateurs cite “multi-location management capabilities” as their most important POS feature, underscoring scalability.
Customer Loyalty Program Stats
- 78% of loyalty users are more likely to visit restaurants offering rewards programs.
- Loyalty program members generate 12-18% more revenue annually than non-members.
- 68% of customers feel loyalty programs improve personalization.
- 83% of consumers say belonging to a loyalty program influences repeat purchases.
- 68% of full-service restaurants and 71% of quick-service establishments now offer loyalty programs.
- 40% of diners would increase spending if part of a loyalty program.
- 73% of customers would recommend restaurants with strong loyalty programs.
- 47% of diners participate in at least one restaurant loyalty program.
Online Ordering Statistics
- On average, 22% of restaurant sales come from online ordering in 2025.
- 16% average sales increase occurs when restaurants add online ordering.
- 63% of consumers find delivery more convenient than dining out.
- 45% of consumers want mobile ordering or loyalty options to order more frequently.
- 87% of Americans using delivery apps say it simplifies their lives.
- Most restaurants use three online-ordering platforms in 2025.
- 44% of diners order take-out or delivery at least once a week.
- The average spend for take-out is $38, compared with $54 for dine-in.
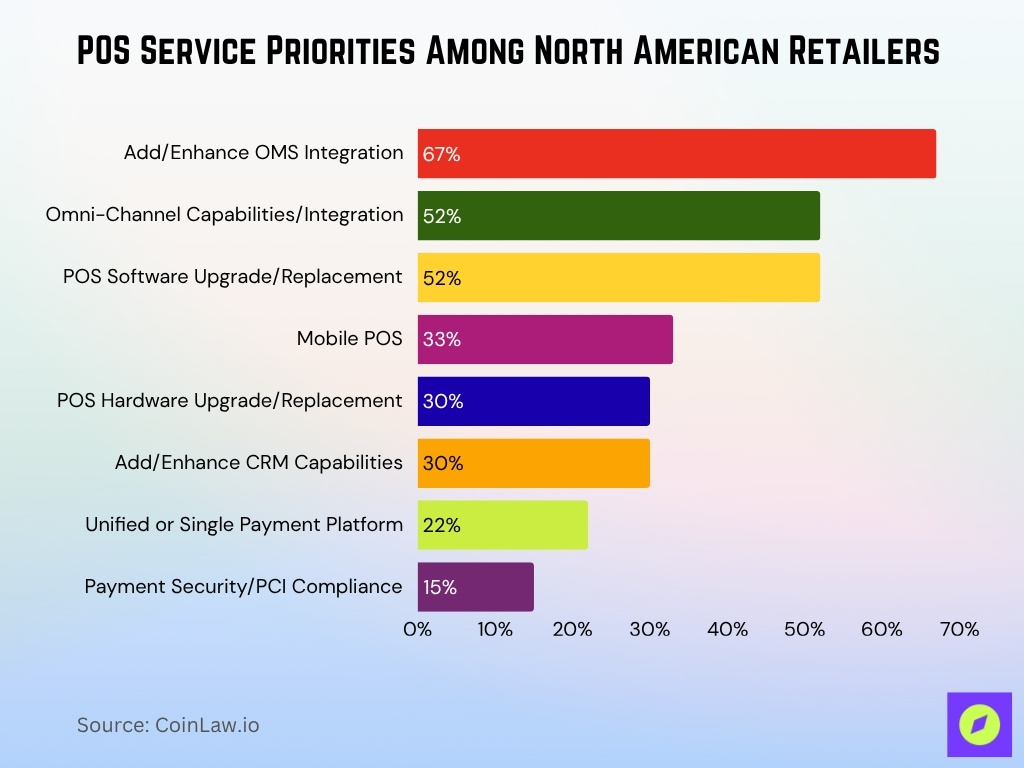
POS Service Priorities Among North American Retailers
- 67% of retailers prioritize adding or enhancing OMS (Order Management System) integration, reflecting the need for unified inventory and fulfillment tracking.
- 52% are focused on improving omni-channel capabilities, ensuring seamless integration between in-store, online, and mobile sales channels.
- 52% plan to upgrade or replace POS software, driven by the shift toward cloud-based and AI-powered solutions.
- 33% are investing in mobile POS systems to enable faster checkouts, curbside payments, and in-aisle sales support.
- 30% of retailers are upgrading POS hardware, aligning with the adoption of newer terminals and peripherals for better performance.
- 30% seek to add or enhance CRM capabilities, focusing on personalized promotions, loyalty programs, and customer data insights.
- 22% aim to implement a unified or single payment platform, simplifying operations across multiple payment channels.
- 15% place emphasis on payment security and PCI compliance, ensuring safer transactions amid rising cyber threats.
E-Commerce Usage Metrics
- U.S. e-commerce accounted for 16.2% of total retail sales in Q1 2025.
- In Q2 2025, U.S. e-commerce reached ~$304.2 billion, 16.3% of total retail.
- Smartphones made up 72% of U.S. e-commerce transactions in 2024.
- Amazon holds about 37.6% of the U.S. e-commerce market.
- 63% of consumers prefer engaging with brands on mobile devices.
- The average e-commerce conversion rate in 2025 is below 2%.
- Global e-commerce will represent 22.5% of all retail by 2028.
Inventory Management Statistics
- 77% of retailers plan real-time inventory visibility in 2025.
- North America holds 35.2% of the market.
- Retail and e-commerce account for 30.7% of total inventory software revenue.
- Real-time tracking and visibility are key 2025 trends.
- Cloud deployment dominates at 65.9% market share.
- Retail executives rank supply-chain efficiency as a top 2025 goal.
Rapid Deposit and MCA (Merchant Cash Advance) Usage
- The global MCA market is projected to reach $19.73 billion in 2025.
- MCA approval rates for qualified applicants reach ~91%.
- Over 99% of MCA users are small businesses.
- MCA funding is delivered within 24-48 hours, ensuring rapid deposits.
- The MCA market grows at a 6.9% CAGR through 2030.
- Businesses using rapid deposit features gain cash-flow and flexibility benefits.
- Instant deposit capabilities are emerging as competitive differentiators.
Customer Engagement Statistics
- 78% of loyalty program members are more likely to revisit a brand.
- Brands integrating omnichannel engagement see higher retention rates.
- The average e-commerce conversion rate remains under 2%.
- Mobile usage dominates consumer engagement journeys.
- Personalization and data-driven engagement are top retail priorities.
- 90%+ of retail executives cite omnichannel engagement as a key 2025 growth driver.
- Seamless checkout and loyalty integration have become core to engagement.
- Self-service ordering and digital payments boost engagement metrics.
Pricing and Fee Structures
- Integrated pricing models increased 5-8% year-over-year for merchants in 2025.
- Average POS hardware leasing costs $49-$59/month, with 2.3% + $0.10 per transaction fees.
- Self-order kiosks cost around $129/month, with software at $49-$79/month.
- MCA costs can exceed 35%-300% APR, depending on risk.
- Instant deposit surcharges average 0.25%-0.5% per transaction.
- Volume merchants processing over $1 million annually often receive software-fee discounts.
- Bundled models combine hardware, software, and payments at flat rates like $79/month + 1.75% per transaction.
Frequently Asked Questions (FAQs)
Approximately $300 billion.
About 4 million units
Starting at 2.3% + $0.10 per transaction for card-present payments.
Conclusion
In the dynamic commerce landscape, platforms like Clover are operating at the intersection of e-commerce growth, hardware and software innovation, and merchant service transformation. From the surge in online shopping and mobile transactions to the expansion of real-time inventory systems, rapid-deposit features, and merchant cash advances, the data show a clear shift toward integrated, flexible solutions. For merchants in retail, hospitality, and service sectors, understanding these statistics is critical for informed investment in POS and payments ecosystems. As we move forward, the challenge will be not just to adopt new tools but to use them strategically to drive engagement, unlock efficiency, and manage costs effectively.


