Billionaire wealth has reached new heights, reinforcing the gap between ultra-rich households and the rest of the population. In the U.S., that concentration plays out in political influence and capital markets; globally, it reshapes capital flows and philanthropic initiatives. Below you’ll find key stats and trends, then later we’ll dig deeper into gender, taxation, inequality, and more.
Editor’s Choice
- In 2025, 3,028 individuals globally are billionaires, up from 2,781 in 2024.
- Their combined net wealth is estimated at $16.1 trillion in 2025, rising by nearly $1.9 trillion year over year.
- The United States leads with 902 billionaires in 2025, compared to 813 in 2024.
- Among U.S. billionaires, total wealth reached an estimated $7.6 trillion by Labor Day 2025, up ~160% since 2017.
- In 2025, 464 billionaires derive their wealth from finance and investments, the largest single sector.
- Technology-created billionaires number 401 globally in 2025, making tech the second-most prolific industry for billionaire origins.
- Female billionaires still remain a small minority. As of April 2025, the U.S. hosted 120 women billionaires, which equated to 30.77% of all female billionaires globally.
Recent Developments
- From 2024 to 2025, the count of billionaires grew by 247 people (from 2,781 to 3,028).
- The net worth increase (~$1.9 trillion) in that same span is among the largest annual gains ever recorded.
- The U.S. added 89 new billionaires in 2025 (from 813 to 902).
- China and India remain the next largest hubs, though growth in India was more modest, with China (516) and India (205) as of 2025.
- In 2025, many countries saw inward billionaire migration, and wealth flowed especially toward the U.S. and the UAE.
- Charity and public scrutiny have increased; U.S. billionaires donated $241 billion by the end of 2024, up 14% from the prior year.
- However, that donation sum accounts for only ~15% of the combined U.S. billionaire wealth ($1.6 trillion).
- The debate over wealth taxes has intensified globally, including proposals like the “Zucman tax” in France aimed at taxing large fortunes over €100 million.
Sources of Billionaire Wealth
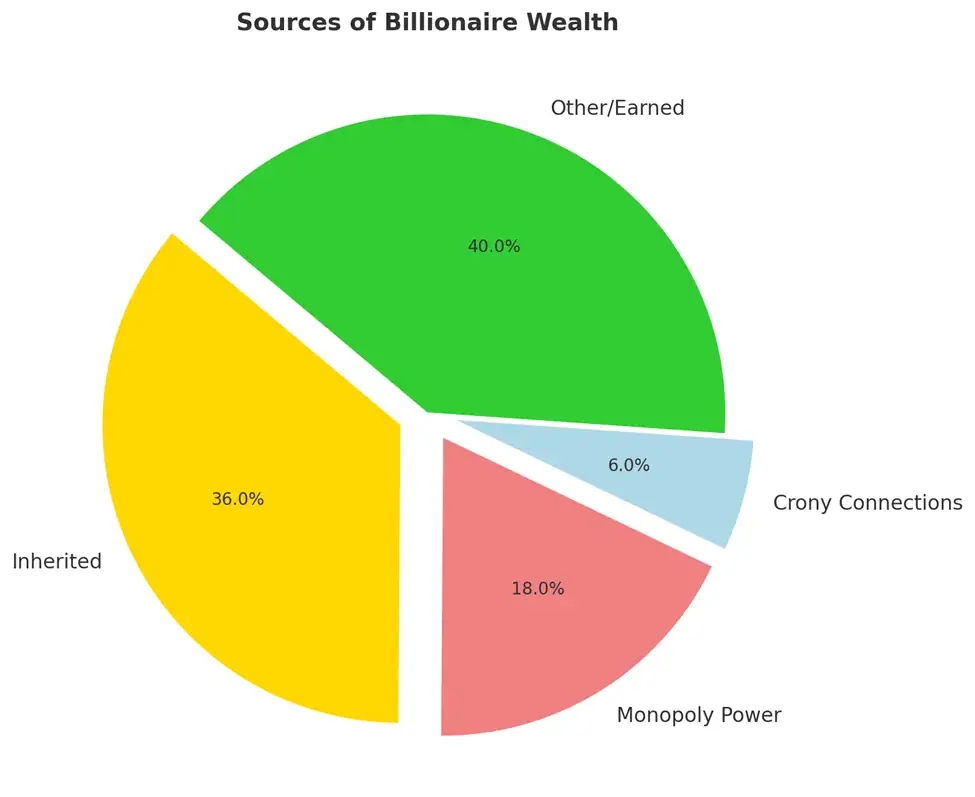
- 40% Other/Earned Wealth. The largest share of billionaire fortunes comes from entrepreneurial success, innovation, and business expansion rather than inheritance or privileged access.
- 36% Inherited Wealth. More than a third of billionaires built their status through family fortunes, showing how wealth concentration is passed down across generations.
- 18% Monopoly Power. Nearly one-fifth of billionaire wealth is linked to market dominance, pricing control, or industry consolidation that limits competition.
- 6% Crony Connections. A smaller but notable share arises from political ties, regulatory favoritism, or government-granted advantages.

Growth of Billionaire Wealth Over Time
- From 2024’s $14.2 trillion to 2025’s $16.1 trillion, billionaire wealth rose ~13.4% year over year.
- Over the past decade, billionaire wealth surged by roughly $6.5 trillion, per Oxfam or related analyses.
- In 2024, there were 2,781 billionaires, so the growth in numbers (to 3,028) over the decade suggests a steady upward trend.
- Between 2021 and 2025, the count of billionaires rose from ~2,755 to 3,028.
- The average net worth per billionaire has increased, though distribution remains heavily top-skewed (e.g., a few centibillionaires pull the mean upward).
- Billionaire wealth growth has frequently outpaced GDP growth in major economies, particularly in the U.S.
- Market rallies, especially in tech and financial sectors, have amplified gains for top-tier billionaires in the past 5 years.
- Tax law changes (e.g., in the U.S. starting 2017) correlate with surges in untaxed wealth accumulation by the ultra-rich.
Billionaire Wealth Share vs. Other Wealth Groups
- Billionaires (3,028 individuals) collectively hold $16.1 trillion, a sum rivaling the GDPs of mid-sized nations.
- American billionaires alone amassed $7.6 trillion by mid-2025, a concentration that exceeds many national sovereign wealth funds.
- Based on modeling by economists and policy groups, up to 56% of U.S. billionaire wealth gains since 2017 may remain untaxed under current law due to unrealized capital gains and tax deferrals.
- A few centibillionaires (those worth over $100 billion) disproportionately influence aggregate totals.
- The richest 1% globally hold a share of financial assets that dwarfs much of the bottom 50% in many countries.
- Studies suggest that billionaire wealth concentration accelerates the extraction of capital gains and favorable tax treatment compared to middle and upper-middle wealth brackets.
- Wealth inequality indices (Gini, top 1% share) shift noticeably upward when billionaire fortunes are included in national wealth tallies.
- In many developed markets, billionaire holdings rival or exceed pension fund assets, public debt, or sovereign wealth reserve sizes.
Billionaire Wealth by Sector
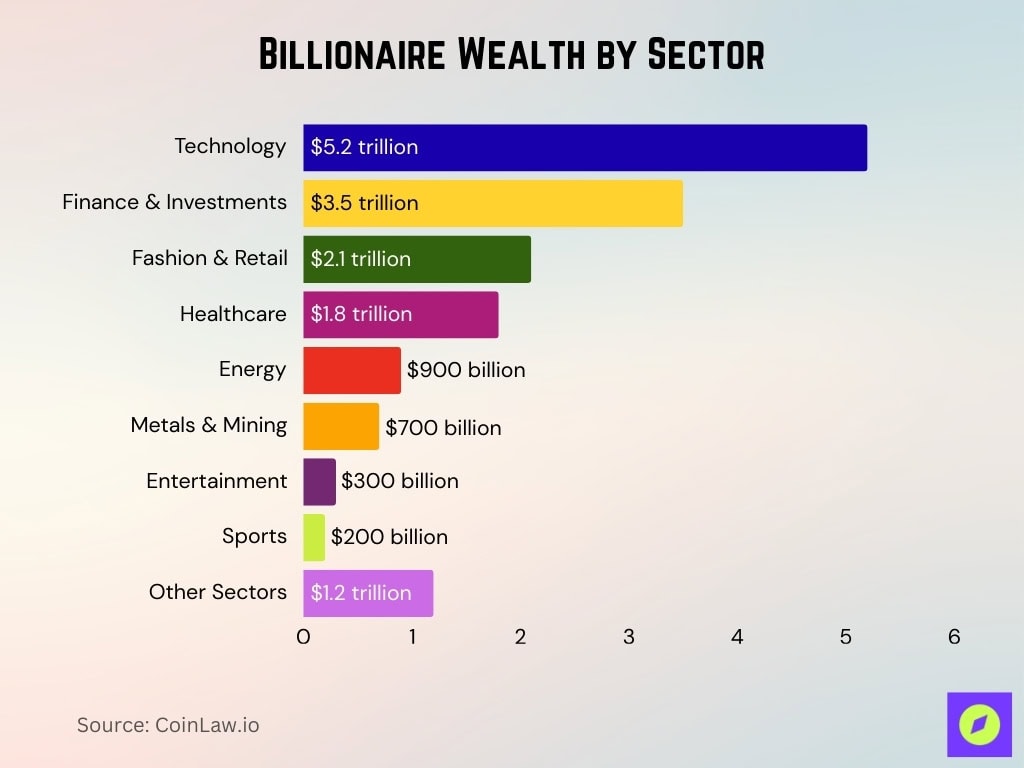
- Technology leads with $5.2 trillion (32%). This is the single largest sector, showing how innovation and digital platforms dominate billionaire fortunes.
- Finance & Investments account for $3.5 trillion (22%). Banking, private equity, and hedge funds remain core engines of ultra-wealth accumulation.
- Fashion & Retail contributes $2.1 trillion (13%). Global luxury brands, consumer goods, and retail empires continue to create some of the wealthiest dynasties.
- Healthcare holds $1.8 trillion (11%). Pharmaceutical giants, biotech breakthroughs, and healthcare services fuel billionaire growth.
- Energy generates $900 billion (6%). Oil, gas, and renewable energy billionaires still command vast resources.
- Metals & Mining adds $700 billion (4%). Resource extraction and commodity exports remain traditional pathways to extreme wealth.
- Entertainment is worth $300 billion (2%). Billionaires in film, media, and music illustrate the global power of cultural industries.
- Sports contribute $200 billion (1%). Ownership of teams, endorsements, and sports businesses makes this the smallest but fastest-growing sector.
- Other sectors total $1.2 trillion (7%). Diverse industries such as real estate, telecom, and logistics round out billionaire wealth.

By Country
- The U.S. leads with 902 billionaires in 2025 (up from 813 in 2024).
- China (including Hong Kong) ranked second, with 516 billionaires in 2025.
- India holds 205 billionaires in 2025, placing it third globally.
- Among cities, New York, London, Shanghai, Beijing, and Mumbai lead in the concentration of billionaire residences.
- The top 5 countries hold over 50% of global billionaires (the U.S., China, India, the UK, and Germany).
- Some tax-friendly jurisdictions and wealth havens see net inflows of ultra-rich individuals.
- Countries with smaller populations but favorable business climates punch above their weight in per-capita billionaire counts (e.g., Monaco, Singapore).
- Emerging markets are gradually increasing their share of billionaires, especially in Asia, Latin America, and the Middle East.
- National regulatory shifts (capital controls, tax policy) influence which countries attract or lose billionaire residents.
By Gender
- As of 2025, 86.5% of billionaires are men, and only 13.5% (≈ 390 individuals) are women.
- The 2025 Forbes list counts 406 women among 3,028 billionaires (≈ 13.4%).
- The top 10 richest women control $477.7 billion, about 24% of all female billionaire wealth.
- Seven of those top 10 women are from the U.S., the rest hail from France, Switzerland, and India.
- Women billionaires tend to appear more in consumer goods, beauty, and investments, rather than heavy industry or energy sectors.
- The gender gap in billionaire numbers has narrowed only slowly over the past decade.
- In 2025, the U.S. hosts a large share of female billionaires; some reports cite 124 U.S. women billionaires.
- Among women billionaires, the balance between inherited and self-made wealth is notably skewed (explored further below).
Inherited vs. Self-Made Billionaire Wealth
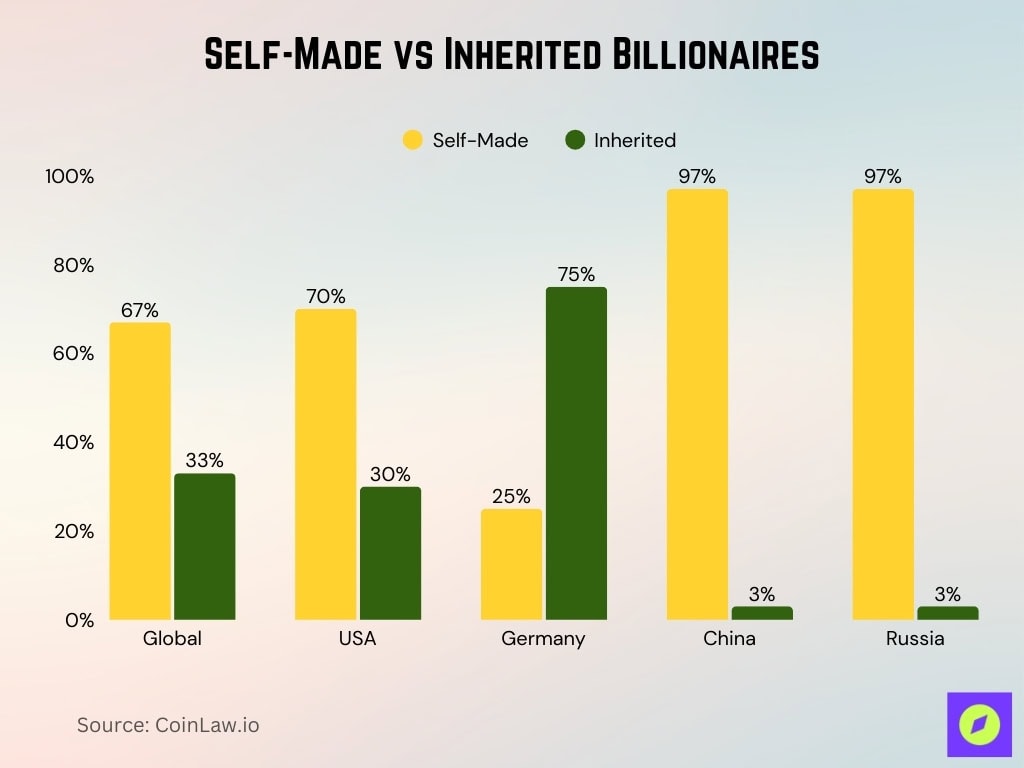
- In mid-2025, 67% of billionaires globally are classified as self-made, 33% inherited their wealth.
- In the U.S., about 70% of billionaires are self-made.
- The trend toward inheritance is growing; some reports suggest that among new billionaires in recent years, a larger share of wealth comes via inheritance than entrepreneurship.
- In Germany, only ~25% of billionaires are self-made; the rest are heirs or part-heirs.
- In Russia and China, self-made routes dominate with estimates reaching ~97%.
- Inherited billionaires tend to allocate more to private equity and legacy holdings, self-made more to enterprises and innovation.
- Over time, multigenerational wealth transfer will likely increase the share of inherited wealth in the billionaire class.
- For women, inherited share is even higher, as noted earlier, a greater proportion of female billionaires inherit their wealth relative to their male peers.

Female Billionaires: Distribution and Trends
- Roughly 38% of female billionaires inherited their fortunes entirely.
- Compared to men, female billionaires more often combine inheritance and entrepreneurship; about 75% of female billionaires have at least part of their wealth inherited.
- Only 113 women among the 406 female billionaires in 2025 are self-made (≈ 28%).
- A smaller share of women reach decibillionaire status (tens of billions) compared to men.
- Women in tech, 25 female billionaires in the U.S. tech sector, reached self-made status as of 2025.
- Alice Walton leads as the wealthiest woman (≈ $112.5 billion in 2025).
- Female billionaire growth has remained slower than male growth in recent years, widening the wealth delta.
- In emerging markets, female billionaire representation remains especially low, and cultural and institutional barriers persist.
Migration Trends
- In 2025, an estimated 142,000 millionaires (not all billionaires) are projected to relocate globally, the largest voluntary private capital transfer on record.
- The UK is losing wealthy residents rapidly, with 16,500 millionaires expected to depart in 2025.
- The UAE is among the top gainers in net inflows of global wealth.
- Net HNWI (High Net Worth Individual) migration rates globally hover around 0.2% annually, indicating movement is limited in scale.
- Many migration decisions hinge on tax treatment, residency rules, citizenship rights, and investment incentives.
- Tax-avoidance flags, like favorable inheritance or exit tax regimes, influence relocation.
- The wealthy tend to stay linked to their home networks; migration is costly in social capital and business ties.
- Some jurisdictions actively court billionaires with “golden visas” or favorable laws (e.g., Portugal, UAE, Singapore).
- Migration of billionaires often lags broader millionaire trends, due to higher stakes, real estate costs, and social anchoring.
Driven by Asset Classes
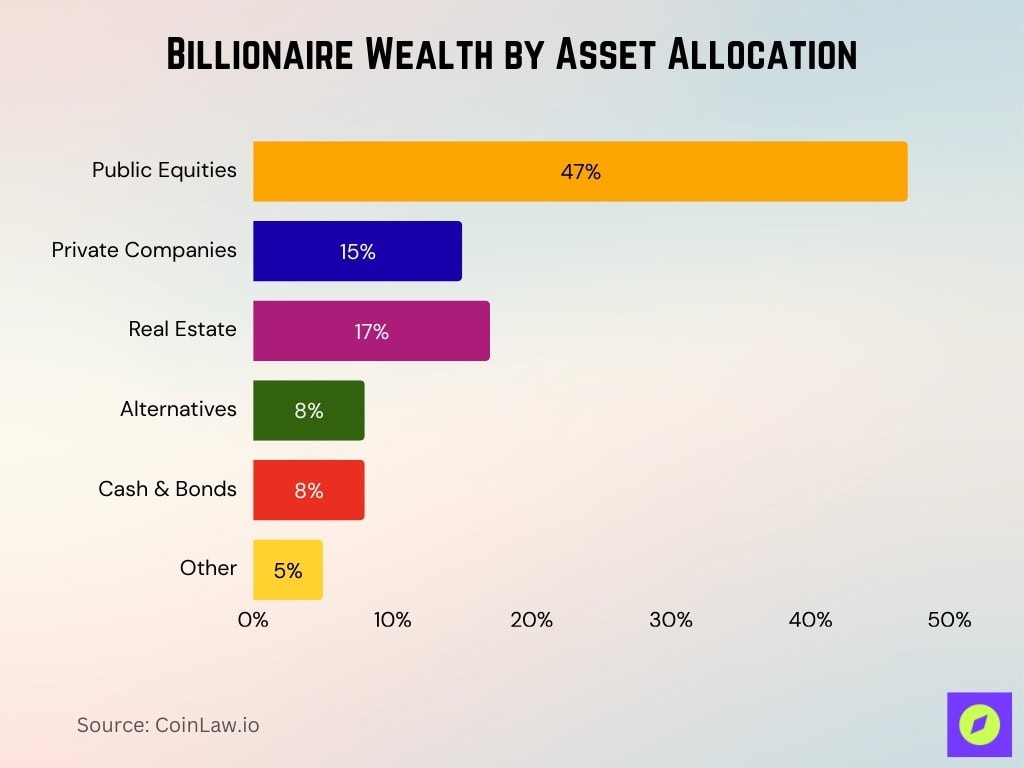
- Among high-net-worth individuals, typical allocations in 2025 are 47% public equities, 15% private companies, 17% real estate, 8% alternatives, 8% cash & bonds, and 5% other financial products.

- Billionaires show a strong tilt to private equity and private companies compared to public markets.
- Real estate remains a stable pillar, often as land, commercial, or development holdings.
- Alternative investments (hedge funds, art, collectibles) form a minority but growing class in ultra-wealthy portfolios.
- There is increasing interest in infrastructure, venture capital, and climate/impact assets.
- Wealthy families are shifting away from pure public stock allocations into private markets and direct investments.
- Some billionaires maintain significant stakes in operating firms (e.g., tech, oil, industrial).
- Allocation strategies tend to vary by generation; older ones lean more into real estate and dividend assets, younger ones favor growth and private ventures.
Billionaire Wealth and Taxation Patterns
- Among the U.S. “top 400” wealthiest individuals, the effective tax rate declined from ~30% (2010–2017) to ~23.8% (2018–2020).
- In that same group, individual income taxes contribute only ~11% of their economic income, while corporate taxes account for ~9 percentage points of total effective tax burden.
- Estate and gift taxes paid by the Forbes 400 bracket account for just 0.03%–0.04% of their total wealth annually.
- Charitable contributions by the top 400 average about 0.6% of their wealth and ~11% of economic income in the 2018–2020 period.
- According to Americans for Tax Fairness, U.S. billionaires held $7.6 trillion as of Labor Day 2025. Of the gains since 2017, roughly 56% ($4.2 trillion) may never be taxed under current law.
- Some proposals for 2025 would impose a minimum tax on households above $100 million, pushing that average rate from ~8.2% up to ~25%.
- A global minimum wealth tax (e.g., a 2% floor) could generate revenue equivalent to ~0.22% of global GDP in 2025.
- Critics argue that current proposals (e.g, 2%) won’t meaningfully slow concentration, given billionaire wealth often grows at 7%–9% annually.
- In France, the “Zucman tax” has stirred controversy; a 2% annual tax on wealth above €100 million has been proposed to address unequal tax burdens.
Impact of Billionaires on Wealth Inequality
- Since 2015, the world’s richest 1% have gained $33.9 trillion, while billionaires alone added $6.5 trillion.
- In many countries, including the U.S., inclusion of billionaire wealth meaningfully shifts the top 1% share upward by 2–5 percentage points.
- According to Oxfam, in 2024, billionaire wealth grew by ~$2 trillion, three times faster than in previous years.
- Wealth concentration increases the Gini coefficient and skews Lorenz curves, rendering the lower half of the population ever more distant from the median wealth.
- Some models show that without redistribution or social protection, wealth may “condense” into very few hands in long-term dynamics.
- Increasing billionaire dominance correlates negatively with social mobility and limits the ability of younger or less advantaged cohorts to accumulate wealth.
- In economies with weak taxation and weak redistribution, the presence of billionaires accelerates inequality growth exponentially, not linearly.
- During the COVID-19 pandemic, wealth reconcentration favored heirs disproportionately, accelerating inequality among ultra-rich families.
Wealth Distribution in Developed Markets
- In the U.S., billionaire wealth often rivals or exceeds major institutional assets like pension funds or sovereign wealth funds.
- In many European markets, billionaire holdings are strongly correlated with bank shares, real estate, and legacy industrial assets.
- Among developed economies, the per capita billionaire density is highest in the U.S., Switzerland, and Singapore.
- The inclusion of billionaire wealth in national wealth measurements tends to push the top 0.1% wealth shares several points higher.
- In Japan and parts of Western Europe, the growth of new billionaire entrants is muted; many billionaires are inherited or long-standing.
- Developed-market regulation (e.g., emigration tax, property wealth tax) influences how stable billionaire populations are.
- In some nations, large portions of billionaire portfolios are invested in domestic infrastructure or public/private partnerships, tying their fortunes to national economic performance.
- During financial downturns, given their diversified and global holdings, billionaires often recover faster than the average high-net-worth individual.
Methodologies for Measuring Billionaire Wealth Distribution
- Researchers combine Forbes / real-time billionaire lists with national accounts and tax data to calibrate total billionaire wealth.
- Some methods use extrapolation from top deciles (e.g., top 0.01%), then infer scaling to billionaire level.
- Capitalization of known holdings is common, public stock positions, real estate portfolios, stakes in private firms, etc.
- Imputed valuations are used for illiquid assets (private equity, art, land), often based on multiples or comparable sales.
- Correction factors adjust for underreporting, tax sheltering, and hidden offshore assets.
- Effective tax rate studies often compare economic income vs taxable income, revealing gaps.
- Estate and gift tax records may provide insight, but often capture only a fraction of wealth transfers.
- Criticism, many methodologies undercount invisible assets or undervalue intangible ownership (e.g., royalties).
Frequently Asked Questions (FAQs)
~3,028 billionaires globally with a total net worth of $16.1 trillion.
The United States led with 902 billionaires.
In 2025, 464 billionaires came from finance/investments and 401 from technology, making those the two largest source sectors
There were 406 female billionaires, making up about 13.4% of the total billionaire population.
Conclusion
The world’s approximately 3,028 billionaires control vast and fast-growing wealth, much of it taxed at lower effective rates than common perception suggests. Their dominance not only reshapes inequality metrics but also influences political power, capital markets, and national policies. Measuring that influence demands careful methodology, but the trends are clear: reform conversations around taxation, redistribution, and regulatory design have never been more urgent. Explore the full article to see how gender, country dynamics, wealth origin, and global migration all tie into this evolving billionaire landscape.


