Polkadot has emerged as a foundational blockchain ecosystem, securing interoperability and scalability across multiple chains. Its design reduces friction for developers building decentralized apps and enhances cross-chain communication. In finance, Polkadot is used as collateral in staking and parachain auctions, while supply‑chain platforms rely on its secure messaging layer. Let’s unpack the data behind its evolving metrics and dig into what’s shaping its market and why it matters.
Editor’s Choice
- DOT trading around $3.86, hovering in the current mid‑$3s.
- Market cap near $5.9 billion, placing Polkadot in the top 40 global cryptocurrencies.
- Daily trading volume is roughly $260–$280 million, showing solid liquidity.
- Circulating supply: 1.6 billion DOT.
- Analysts at CoinCodex project DOT’s average price in 2025 at approximately $4.90, with potential highs up to $5.30 based on algorithmic models.
- Exchanges like Binance and Kraken account for over 40% of unique addresses and over 80% of total transactional volume on Polkadot, indicating substantial centralization in network activity.”
- The upcoming Polkadot 2.0 architecture introduces agile coretime and faster execution, while Acala’s Sinai upgrade brings Layer 1 DeFi enhancements, both highlighted by developers as catalysts for ecosystem expansion.
Recent Developments
- Polkadot launched an institutional division, Polkadot Capital Group, to attract traditional finance firms.
- The Acala network Sinai upgrade enhanced functionality and security for DeFi use cases.
- In the roadmap toward Polkadot 2.0, parachains shift from owning execution cores to reserving blockspace via a dynamic marketplace model.
- Governance evolved via OpenGov, with community‑managed decision-making.
- Kusama achieved 143,000 transactions per second during internal testing conducted by Parity Technologies, operating at approximately 23% of its capacity.
- Approval‑based governance studies show thousands of candidates and weighted voters in elections.
- On-chain analytics indicate that roughly 80% of Polkadot network transactions are facilitated through exchange-linked addresses, reflecting a trend of transactional centralization.
- Architectural analysis highlights Polkadot’s shared‑security and interoperability model supporting parachains.
Number of Active Accounts
- The Relay Chain and ecosystem-wide share: Polkadot Chain 48.8%, Moonbeam 21.4%, peaq 11.3%.
- Unique Network had 44,000 active addresses (8.3%).
- Hydration counted 13,700 accounts (2.6%).
- Acala’s active addresses reached 13,300 (2.5%).
- Nodle recorded 6,500 active accounts (1.2%).
- Bifrost had 4,300 active addresses, approximately 0.8%.

Polkadot Price Trends
- Current DOT price: $3.86, fluctuating in the mid-$3 range.
- 24‑hour range spans roughly $3.82 to $3.92, indicating low volatility.
- Weekly decline is modest, around 0.9% over the last 7 days.
- On Kraken, the price sits at $3.86, with a –0.23% change in the past 24 hours.
- End‑August mid‑$3s, with recent history dipping slightly below $4.
- DOT prices in 2025 range from $4.74 to $5.30, based on historical volatility models and technical indicators.
- The August 2025 price is projected between $3.91, showing limited upside.
- Seasonality: steady growth from mid‑$3 to mid‑$4 as 2025 progresses.
Market Capitalization Statistics
- Market cap around $5.9 billion, ranking Polkadot around #35 globally.
- $5.88B to $5.94B, depending on supply estimates.
- Market cap derives from multiplying the mid‑$3.8 price by 1.52–1.6 billion supply.
- Fully diluted valuation aligns at similar figures, given an unlimited max supply.
- Market dominance remains modest, below 0.5% of aggregate crypto assets.
- Market cap shows minimal fluctuation daily, reflecting a stable supply and modest price movement.
- The estimated circulating supply of 1.6 billion DOT gives a clear base for cap calculations.
- Growth tied to broader price and staking inflation trends rather than supply spikes.
Polkadot Chain Transaction Fee Statistics
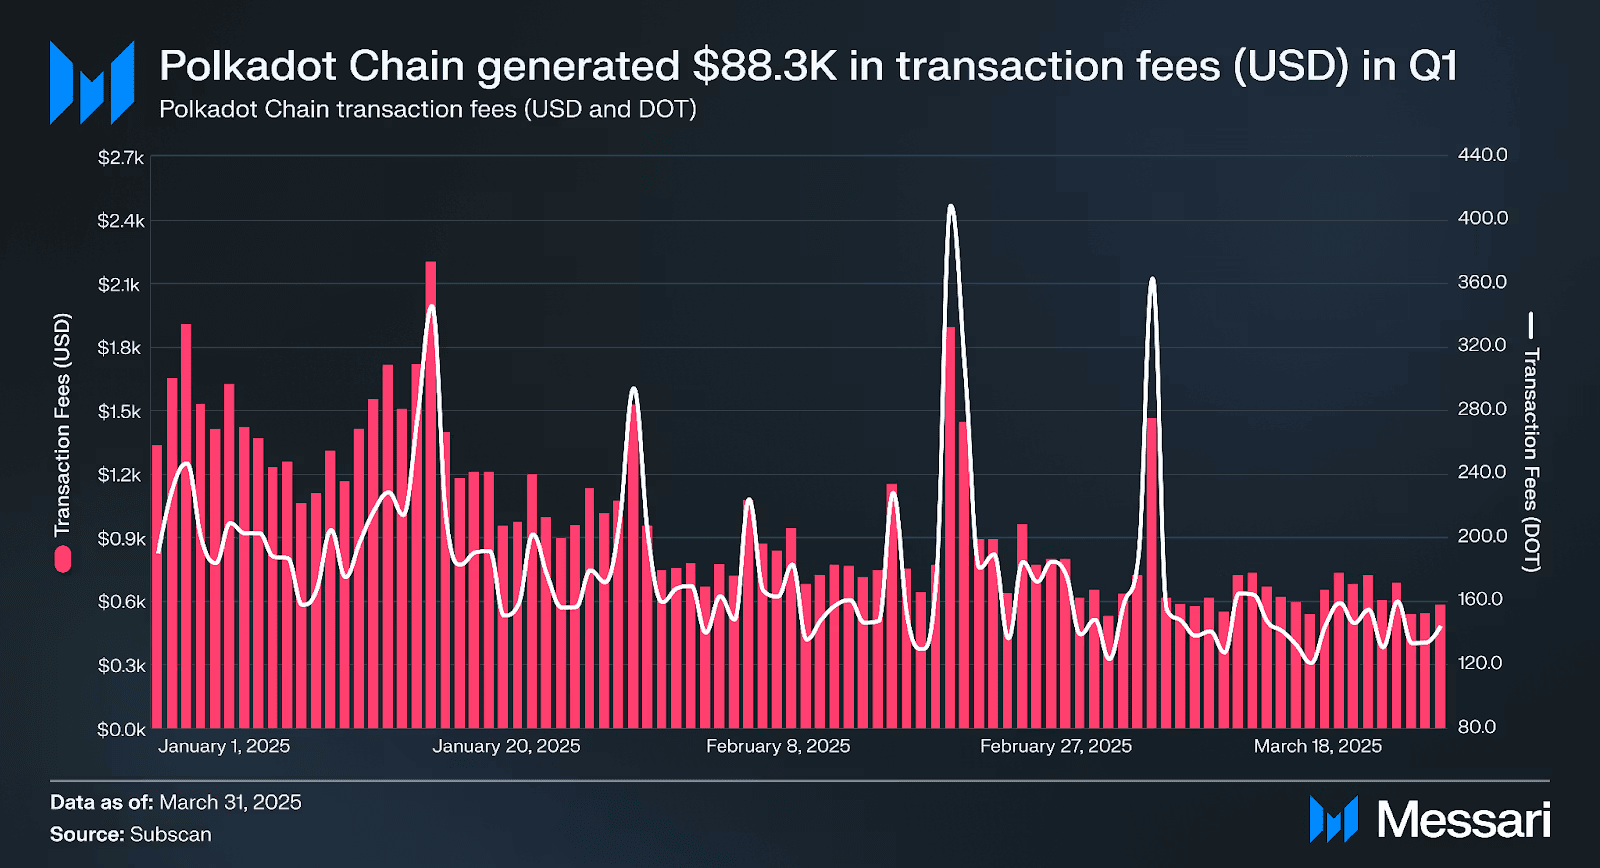
- Polkadot generated a total of $88.3K in transaction fees during Q1 2025, highlighting continued usage and relay chain demand.
- The peak transaction fee day occurred around February 27, reaching nearly $2,500 and over 400 DOT in fees.
- Additional major spikes were recorded on:
- January 16, with over $2,200 in fees.
- February 2, with approximately $2,100 in fees.
- Daily fees in January regularly hovered between $1,200 $1,800, showing sustained throughput in early Q1.
- In March, transaction fees dropped slightly, averaging around $800 to $1,200 per day.
- The white line in the chart tracks fees paid in DOT, reflecting user demand despite price fluctuations.
- These metrics underscore active economic activity on the Polkadot Relay Chain and the importance of low-cost scalability in Q1 2025.
DOT Supply and Circulation
- Circulating supply: 1.6 billion DOT.
- Supply numbers vary slightly: 1.52B to 1.61B.
- No fixed maximum supply, Polkadot inflates at 10% annually.
- Fully diluted market cap mirrors current values, as supply remains uncapped.
- Supply consistency end‑2024 was stable, barring staking‑driven changes.
- Token release mechanisms align with staking rewards and network inflation.
- Supply transparency is maintained through explorers like Subscan.
- Supply serves as a key input when projecting price and cap metrics.
Trading Volume Data
- 24‑hour volume: $260M to $280M, reflecting healthy liquidity.
- $262.8 million, with an 8.8% daily increase.
- $263.47 million, with a slight dip yesterday.
- $262.75 million in volume, with over 68M DOT traded in 24h.
- Trading activity stays around 4–5% of market cap daily, typical for mainchain tokens.
- Volume spikes often follow news like institutional developments or technical upgrades.
- Volume stability supports modest price swings and investor confidence.
- Active exchange participation drives most trading dynamics observed.
Top Polkadot Ecosystem Projects by Social Activity
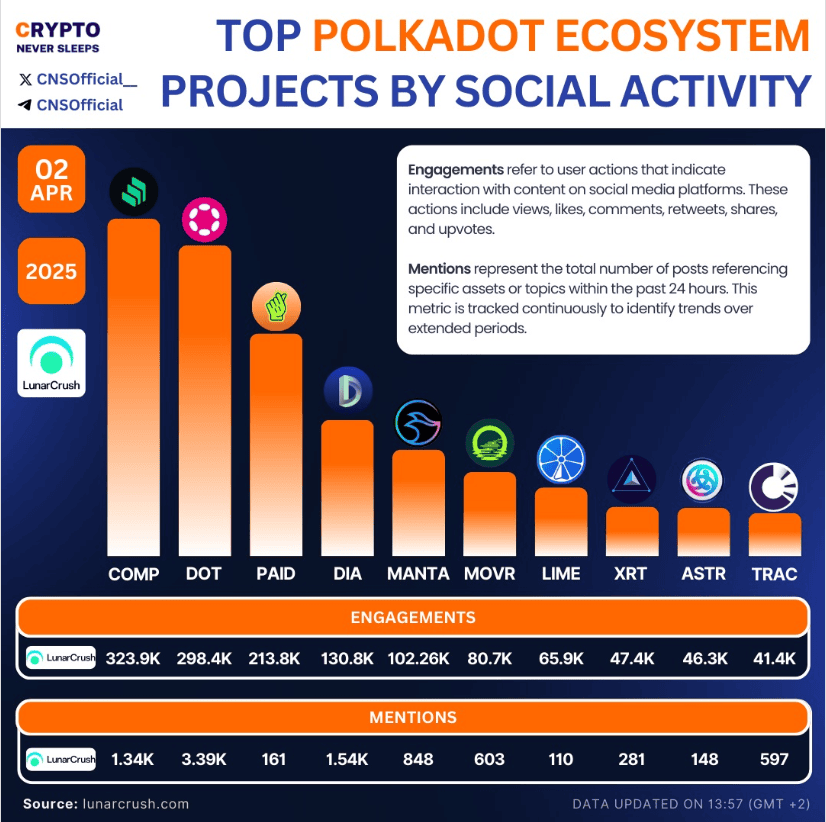
- COMP led the ecosystem with 323.9K engagements and 1.34K mentions, indicating high visibility and consistent community interaction.
- DOT (Polkadot’s native token) followed closely with 298.4K engagements and the highest mention count at 3.39K posts in 24 hours.
- PAID Network ranked third by engagements with 213.8K, though mentions were relatively low at 161.
- DIA showed balanced traction with 130.8K engagements and 1.54K mentions, outperforming higher-ranked peers in discussion volume.
- MANTA registered 102.2K engagements and 848 mentions, showing steady growth in social visibility.
- Moonriver (MOVR) followed with 80.7K engagements and 603 mentions, signaling moderate but consistent interest.
- LIME saw 65.9K engagements but only 110 mentions, suggesting engagement without corresponding discussion volume.
- XRT (Robonomics) and ASTR (Astar) recorded 47.4K and 46.3K engagements, respectively, with 281 and 148 mentions.
- TRAC (OriginTrail) rounded out the list with 41.4K engagements and 597 mentions, showing relatively strong discussion for its engagement rank.
Network Transaction Statistics
- The Polkadot ecosystem processed 137.1 million transactions in Q1 2025, a 36.9% QoQ decline, yet a 76.3% increase YoY.
- The core Relay Chain handled about 10.3 million transactions, down 25.1% QoQ.
- Moonbeam led with 16.7 million transactions, up 6.5% QoQ, accounting for 12.2% of ecosystem traffic.
- Mythos recorded 12.3 million transactions, up 12% QoQ, comprising 9% of total usage.
- peaq surged 84% QoQ to 10.1 million transactions, or 7.4% of volume.
- Frequency topped the chart with 26.8 million transactions (19.5%).
- Phala logged 15.1 million transactions, representing 11% of activity.
- Energy Web X (11.4M), NeuroWeb (9.2M), and Litentry (8.8M) each contributed roughly 6–8% of ecosystem throughput.
Staking and Validator Statistics
- Active validators on Polkadot climbed from 500 to 600 in Q1 2025.
- Total DOT staked increased 7.9% QoQ, reaching 843.9 million DOT.
- Stakeholders contribute to both security and OpenGov participation.
- Minimum staking requirement for nominators is 250 DOT; for pools, just 1 DOT.
- Unstaking period remains 28 days, aligning with the network protocol.
- Rewards must be claimed within 84 days or they expire.
- Liquid staking enables stakers to keep liquidity while earning rewards.
- Only the top 256 delegators per validator earn staking rewards.
- Polkadot 2.0 includes planned improvements to consensus and transaction throughput, potentially reducing block times from 12 seconds to 6 seconds, as outlined in core developer proposals.
Polkadot Treasury Expenses Breakdown
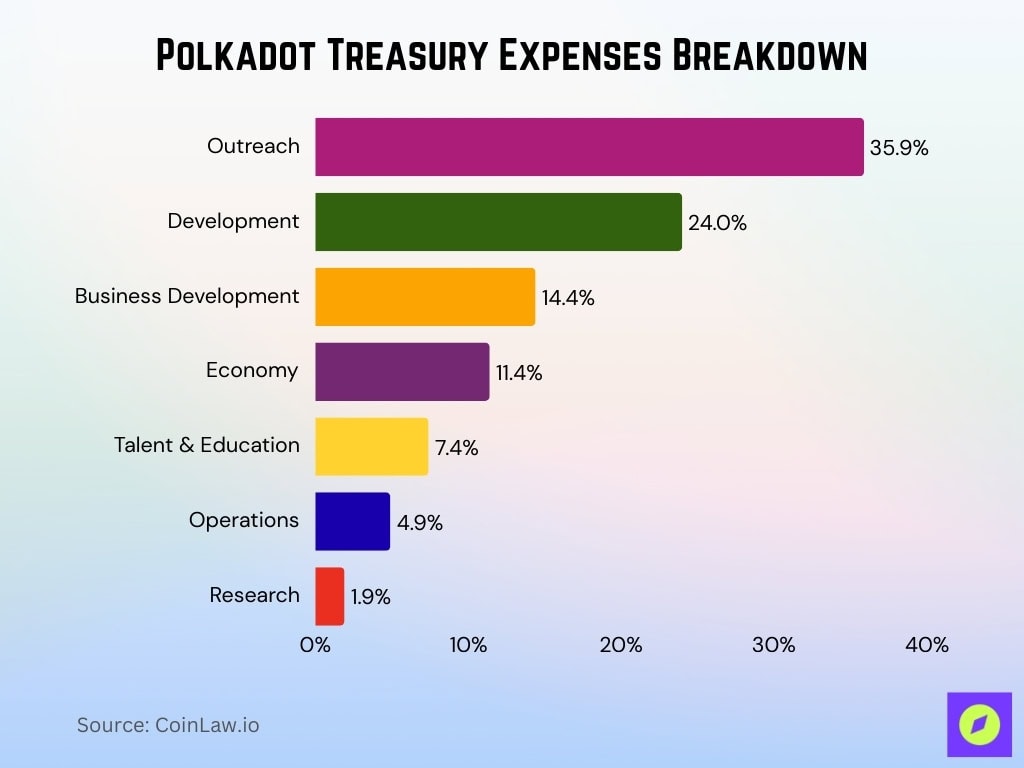
- Outreach received the largest share of treasury spending at 35.9%, emphasizing strong efforts in marketing, awareness, and community engagement.
- Development accounted for 24.0%, highlighting Polkadot’s ongoing investment in building and maintaining its core infrastructure and tooling.
- Business Development consumed 14.4% of the treasury, supporting partnerships, ecosystem growth, and commercial strategy.
- Economy-related initiatives represented 11.4% of spending, including financial system enhancements and tokenomics improvements.
- Talent & Education made up 7.4%, showing Polkadot’s focus on developer onboarding, training programs, and educational outreach.
- Operations took 4.9%, covering backend, coordination, and administrative needs.
- Research was allocated the smallest portion at 1.9%, reflecting leaner but targeted funding for long-term innovation.
On‑Chain Governance Metrics
- Referenda dropped 22.2% QoQ to a total of 221 proposals in Q1 2025.
- Participation fell, delegated voters dropped 7.1%, and direct voters declined 28.8%.
- Notable referenda included:
- Reimbursement of 1.04 million USDT to Novasama for Nova Wallet.
- 495,030 DOT allocated to fund a partnership with G2 Esports.
- Bridge transfer fees reduced, from 6.12 DOT to 1.49 DOT.
- Polkadot V1.4 upgrade scheduled for Feb 26, 2025.
- Governance operates under OpenGov using the Phragmén election method.
- Approval-based voting involves around 1,000 candidates and tens of thousands of weighted voters.
Relay Chain Performance Metrics
- Relay Chain recorded 10.3 million transactions in Q1 2025, down 25.1% QoQ.
- Cross-chain messaging via XCM enables sub-minute transfers and asset movements across parachains.
- Kusama’s stress test proved scalability with 143,000 TPS at just 23% capacity.
- Average Relay Chain usage at 230,000 monthly DOT transactions.
Parachain Slot Auction Data
- Polkadot has completed 20 parachain slot auctions to date.
- These auctions attracted 180,828 crowdloan participants contributing DOT toward slot bids.
- A total of approximately 131.37 million DOT has been raised via crowdloans.
- Each parachain slot lease spans up to 96 weeks, broken into 12-week increments.
- In 2025, Polkadot replaced crowdloans with the Agile Coretime model.
- DOT holders can now participate in leasing resources through staking and governance, not just crowdloans.
- The auction structure still uses a candle auction model.
- This evolving model enhances participation flexibility.
- Lease periods remain structured but more adaptable thanks to Agile Coretime’s dynamic scheduling.
Blockchain Interoperability Data
- Polkadot’s architecture centers on cross-chain interoperability.
- Communication leverages the Cross‑Consensus Message Passing (XCMP) protocol.
- The Relay Chain coordinates secure data and asset transfers among parachains.
- Bridges additionally connect Polkadot with external networks like Ethereum and Bitcoin.
- The Zero Trust Chain design pattern aims to enhance interoperability and security.
- Polkadot’s shared‑security model supports multiple parachains.
- Parathreads offer a pay‑as‑you‑go model.
- The network is used for efficient cross-chain messaging, vital to Web3 functionality.
Consensus Mechanism Statistics
- Polkadot uses Nominated Proof‑of‑Stake (NPoS) consensus.
- Consensus combines BABE block production and Phragmén election-based validator/nominator selection.
- Polkadot’s Nakamoto coefficient increased from 132 to 165 by March 2025, indicating improved validator distribution.
- Active validators increased from 297 to nearly 600 by early 2025.
- Active core developers stabilized at 122 weekly, a 1.5% QoQ uptick.
- 421 active ecosystem developers weekly, down 5.7% QoQ, with 3,000 weekly commits, down 14.4% QoQ.
- Approval-based elections involve 1,000 candidates and tens of thousands of weighted voters.
Decentralization Indicators
- The rising Nakamoto coefficient (from 132 to 165) suggests increasing decentralization.
- Validator count expansion from 297 to 600 underscores growing network participation.
- The number of developers increased slightly, though contributions declined.
- Governance relies on delegated and direct voters, though participation fell in Q1 2025.
- Polkadot network telemetry reveals that out of over 200 registered parachains, roughly 30 maintain consistent block production and transactional volume.
- Shared security through NPoS decentralizes economic influence.
- Polkadot’s architecture supports structural decentralization.
Security and Economic Metrics
- DOT staking increased 7.9% QoQ, reaching 843.9 million DOT staked.
- The Treasury value stands at $106 million (31.1M DOT).
- $76 million (22.2M DOT) is available for discretionary use.
- $21.8 million (6.4M DOT) is reserved for targeted purposes.
- Treasury spent $27.6 million (6.8M DOT) in Q2 2025.
- Inflation offsetting burn led to a net-positive Treasury result.
- Crowdloan funds and Agile Coretime support economic governance.
Ecosystem Growth Metrics
- Unique account growth surged 150%, from 5.2 million to 13.2 million.
- Transaction volume grew over 200%, from 13.1 million to 39.6 million.
- 216 parachain projects were registered on Polkadot and Kusama as of April 2025, though activity levels vary significantly.
- Polkadot ranked 4th among L1s, with 95 key developers as of 2025.
- Only a subset of parachains drives most activity (30 chains).
- Developer numbers reflect a contraction in broader engagement.
- UX programs and grants improved onboarding in Q1 2025.
Token Distribution & Holdings
- Crowdloans raised 131 million DOT.
- Staked DOT reached 843.9 million.
- The Treasury holds 31.1 million DOT ($106 million).
- Economic layers structure DOT allocation across governance and growth.
- Agile Coretime shifted distribution to on-demand, dynamic allocation.
- No fixed max supply, but staking and Treasury anchor DOT’s role.
Platform Upgrade and Development Statistics
- Agile Coretime launched in Q3 2024.
- Polkadot 2.0 underpins enhancements.
- Developer tooling added multisig, proxy signer, and ink! support.
- Developer activity dipped, even as core developer counts rose.
- UX-related programs and grants launched.
- Kusama’s stress test reached 143,000 TPS at 23% capacity.
Conclusion
Polkadot’s landscape is shaped by dynamic innovation and growing adoption. The transition to Agile Coretime and the continued roll-out of Polkadot 2.0 underscore its push for scalability and accessibility. While sector activity remains concentrated among leading parachains, ecosystem growth is real, and unique accounts and transactions have more than doubled year‑over‑year.
Governance and staking reinforce security and economic structure, while the Treasury’s net-positive result signals sound financial governance. As Polkadot refines interoperability, developer tools, and user experience, its architecture offers a compelling foundation for Web3 scale and flexibility. Dive into the data and implications with fresh eyes, and see how Polkadot is setting the stage for the future of decentralized infrastructure.


