Cryptocurrency mining has grown from a niche activity into a global energy-intensive industry. Mining operations consume electricity at the scale of nation-states, driving both environmental scrutiny and policy debate. In sectors like data centers and national grids, mining’s demand affects electricity pricing, grid stability, and renewable energy adoption. Below, we present core statistics and developments to guide understanding, and invite you to explore the sections that follow.
Editor’s Choice
- Bitcoin’s annual energy consumption in 2025 is estimated at 173 TWh.
- Renewable energy usage in Bitcoin mining rose to 52.4% in 2025 (including wind, hydro, and nuclear).
- The global carbon footprint of Bitcoin mining reached 39 million metric tons CO₂ in 2025.
- The U.S. share of global electricity consumption by crypto mining is estimated at 0.6% to 2.3% of national electricity use.
- The global mining hardware market was valued at $23.7 billion in 2024.
- The global crypto mining market was valued at $2.2 billion in 2024, with projected growth to $3.3 billion by 2030.
Recent Developments
- AI data centers are expected to match or exceed Bitcoin mining’s power use by late 2025.
- Mining’s share from renewables and natural gas has risen by over 10% since 2023.
- Countries like Russia now apply seasonal or regional mining bans to stabilize grids.
- Over 40% of major mining firms now use dynamic load flexibility for cost and carbon savings.
- Global mining hardware sales grew 18% YoY as new, efficient ASICs, GPUs, and FPGAs enter the market.
- Select projects are testing quantum-inspired mining for future energy breakthroughs.
- At least 12 major economies increased regulation or imposed new mining taxes in 2025.
- Debates continue on whether mining can serve as a grid-flexible load for soaking up surplus renewables.
Bitcoin Mining Power Consumption by Country
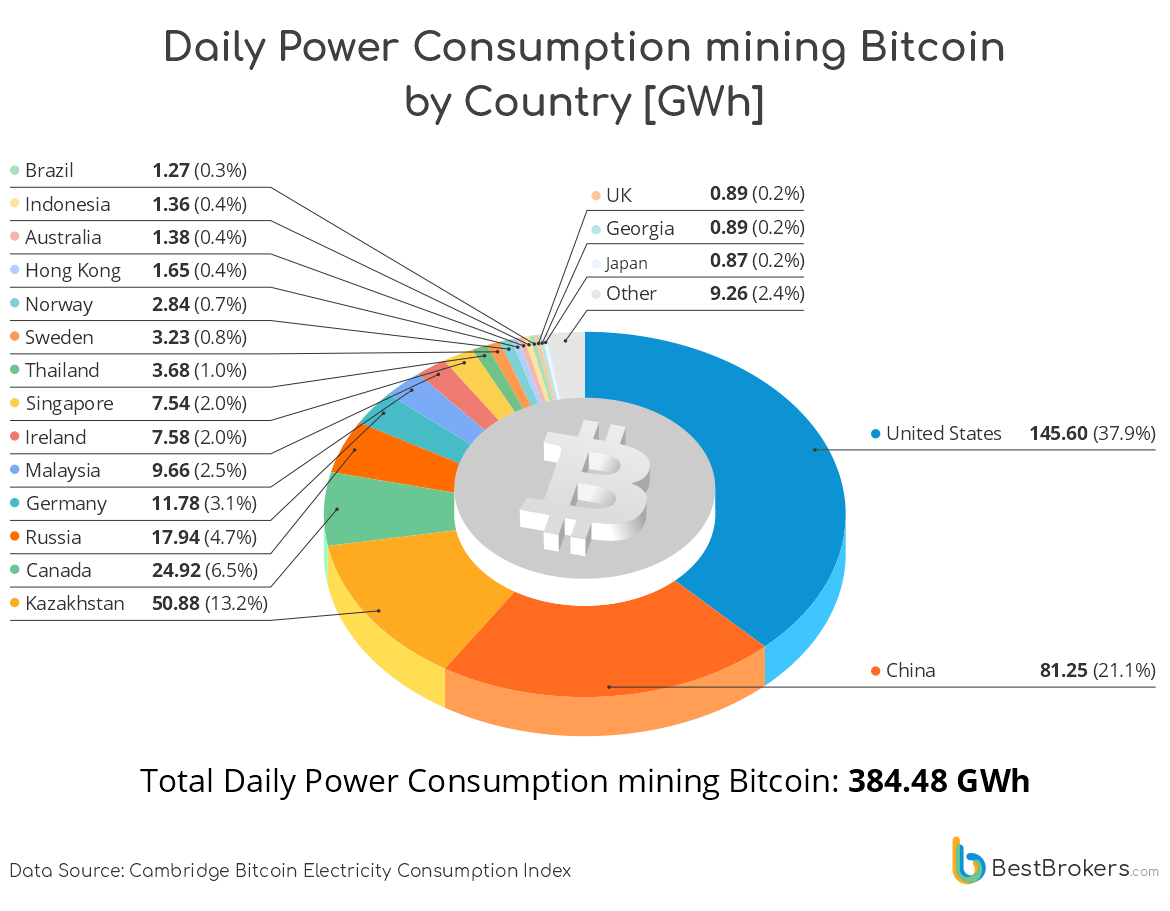
- The United States leads global Bitcoin mining power use with a massive 145.60 GWh daily, making it the largest energy consumer in the sector.
- China still plays a significant role with 81.25 GWh daily consumption, despite previous crackdowns on mining operations.
- Kazakhstan ranks third with 50.88 GWh daily, driven by low electricity costs and a growing mining presence.
- Canada consumes 24.92 GWh per day, reflecting its appeal due to cold climates and renewable energy capacity.
- Russia contributes 17.94 GWh daily, continuing its strong foothold in the mining ecosystem.
- Germany and Malaysia follow with 11.78 GWh and 9.66 GWh, respectively, highlighting growing activity in both regions.
- Ireland and Singapore each contribute over 7.5 GWh daily, despite being smaller markets geographically.
- Countries like Sweden, Thailand, Norway, Hong Kong, Australia, Indonesia, and Brazil contribute between 1.2–3.7 GWh per day each.
- Smaller contributors, including the UK, Georgia, and Japan, each consume under 1 GWh per day.
- The “Other” category accounts for 9.26 GWh daily, capturing energy usage from a diverse group of lower-volume mining countries.
- Total global daily power consumption for Bitcoin mining is estimated at 384.48 GWh, underscoring the sector’s massive energy footprint.

Global Cryptocurrency Mining Energy Consumption
- Bitcoin alone is estimated to consume ~173 TWh annually in 2025.
- Some sources estimate lower, e.g., 150 TWh, as a conservative figure.
- The Bitcoin network’s consumption rivals that of mid-sized nations like Poland.
- The annual energy usage of crypto mining is sometimes scaled from Bitcoin metrics and including other chains, which yields slightly higher totals.
- Proportionally, mining’s share of U.S. electricity use is estimated in the range 0.6–2.3%.
- Growth trends, electricity demand for crypto has risen sharply year over year.
- The Cambridge Bitcoin Electricity Consumption Index (CBECI) remains a key reference for tracking network-wide use.
- The aggregation across multiple cryptocurrencies suggests total computing demand may exceed Bitcoin’s footprint.
Cryptocurrency Mining Carbon Footprint
- Bitcoin mining’s 2025 CO₂ emissions are estimated at 39 million metric tons.
- That emission level is comparable to the entire carbon output of Qatar.
- Earlier studies (2020–2021) show ~85.9 Mt CO₂e for Bitcoin.
- Emissions per unit energy are influenced by the fuel mix (coal, natural gas, renewables) used by miners.
- As mining moves toward gas and renewables, the carbon intensity per MWh may decline.
- Some analyses argue that renewables-based mining can facilitate grid decarbonization if used smartly.
- Reassessments suggest earlier carbon estimates may have overstated coal use in some regions.
- However, as mining scales, absolute emissions remain a mounting concern globally.
Global Bitcoin Mining Energy Mix
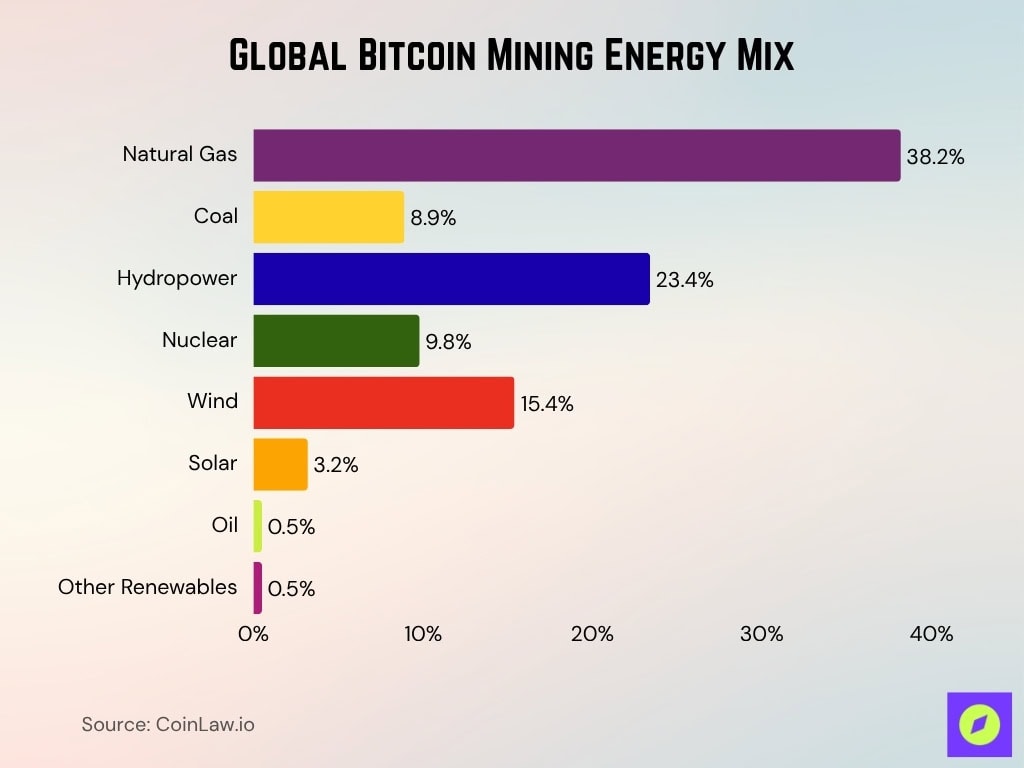
- Natural gas accounts for 38.2% of the total energy used in Bitcoin mining globally, making it the leading source in 2025.
- Coal now only accounts for 8.9% of Bitcoin mining’s energy, significantly lower than in previous years.
- Hydropower supplies 23.4% of Bitcoin’s mining energy, reinforcing its role as the top renewable source for miners.
- Nuclear power provides 9.8% of the global mining energy mix, offering a substantial low-carbon input.
- Wind energy contributes 15.4%, reflecting the industry’s continued shift towards sustainable power solutions.
- Solar power delivers 3.2% of energy for Bitcoin miners worldwide.
- Oil and other renewables together make up just 0.5% of the energy mix, highlighting a minor but present diversification.

Electricity Consumption by Country Comparison
- In the U.S., cryptocurrency mining accounts for 0.6% to 2.3% of national electricity consumption.
- Bitcoin’s global electricity share is estimated at 0.5% to 0.6% of all electricity demand.
- As of mid-2025, Bitcoin mining draws ~10 GW of continuous power, equivalent to ~168 TWh/yr.
- Estimates place Bitcoin’s annual consumption between 155 TWh and 172 TWh, comparable to the energy use of a country like Poland.
- In Iceland and Norway, mining operations benefit from cheap, renewable power and cool climates.
- Kazakhstan’s share of global mining energy fell to about 7% in 2025 amid tighter state controls.
Cryptocurrency Mining vs Traditional Financial Systems
- Traditional card networks like Visa consume just 1–5 Wh per transaction.
- Mining’s marginal per-transaction energy cost is far higher than ACH or wire transfers, which use less than 0.1 kWh.
- Bitcoin’s per-transaction energy is hundreds of thousands of times higher than digital banking.
- Total banking infrastructure energy use likely exceeds crypto overall when scaled for global transaction volume.
- Banking systems’ energy goes into branches, ATMs, and data centers, all major contributors.
- Some Bitcoin miners tap excess renewable energy, but most banks cannot flex their infrastructure load similarly.
Regional and Country Breakdown of Mining (US, China, Kazakhstan, etc.)
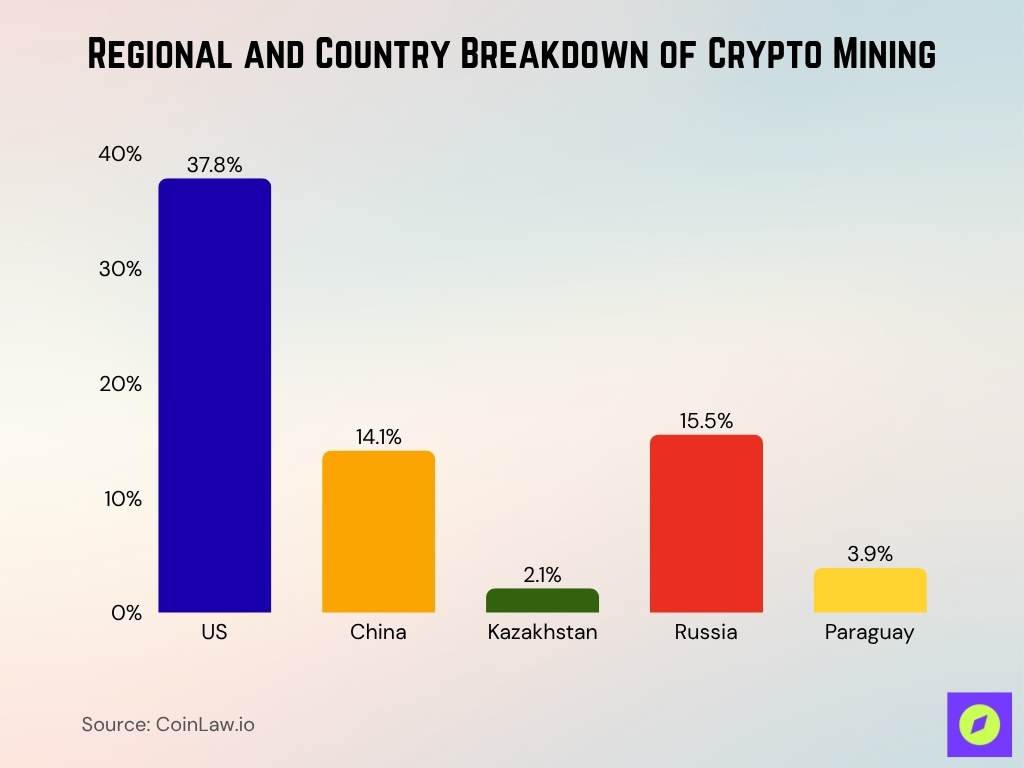
- The United States leads with about 37.8% of the global Bitcoin hashrate in 2025.
- China holds 14.1% of the global mining share despite the strict 2021 crackdowns.
- Kazakhstan’s mining hashrate fell to just 2.1% by Q4 2025.
- Russia controls roughly 15.5% of the network’s total mining capacity in 2025.
- Pakistan allocated 2,000 MW of electricity to Bitcoin mining and AI centers in 2025.
- Paraguay now claims about 3.9% of worldwide Bitcoin mining, thanks to >99% hydro power.
- Iceland and Norway are favored for mining with their low-cost renewable energy climates.
- Some Iranian mining operations trigger power outages and rolling blackouts due to grid stress.
- Recent regulation in New York now requires environmental assessments for proof-of-work (PoW) mining to estimate emissions and water use. Contemporary measurement-based data from an operational site of Marathon Digital (MARA) in Granbury, Texas, indicate that a large Bitcoin mine uses less than one-third the water of the average U.S. household and about 0.0006 % of what a typical gold mine uses. Peer-reviewed studies, including Sai and Vranken (2023), have also shown that earlier transaction-based models significantly overstated Bitcoin’s total water consumption.

Electricity Consumption per Transaction
- Bitcoin uses about 1,335 kWh of energy per transaction in 2025, though this figure can vary depending on the methodology and assumptions used in estimating network energy consumption.
- That’s roughly the energy consumption of a U.S. household over 45 days.
- In contrast, Ethereum under PoS uses ~35 Wh per transaction.
- Thus, a PoW transaction can consume 30,000× more energy than a PoS transaction.
- Transaction count is part of the denominator; when blockchains scale, per-transaction energy may decline somewhat.
- Some high-throughput blockchains achieve <1 Wh per transaction under PoS or hybrid models.
- As fees rise, more transactions are batched, improving energy usage per record.
- Efficiency gains in mining hardware (cooling, energy reuse) help reduce the share of energy that contributes to per-transaction cost.
Environmental Initiatives in Crypto Mining
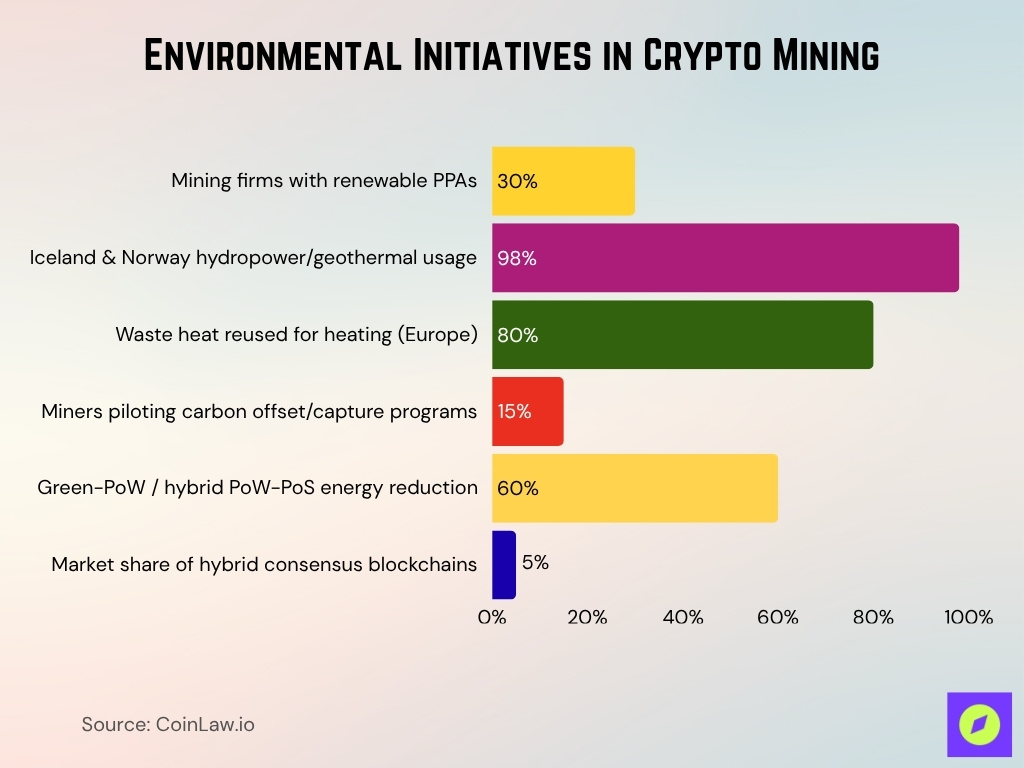
- Over 30% of major mining firms now have PPAs with renewable power producers.
- In Iceland and Norway, over 98% of mining is powered by hydropower or geothermal energy.
- Some European mining operations redirect up to 80% of waste heat for local greenhouse or building heating.
- At least 15% of top miners now pilot carbon offset or capture initiatives.
- Test deployments of Green‑PoW and hybrid PoW/PoS aim to slash energy use up to 60%.
- Hybrid models are in use by emerging blockchains and now represent 5% of market share.

Mining Hardware Efficiency and Trends
- The global mining hardware market was valued at $23.7 billion in 2024.
- Hash rate in 2025 peaked at ~617 EH/s, up ~38% year over year.
- Energy intensity per Bitcoin mined rose to 209 MWh/BTC in 2025, up from 202 MWh last year.
- Newer ASICs offer 20–30% better energy efficiency over prior generation machines.
- Cooling innovations (immersion, liquid, evaporative) are increasingly adopted to lower waste energy.
- Some miners co-locate operations near renewable energy facilities to reduce transmission losses.
- Modular and portable mining units allow shifting to locations with cheaper power.
- GPU-based mining, though less efficient for Bitcoin, remains important for altcoins.
- Research continues into quantum or photonic mining, but these remain experimental at scale.
Proof of Work vs Proof of Stake Energy Impact
- Proof of Work mining consumes over 99% more energy than Proof of Stake systems.
- Ethereum’s merge to PoS cut its energy use by around 99.95%.
- Bitcoin PoW uses ~1,300–1,400 kWh per transaction, while PoS needs only tens of Wh.
- PoS validators operate on minimal hardware, often just a laptop or standard server.
- PoW networks generate significant e-waste due to short hardware lifespans.
- PoS systems promote staking over hardware competition, curbing energy escalation.
- Leading blockchains like Solana, Cardano, and Polkadot are all PoS-based for energy savings.
- Hybrid models combine PoW and PoS, reducing energy but keeping robust security.
- Regulators increasingly favor PoS for meeting national sustainability goals.
Renewable Energy in Crypto Mining
- In 2025, about 52.4% of Bitcoin mining energy comes from renewables.
- The previous global mining renewable energy share was estimated at 25–41% before 2023’s shift.
- Iceland and Norway’s mining fleets run on more than 98% hydropower and geothermal.
- Renewable-based mining can reduce carbon intensity to as low as 50 gCO₂/kWh.
- Many miners now use PPAs with solar, wind, or hydro to secure green energy for up to 10 years.
- Projects tapping curtailed renewable energy can absorb up to 15% of local grid oversupply.
- Using renewables shields mining operators from fossil fuel price swings and potential carbon taxes.
- Flexible, renewable-based mining setups offer up to 80% price savings during low-demand periods.
Cryptocurrency Mining Market Size and Revenue
- The global cryptocurrency mining market was valued at $2.2 billion in 2024 and is projected to grow to $3.3 billion by 2030, at a CAGR of 6.9%.
- Bitcoin miners earned $11.2 billion in 2025, reflecting a 7.1% year-over-year rise in mining rewards.
- In Q1 2025, mining revenue globally dropped by $900 million, down to $3.86 billion, marking an 18% year-over-year decline.
- Top miners produced 9,746 BTC in Q1 2025.
- Public mining firm Cormint reported Q1 2025 mining revenue of $9.4 million, with power expenses per BTC hitting $35,508.
- In May 2025, Bitcoin mining revenue jumped by ~20%, driven primarily by North American operations, which made up 26.3% of global mining activity.
- Hyperscale Data reported $1.8 million in revenue from mining ~15.9 BTC in July 2025.
- Cloud-mining platforms are scaling rapidly in 2025.
- Regional breakdowns show North America leading with $777.1 million in revenue by 2023.
Mining Profitability and Cost Analysis
- Mining profitability in 2025 depends heavily on electricity rates, with many operations targeting < $0.03/kWh.
- Power expenses per BTC reached $35,508 in Q1 2025.
- Operating and administrative costs per BTC reached $54,002 in Q1 2025.
- Average Bitcoin production cost hovered around $90,000+ per BTC in May 2025.
- Profitability tightens as hash rate and difficulty rise.
- Home mining ROI in 2025 generally ranges from 8 to 18 months, depending on ASIC model and electricity price.
- Large miners negotiate lower power rates, better cooling, and direct grid access.
- Many marginal miners drop out in weak price periods.
- Some firms diversify into cloud mining or hosting models.
Scalable Solutions and Future Outlook
- Over 60% of new crypto projects launched in 2025 use energy-efficient PoS consensus.
- PoS and sidechains can reduce network energy use by more than 99% compared to PoW.
- At least one-third of large mining operations now participate in grid demand response programs.
- Next-gen cooling can lower mining energy costs by up to 25%.
- Siting mining near renewables cuts transmission losses by about 5–10% on average.
- AI-based optimization allows mining rigs to cut costs and emissions, boosting efficiency by 10–15%.
- Over 12 countries considered or implemented policies on mining emissions or carbon pricing in 2025.
- Energy-hungry data centers, AI, and mining collaborations are up 40% year-over-year.
Frequently Asked Questions (FAQs)
About 173 TWh per year.
Approximately 52.4 % (renewable + nuclear).
Roughly 1,335 kWh per transaction.
Between 0.6% and 2.3% of U.S. electricity use.
Conclusion
Cryptocurrency mining stands at a crossroads, still consuming energy at a national scale, yet simultaneously pushing innovation in sustainability, grid integration, and market economics. The balance of profitability, regulation, and environmental responsibility will define the path forward. As the sector evolves, understanding the trends and trade-offs is more important than ever. I invite you to dive into the full article for deeper insights across all sections.


