Car insurance is one of those essential expenses most drivers in the US need to factor into their budget. Whether you’re a seasoned driver or just getting your license, the costs, coverage, and trends of car insurance can vary significantly depending on where you live and your driving profile. As we head into 2025, the car insurance industry continues to evolve, driven by technological advancements, regulatory changes, and shifts in consumer behavior. In this article, we’ll explore the latest statistics and trends shaping the car insurance landscape, offering a data-driven perspective to help drivers and industry stakeholders make informed decisions.
Editor’s Choice: Key Market Insights
- The global car insurance market is projected to reach $1.08 trillion in 2025, growing at a CAGR of 8.4% through 2032.
- The U.S. car insurance market is valued at approximately $218.6 billion, with projections to reach $436 billion by 2034.
- Telematics-based insurance policies are expected to grow at a CAGR of 18.5% from 2025 to 2035, reaching a market size of $19.34 billion by 2035.
- California’s average annual premium for full coverage car insurance is $3,026, compared to the national average of $2,692.
- The percentage of uninsured drivers in the U.S. stands at 14.0%, with Washington, D.C. having the highest rate at 25.2%.
- Electric vehicle insurance premiums are, on average, 23% higher than for gas-powered vehicles, primarily due to higher repair costs.
- The rise of artificial intelligence in claims processing has reduced the average claim settlement time by 50%, significantly improving customer satisfaction.
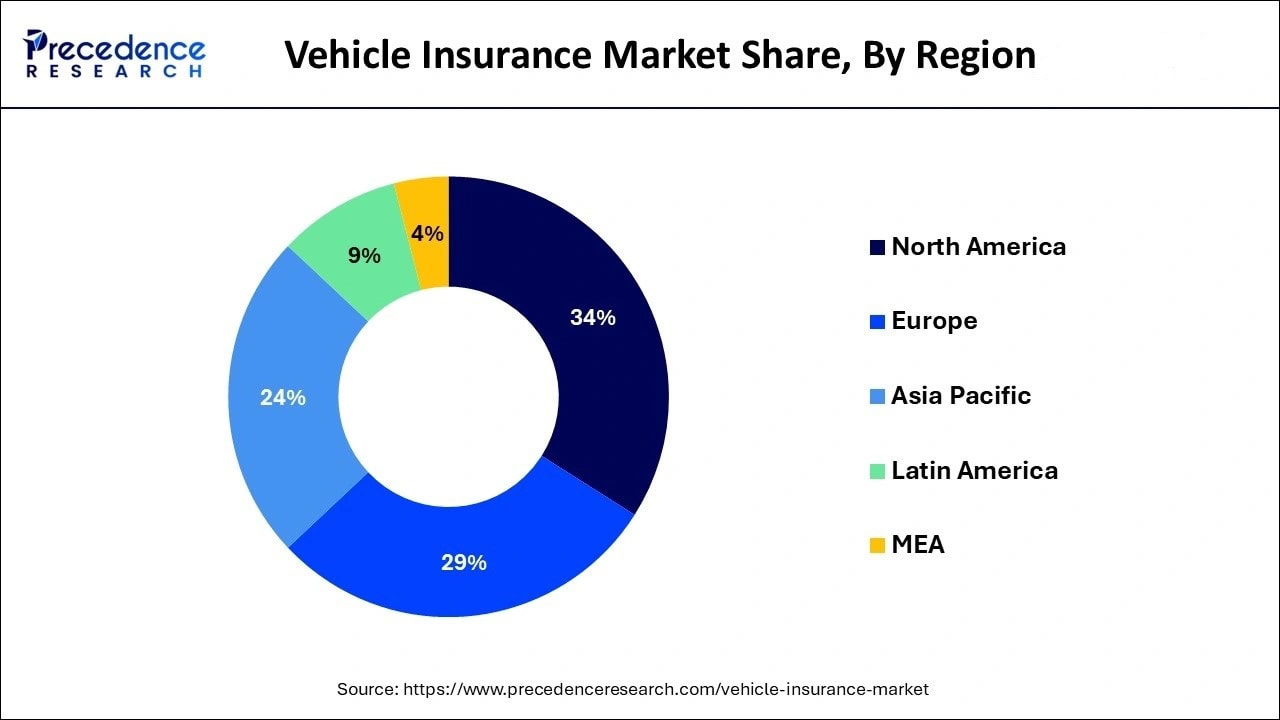
Vehicle Insurance Market Share by Region
- North America leads the global market with a 34% share in vehicle insurance.
- Europe follows with a significant 29% market share.
- Asia Pacific holds 24%, reflecting strong regional demand and population density.
- Latin America contributes 9%, showing moderate market activity.
- Middle East and Africa (MEA) accounts for the smallest portion at 4%.

Car Insurance Statistics by State
- Michigan remains among the most expensive states for car insurance, with average premiums around $3,375 per year in 2025, largely due to the state’s no-fault insurance laws and a high proportion of uninsured drivers.
- Hawaii has the lowest average car insurance cost in 2025, at approximately $810 annually, thanks to state laws limiting the impact of driver demographics such as age and gender.
- California, with its large population and high traffic density, saw an average insurance premium of $2,692 in 2025, ranking among the most expensive states.
- Florida’s average car insurance premiums stand at $3,950 in 2025, driven by the state’s high number of uninsured drivers and frequent severe weather events.
- New York ranks among the top five most expensive states, with average annual premiums of $3,848 in 2025, due to its dense urban areas and higher cost of living.
- Ohio boasts one of the lowest average car insurance costs in 2025, with drivers paying an average of $781 annually, attributed to the state’s relatively low accident and theft rates.
- Louisiana saw a significant increase in premiums in 2025, with average rates rising to $3,626, due to frequent claims from weather-related damages and high accident fatality rates.

Car Insurance Affordability
- On average, car insurance premiums in the U.S. accounted for 3.39% of the median household income in 2025, varying widely by state.
- Drivers with poor credit scores pay, on average, 105% more for car insurance compared to those with excellent credit, significantly affecting affordability for low-income individuals.
- Young drivers, particularly those aged 16-25, pay some of the highest premiums, with an average annual cost of $4,188, making insurance unaffordable for many without family assistance.
- Low-mileage drivers (those who drive less than 7,500 miles annually) can save up to 22% on their car insurance premiums with mileage-based policies.
- Seniors aged 65 and older typically see their premiums increase by 10-15%, especially in states that allow age-based premium adjustments.
- Multi-policy discounts, where drivers bundle home and auto insurance, helped reduce premiums by an average of 20% in 2025.
- Military personnel and veterans often qualify for special discounts, reducing their premiums by up to 60% through providers such as USAA.
Monthly Car Insurance Cost by Vehicle Type
- SUV and Small SUV both cost $157/month for full coverage.
- Pickup trucks have a slightly higher average at $158/month.
- Sedans cost around $175/month, showing a moderate increase.
- Electric sedans (Sedan – EV) are the most expensive, at $206/month.

Percentage of Uninsured Drivers by State
- Mississippi leads the nation in uninsured drivers, with 29.4% of motorists uninsured in 2025, significantly higher than the national average.
- Michigan follows closely, with 25.5% of drivers uninsured, contributing to higher premiums for insured drivers in the state.
- New Jersey has one of the lowest rates of uninsured drivers, with only 3.1% of its drivers uninsured in 2025, thanks to stringent state insurance laws.
- California, despite its high insurance costs, has a relatively high uninsured driver rate of 16.6%, translating to millions of uninsured vehicles.
- Alaska saw a significant reduction in uninsured drivers, dropping to 11.3% in 2025, due to new state-enforced penalties for uninsured motorists.
- North Carolina maintains one of the lower uninsured rates, at 10.3%, thanks to robust state insurance requirements and enforcement measures.
- Texas has an uninsured driver rate of 14.0%, contributing to higher premiums, especially in urban areas such as Houston and Dallas.

Coverage Insights
- Liability coverage is mandatory in most states, with minimum coverage limits varying widely; in 2025, the average liability premium is $631 annually.
- Comprehensive and collision coverage, which protects against non-liability claims such as theft and natural disasters, average $420 and $290 per year, respectively, in 2025.
- Uninsured motorist coverage is growing in importance, with 1 in 8 drivers in the U.S. being uninsured; in states like Florida, where 20% of drivers are uninsured, this coverage can add $150–$200 to annual premiums.
- Personal injury protection (PIP) is mandatory in no-fault states like Michigan and adds an average of $402–$536 to premiums in 2025.
- Gap insurance, which covers the difference between a vehicle’s depreciated value and the amount owed on a loan, is increasingly adopted in 2025, with the market size growing to $4.38 billion in 2025.
- Rental reimbursement coverage, which provides for a rental car if your vehicle is being repaired after an accident, costs an average of $35 per day for up to 30 days in 2025.
- Roadside assistance, often bundled with comprehensive coverage, costs an additional $14–$100 annually in 2025, depending on the provider, but provides peace of mind for drivers in the event of a breakdown.
Key Factors Affecting Premiums
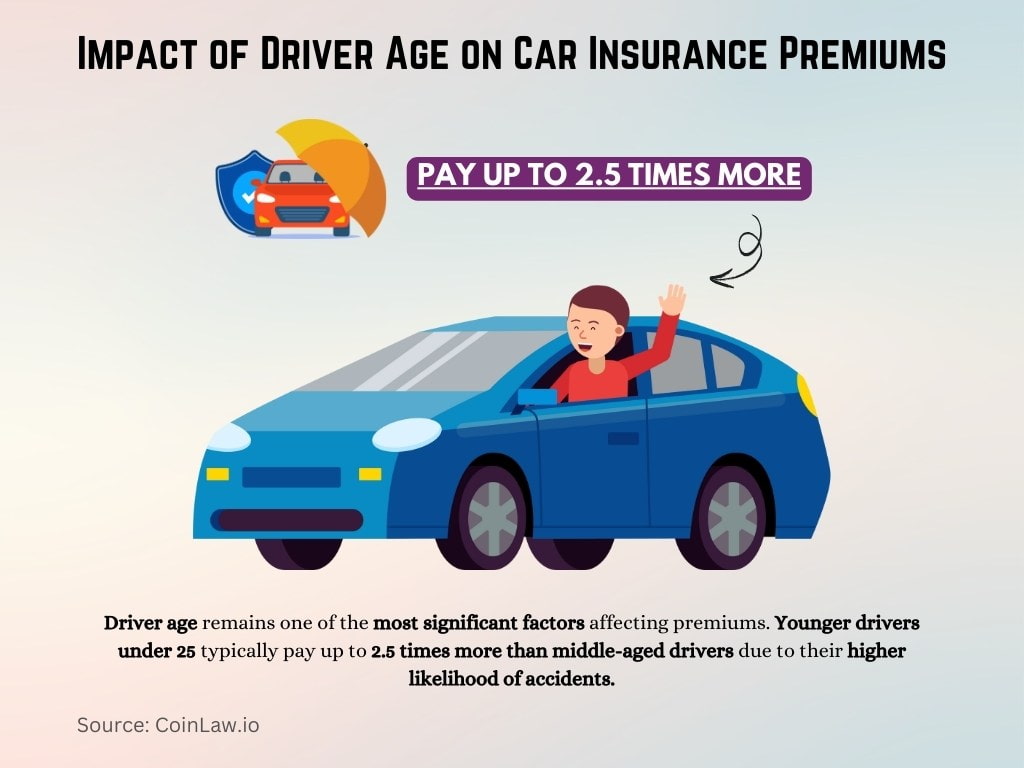
- Driver age remains one of the most significant factors affecting premiums. Younger drivers under 25 typically pay up to 2.5 times more than middle-aged drivers due to their higher likelihood of accidents.

- Location plays a crucial role in determining premiums. Urban drivers tend to pay 35% more than those in rural areas due to higher accident rates and increased theft risks.
- Driving history can increase premiums drastically. A driver with a single at-fault accident could see their insurance premiums rise by an average of 45%.
- Vehicle type impacts premiums, with luxury vehicles costing 20-30% more to insure than standard vehicles due to higher repair and replacement costs.
- The credit score is used as a pricing factor in many states, and drivers with poor credit scores can pay as much as 71% more for insurance compared to those with excellent credit.
- Annual mileage also affects premiums, with high-mileage drivers (over 20,000 miles annually) paying about 12% more than low-mileage drivers.
- Gender is a factor in some states. For example, male drivers under 30 can pay as much as 12% more than their female counterparts in certain regions.
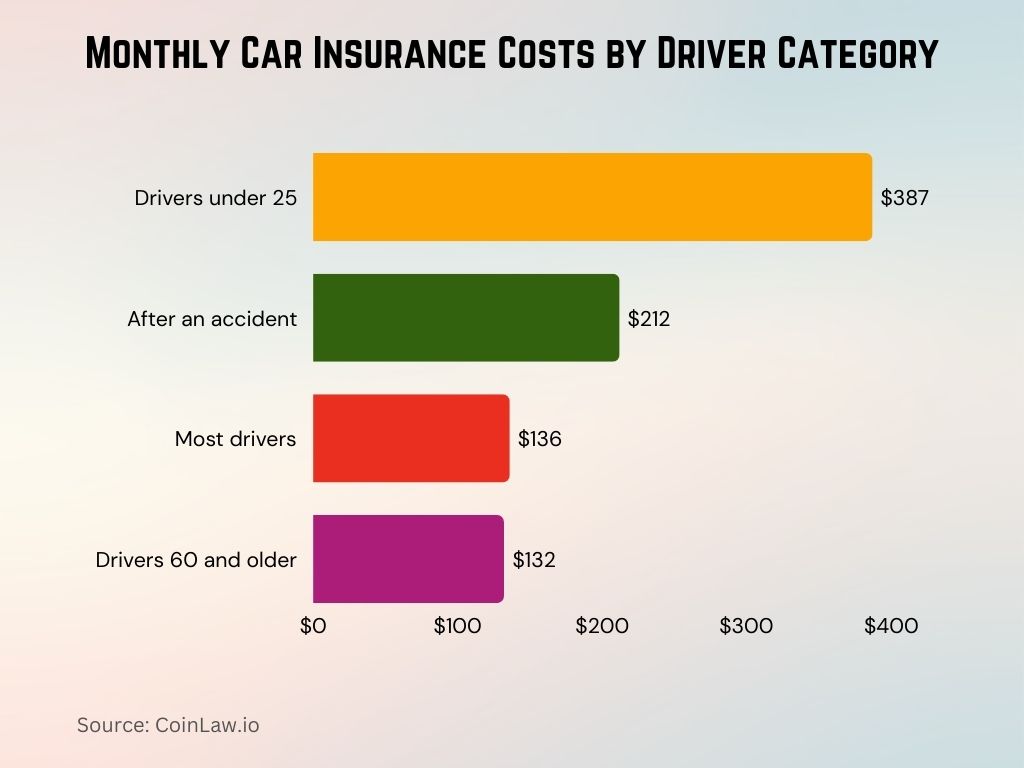
Monthly Car Insurance Costs by Driver Category
- Drivers under 25 pay the highest monthly premium at $387, due to higher risk profiles.
- Drivers with a recent accident pay an average of $212 per month, highlighting the impact of driving history.
- Most drivers pay around $136 per month for full-coverage insurance.
- Drivers aged 60 and older enjoy the lowest rates, averaging just $132 monthly.

Technological Influence on Insurance Rates
- Telematics technology, which tracks driving behavior through devices or mobile apps, led to an average premium reduction of 10-15% for safe drivers.
- The use of AI in claims processing is speeding up claims handling, reducing the average settlement time by up to 40%, leading to lower administrative costs for insurers.
- Autonomous vehicles are expected to significantly reduce premiums by 25% by 2030 as accidents caused by human error decrease.
- Vehicle safety features, such as automatic emergency braking and lane departure warnings, led to lower premiums for 73% of drivers with cars equipped with these systems.
- Connected cars, which report real-time data on vehicle health and driving behavior, are anticipated to reduce the frequency of breakdowns and claims by 15% in the next few years.
- Insurance mobile apps, now offered by over 80% of insurers, provide customers with real-time policy information, claim filing, and driver discounts, improving customer experience.
- Blockchain technology is being explored by insurers to increase transparency in policy management and claims handling, reducing fraud and saving costs.
Number of Insurance Providers
- The U.S. car insurance market is dominated by a few large companies, with the top 10 insurers holding 77% of the market share in 2025.
- State Farm remains the largest provider, holding 18.88% of the market, with $67.75 billion in premiums written.
- Progressive follows closely, with a 16.73% market share, writing $60.05 billion in premiums.
- GEICO (Berkshire Hathaway) holds an 11.64% market share, with $41.76 billion in premiums written.
- Allstate holds 10.19% of the market, with $32.8 billion in premiums, making it the fourth largest provider.
- USAA, which serves military families, has a 6.16% share of the market, with $19.8 billion in premiums written.
- There are over 500 car insurance providers operating in the U.S. as of 2025, but the top 10 companies dominate the landscape, leaving smaller insurers to compete in niche markets and regional policies.

Recent Developments
- Usage-based insurance (UBI) continues to grow, with the market projected to reach $83.11 billion in 2025, representing a 31.8% CAGR.
- The shift to electric vehicles has prompted insurers to adjust premiums, with 5% to 15% discounts now offered to EV owners by various insurers.
- Climate change has become a significant factor, with insurers increasingly factoring in weather-related risks such as hurricanes and wildfires into their pricing models.
- AI-powered claims processing is now being adopted by 20% of major insurers, reducing costs and improving claim response times by up to 50%.
- Insurance fraud detection technology, including machine learning algorithms, is projected to save the industry between $80 billion and $160 billion in fraudulent claims by 2032.
- Pay-per-mile insurance saw a 15% increase in adoption, as more drivers work remotely and drive fewer miles post-pandemic.
- The introduction of climate-related discounts for low-emission and fuel-efficient vehicles is expected to be a major trend in 2025, as insurers respond to increasing regulatory pressure to support environmental goals.
Conclusion
The car insurance industry continues to evolve, driven by technology, environmental considerations, and changes in consumer behavior. From the growth of telematics-based policies to the impact of climate change on premium rates, insurers are adapting to new challenges and opportunities. Understanding these trends and leveraging the latest statistics can help consumers make better decisions and insurers stay competitive in a rapidly shifting market.


