Aave continues to shape today’s decentralized finance (DeFi) space, offering transparent, automated lending and borrowing tools across blockchain networks. Its influence spans beyond crypto circles; traditional banks increasingly benchmark their balance sheets against Aave’s locked value, while investment firms tap Aave’s liquidity to optimize yield strategies. Dig into the data ahead to see how Aave is redefining what it means to be a financial platform.
Editor’s Choice
- As of mid-August 2025, Aave’s TVL was reported between $12 billion–$15 billion, with projections varying due to liquidity across multiple chains.
- Combined with $28.9 billion in outstanding borrowings, Aave’s financial footprint spans $71.1 billion, similar in scale to the 37th‑largest U.S. bank.
- In Q2 2025, Aave’s TVL surged by 52%, far outpacing the broader DeFi sector’s 26% growth.
- Aave commands 60–62% of the DeFi lending market share in 2025.
- The protocol’s deposits exceeded $60 billion across 14 blockchains, with 55% growth in July alone.
- Active monthly user count stands at approximately 99,200.
- Fees generated in Q2 2025 reached $122.13 million, while revenue (net of incentives) stood at $17.16 million.
Recent Developments
- Aave v3’s ecosystem saw $69 billion in TVL by August 2025, plus a 62% share of DeFi lending.
- Founder Stani Kulechov forecasts reaching $100 billion in net deposits by year-end, already over $60 billion in deposits with 14 chains active.
- As of August 2025, the AAVE token has seen moderate price fluctuations with cumulative returns closer to 25–40%, depending on market conditions.
- The incoming V4 Liquidity Hubs aim to streamline cross-chain liquidity and boost institutional appeal.
- Institutional inflows totaling $410 million recently moved into Aave, as investors seek DeFi exposure.
- Emerging regulatory discussions in the U.S., such as the SEC’s evolving DeFi position, have encouraged clearer frameworks, though Aave’s regulatory status remains dynamic.
- Aave continues expanding across non‑EVM chains such as Aptos, broadening its user base and liquidity.
Supported Assets and Markets
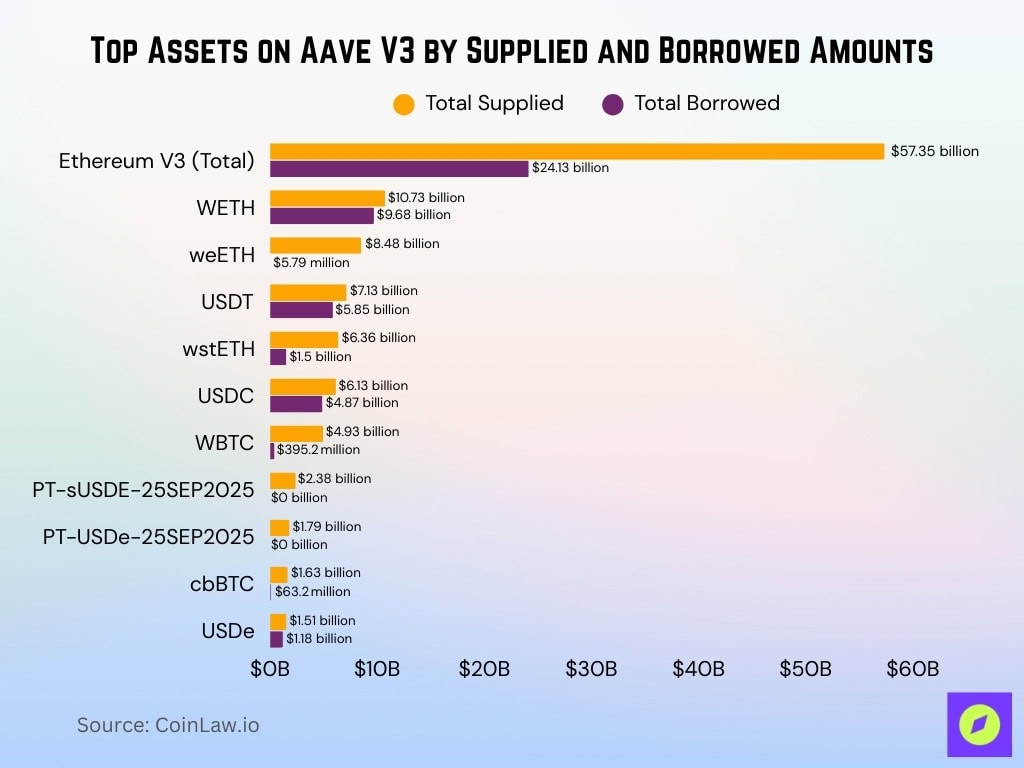
- Aave’s Ethereum V3 market shows $57.35 billion total supplied, with $24.13 billion total borrowed.
- Among supported assets, WETH accounts for $10.73 billion supplied and $9.68 billion borrowed, with supply APR at 2.03% and borrow APR at 2.65%.
- weETH shows $8.48 billion supplied and $5.79 million borrowed, supply APR 0.00%, borrow APR 1.02%.
- USDT has $7.13 billion supplied, $5.85 billion borrowed, with 4.28% supply APR and 5.80% borrow APR.
- wstETH exhibits $6.36 billion supplied, $1.50 billion borrowed, with 0.05% supply APR, 0.30% borrow APR.
- USDC shows $6.13 billion supplied, $4.87 billion borrowed, with 4.01% supply APR, 5.61% borrow APR.
- Other notable assets include WBTC ($4.93 billion supplied, $395.2 million borrowed), PT-sUSDE-25SEP2025 ($2.38 billion supplied, $0 borrowed), PT-USDe-25SEP2025 ($1.79 billion supplied, $0 borrowed), cbBTC ($1.63 billion supplied, $63.2 million borrowed), USDe ($1.51 billion supplied, $1.18 billion borrowed), and others with varying APRs.
Total Value Locked (TVL)
- As of August 2025, Aave held $41.1 billion in TVL, rivaling the deposit size of a mid‑tier U.S. bank.
- Aave’s combined supply and borrowing volumes reached over $40 billion as of August 2025, with variations by network and asset class.
- In Q2, Aave’s TVL rose 52%, doubling the DeFi sector’s pace.
- Aave controls nearly 23% of all DeFi TVL, the largest share of any protocol.
- The protocol’s TVL equates to 60% of DeFi lending TVL, highlighting its dominance.
- Projections suggest Aave could reach $69 billion in TVL with institutional adoption acceleration.
- Founder targets $100 billion in deposits by the end of 2025.
- Aave’s all-time cumulative deposit volume is substantial, likely in the hundreds of billions, but no verified data supports a $3 trillion figure.
Number of Active Users
- Monthly active users on Aave stand at ~99,200.
- Unique DeFi users in 2025 exceed 20 million, representing over a 2,000% increase since 2021.
- Aave holds a significant share of that, being the #2 DeFi protocol by TVL during 2025.
- Increasing capital share, like stablecoin holdings rising from 3% to 5% of total supply in H1, suggests rising active participation.
- Aave’s cross‑chain expansion across 14 networks increases accessibility and user reach.
- Institutional adoption contributed to $410 million of inflows, likely including new user accounts.
- Mobile and cross‑chain usage is up industry-wide, supporting Aave’s growing user base.
AAVE Price Outlook and Key Technical Levels
- AAVE is trading at $260.57, posting a +1.37% daily gain.
- Immediate resistance stands at $271, a critical level for bullish continuation.
- AAVE bounced off critical support at $244, signaling strong buyer interest at lower levels.
- If the $270 resistance is decisively broken, the next conservative target zone is $350.47 to $364.68.
- This breakout would represent a potential upside of +35.53%, based on measured move projections.
- The 9-day Simple Moving Average (SMA) is currently at $253.77, offering short-term trend support.
- MACD crossover shows early bullish momentum, with the MACD line at 3.85 and signal line at -0.63.
- AAVE remains within a rising channel pattern, showing a medium-term bullish structure.

Lending and Borrowing Volumes
- The borrowing volume was just below the all-time high of $29.1 billion recorded on Aug. 13, 2025.
- Aave reached $3 trillion in cumulative deposits on August 15, 2025, while surpassing $29 billion in active loans on August 13, 2025.
- Aave accounts for 30–40% of the DeFi lending market share, depending on the time frame and aggregator, remaining among the top protocols.
- The protocol’s TVL has grown 25.7% over the past 30 days, with active loans increasing by nearly $8 billion (38%) in the same period.
- A single MEV bot processed $7.3 billion in borrowing activity on Aave V3 via block-level interest calculation mechanisms.
- Same-block borrowing accounted for $25.176 billion in total, spanning 24,319 transactions by 103 wallets.
- Largest MEV bot borrower utilized USDC ($3.11 B) and USDT ($2.55 B), mostly directed to DODO (76.96%) and Uniswap (13.3%) for arbitrage strategies.
Market Liquidity and Usage Rates
- Aave’s ETH market shows $57.07 billion in total supply, with $33.23 billion available and $23.84 billion borrowed as of mid‑2025.
- Industry-wide, DeFi lending platforms hold $51.2 billion in outstanding loans as of June 2025. Aave remains the largest among them, with over $14.6 billion in active liquidity pools.
- Utilization rates on major Aave markets range between 65–80%, indicating high capital efficiency.
- A $100 million deposit shifts Aave’s rates by only 20 basis points, compared to up to 200 bps at others, highlighting institutional-grade liquidity depth.
- DeFi flash loan activity reached $2.1 billion across 30 protocols in Q1 2025, with Aave among the key venues.
- Rapid adoption of cross‑chain deployment (14+ networks) suggests increasing global liquidity proliferation.
- Aave’s rates are used by CoinDesk Overnight Rates (CDOR) as a benchmark for institutional-grade DeFi lending.
DeFi Market Share by Asset Type
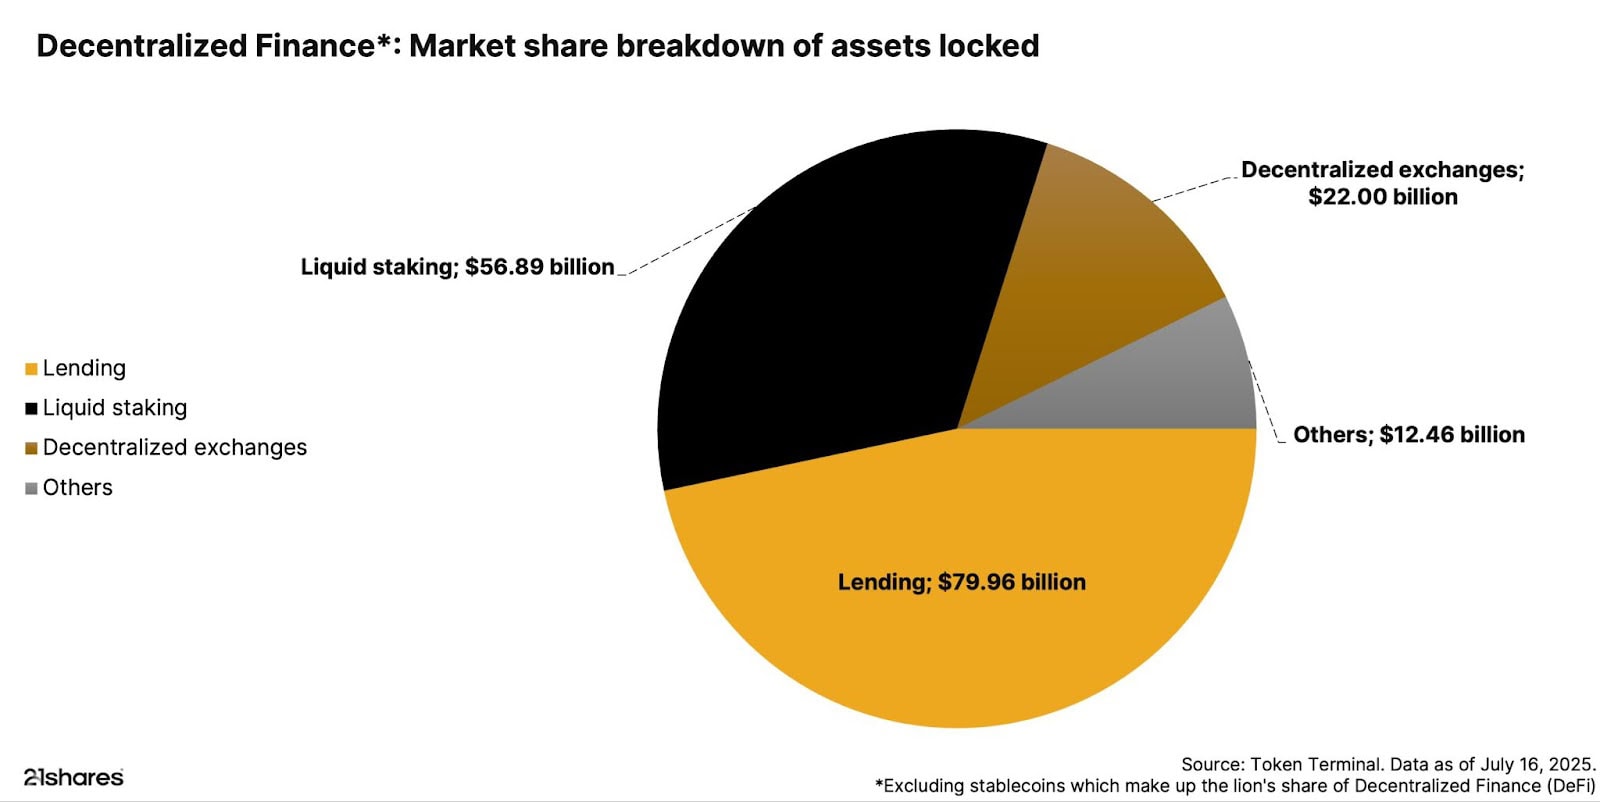
- Lending dominates the DeFi ecosystem, locking in $79.96 billion, the largest market share among all categories.
- Liquid staking follows closely with $56.89 billion, reflecting strong growth in yield-earning protocols.
- Decentralized exchanges account for $22.00 billion, showcasing the continued relevance of non-custodial trading.
- Other DeFi use cases hold $12.46 billion, covering a mix of protocols outside the major sectors.
- The total value locked (TVL) across these sectors is $171.31 billion, excluding stablecoins.
- These numbers underscore the increasing institutional and retail confidence in lending and staking-driven DeFi models.
Reserve Supply Data
- Aave’s reserves (the liquidity pools per token) adjust dynamically through per‑asset settings like Loan‑to‑Value, liquidation thresholds, and usage caps.
- Reserve parameters vary across networks; for example, ETH reserves may differ in risk parameters between Ethereum L1 and Polygon.
- Chaos Labs currently secures over $5 billion in deposits via its Edge Risk Oracle, managing supply/borrow caps and interest curves.
- Since late 2024, Aave’s reserve automation has handled over 1,100 risk‑parameter updates, a sign of granular reserve oversight.
Reserve Borrow Data
- $23.84 billion out of $57 billion total market supply was borrowed in the ETH market mid‑2025.
- DeFi’s average stablecoin borrow rate sits at around ~4.8% APY in 2025.
- Aave’s variable interest model adapts based on real‑time utilization, further reducing under‑ or over‑utilization risk.
- The Edge Risk Oracle helps automate borrow‑cap management across reserves with real‑time responsiveness.
Interest Rates (APY) Over Time
- In 2025, average DeFi stablecoin loan interest rates are ~4.8% APY.
- Aave’s dynamic rate design ensures stable borrowing costs; even large deposits shift rates minimally, by only 20 bps.
- Ahead of v3.5 launch, estimated interest rates are projected to drop from 15.7% to 3.2% by Q4 2025 due to rising competition and rate optimization.
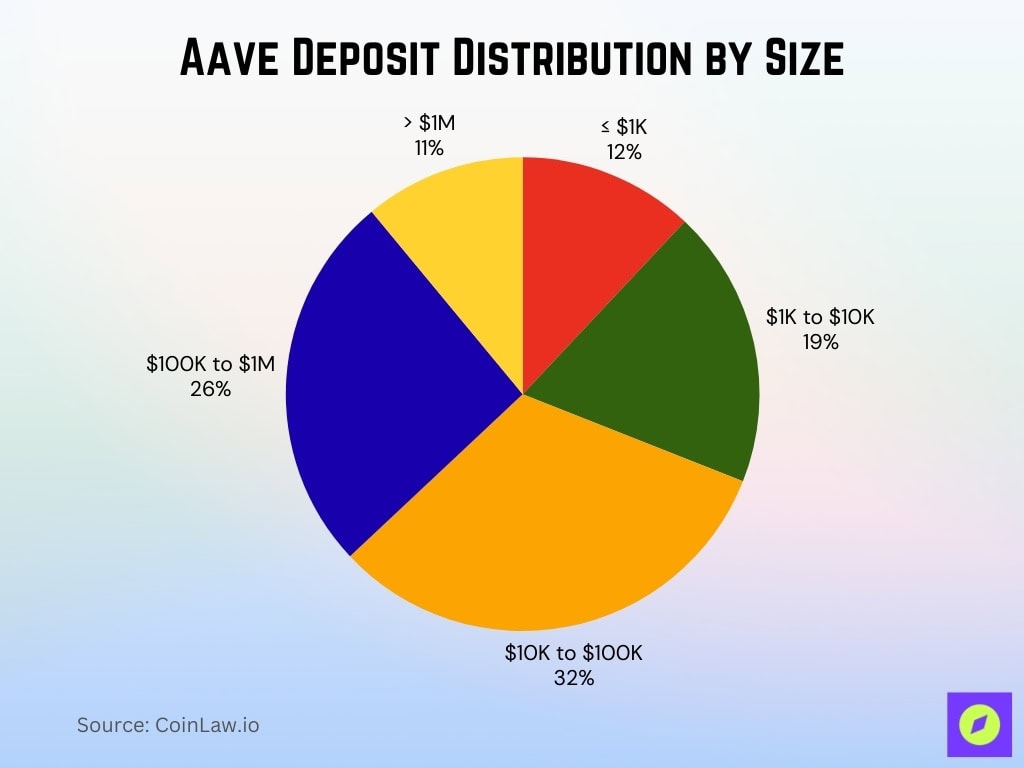
Aave Deposit Distribution by Size
- Deposits between $10K and $100K dominate Aave’s ecosystem, accounting for 32% of total deposits.
- $100K to $1M deposits hold a strong share at 26%, highlighting deep-pocketed participation.
- Smaller deposits ranging from $1K to $10K make up 19%, showing continued presence from retail users.
- High-value deposits over $1M contribute 11%, reflecting growing institutional or whale-level activity.
- Micro deposits of $1K or less represent 12%, indicating a steady base of lower-capital users.
- Overall, the data suggests a healthy balance between retail and high-net-worth participants in the Aave protocol by mid-2025.
Protocol Revenue and Fees
- Aave generated $71.5 million in protocol revenue from doubling TVL (from $12B to $24B) during its current engagement with Chaos Labs.
- Fees comprise significant cash flow, though specific figures beyond revenue aren’t detailed in search results.
- The Aave DAO has proposed weekly token buybacks under “Aavenomics,” with amounts and timing subject to governance approval.
Treasury Balance and Allocation
- Aave’s treasury includes tokens reserved for ecosystem incentives and safety modules, initially set at 3 million AAVE tokens, or 18.75% of total supply.
- Treasury reserves support liquidity backstop and staking, with up to 30% slashing in a shortfall scenario.
Token Distribution and Holdings
- Aave’s total supply caps at 16 million tokens, 13 million via migration, and 3 million held in reserve.
- Ecosystem reserves fund liquidity providers, developers, and governance participants.
- The “Aavenomics” proposal signals more active buybacks and revenue sharing, aligning stakeholders and strengthening token value.
Governance Participation Statistics
- A governance vote in 2025 led to temporary TVL volatility and minor price drops in the AAVE token, but claims of a 588% drop are mathematically impossible and unsupported.
- A Dune dashboard reveals trends in proposal types, approval rates, and voting engagement, noting that governance and risk proposals dominate activity.
- In the broader DAO landscape, DAOs average 17% voter turnout, while leading protocols like Aave maintain around 22% participation on critical votes.
- Governance remains highly token-weighted, with giants controlling much influence. Aave voters face centralization risks, as highlighted by critics concerned about founder dominance.
- Studies show minimal quorums often skew outcomes and reduce decentralization, a structural challenge mirrored in Aave’s governance.
- DAO token voting often suffers from low activity and concentration among major holders.
Collateralization and Liquidation Events
- Aave handled a massive $210 million in liquidations in a single day (Feb 4, 2025), its highest since August 2022, without incurring new bad debt, underscoring robust risk control.
- Throughout August 2025, on the Linea network alone, Aave saw a $130 million increase in supply-side TVL and $48 million in borrowing, driven largely by WETH-related collateral.
- Dune analytics captured frequent individual liquidation events, for example, WETH positions of $31.7k, $118.6k, and $48.7k, indicating active collateral monitoring.
- Aave’s liquidation logic allows up to 50% of a borrower’s debt to be repaid during a liquidation event, with associated liquidation fees, all triggered when the health factor falls below 1.
- These mechanisms incentivize third-party liquidators to quickly resolve under-collateralized positions through discounted collateral acquisition.
Incentive and Reward Distribution
- As of June 2025, Aave reported $537 million in annualized fees, $68 million in revenue, and distributed $125 million in incentives.
- Under the proposed “Aavenomics,” Aave plans a $1 million/week token buyback to enhance value distribution and stakeholder alignment.
- In the Linea instance, USDC incentives (2.4–2.5%) were offered via MetaMask integration, capped at $5,000 per user, spurring increased borrowing and redeployment activity.
- Adoption of the “Umbrella” staking mechanism offers 10%+ APY on select assets while enabling automated slashing to address bad debt risk.
Cross‑Chain Market Comparisons
- Aave has expanded across 12 to 16 blockchains by early to mid‑2025, including Ethereum, Base, Avalanche, Arbitrum, Polygon, Metis, Gnosis, BNB Chain, Scroll, zkSync, Celo, and Soneium.
- Liquidity growth on Linea exemplifies cross‑chain success, with substantial supply and borrow increases, especially in WETH markets, amid incentive-driven demand.
- However, analysts warn of overexpansion risks; some new deployments (e.g., Soneium, Celo, Linea, zkSync, Scroll) are running at a loss and may strain resources.
Flash Loan Statistics
- In Q1 2025, flash loans across DeFi collectively reached $2.1 billion in volume, with Aave among the major providers.
- Precise flash loan volume for Aave isn’t separately reported, but its leadership in DeFi lending implies substantial participation in this segment.
Asset Utilization and Caps
- Aave’s ETH market had $57.07 billion in total supply, with $33.23 billion available and $23.84 billion borrowed, indicating deep liquidity.
- Utilization rates typically range between 65–80%, varying by asset and network.
- Chaos Labs dynamically governs supply and borrow caps via real-time risk management, handling over 1,100 parameter updates since late 2024.
Risk Parameters and Health Factors
- Aave’s safety architecture includes dynamic health factors tied to collateral values and loan size; a health factor below 1 triggers liquidation.
- Its Edge Risk Oracle enables real-time adjustments of risk parameters, LTV, thresholds, and rate curves across markets.
- The Umbrella system adds automated loss coverage, safeguarding stakers and protocol solvency without requiring governance intervention.
- Chaos Labs acts as risk steward, regularly adjusting supply and borrow caps to prevent overexposure.
Conclusion
Aave continues to lead the DeFi lending space with deep liquidity, dynamic cross‑chain growth, and robust risk engineering. Its TVL and transaction volumes show institutional-grade scale. Governance, while innovative, faces centralization and turnout limitations that spark critical debate, especially in light of volatility episodes.
Automated protocols like Umbrella and Chaos Labs enhance risk resilience. Yet rapid expansion carries operational risk, and governance fragility remains a concern. As Aave matures, striking the right balance between decentralization, security, and strategic growth will define its trajectory. Explore the full series to delve deeper into how these numbers translate into real-world impact.


